- Table of Content
- 1.Days without s...
- 2.Review of sola...
- 3.PROBA2 Observa...
- 4.The Internatio...
- 5.Review of geom...
- 6.Geomagnetic Ob...
- 7.The SIDC Space...
- 8.Review of iono...
2. Review of solar activity
3. PROBA2 Observations (2 Aug 2021 - 8 Aug 2021)
4. The International Sunspot Number by Silso
5. Review of geomagnetic activity
6. Geomagnetic Observations at Dourbes (2 Aug 2021 - 8 Aug 2021)
7. The SIDC Space Weather Briefing
8. Review of ionospheric activity (2 Aug 2021 - 8 Aug 2021)
Days without sunspots
Preliminary sunspot numbers by SILSO (https://wwwbis.sidc.be/silso/home ) have indicated that the Sun was spotless on 30 July and on 7 and 8 August. Being already 19 months into the new solar cycle, this may come somewhat as a surprize, in particular because there have been already some episodes of increased solar activity with elevated sunspot numbers, such as late November last year and as recent as July this year. Nonetheless, spotless days can occur well after solar cycle minimum. For example, during the previous solar cycle, spotless days were not so rare late 2010, which was 2 years after cycle minimum. And during the onset of solar cycle 23, we still had 3 spotless days in January 1998, 17 months after cycle minimum. As SC25 progresses, the number of spotless days will further decrease. The evolution can be followed on SILSO's spotless days page at https://wwwbis.sidc.be/silso/spotless
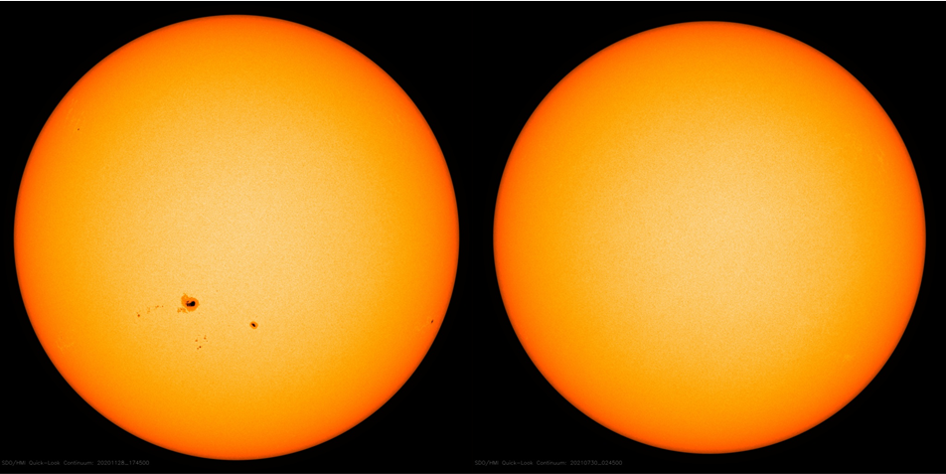
The Sun on 28 November 2020 (left) and 30 July 2021 (right). Images by SDO/HMI (https://sdo.gsfc.nasa.gov/data/aiahmi/ )
Review of solar activity
Solar activity was low.
Beta regions NOAA 2850, 2851 and 2852 all decayed to a plage before the end of the week. The GOES X-ray flux background varied between A5 and B1 level. The Sun produced no C, M or X flares.
No Earth-directed Coronal Mass Ejections were observed in available coronagraphic imagery.
The greater than 10 MeV proton flux was at nominal levels throughout the week.
The greater than 2 MeV electron flux briefly reached moderate levels both on August 4 and 5, while the greater than 2 MeV electron fluence reached moderate levels on August 6.
PROBA2 Observations (2 Aug 2021 - 8 Aug 2021)
Solar Activity
Solar flare activity was very low during the week.
In order to view the activity of this week in more detail, we suggest to go to the following website from which all the daily (normal and difference) movies can be accessed: https://proba2.oma.be/ssa
This page also lists the recorded flaring events.
A weekly overview movie can be found here (SWAP week 593): https://proba2.sidc.be/swap/data/mpg/movies/weekly_movies/weekly_movie_2021_08_02.mp4
Details about some of this week's events can be found further below.
If any of the linked movies are unavailable they can be found in the P2SC movie repository here: https://proba2.oma.be/swap/data/mpg/movies/
Wednesday Aug 04
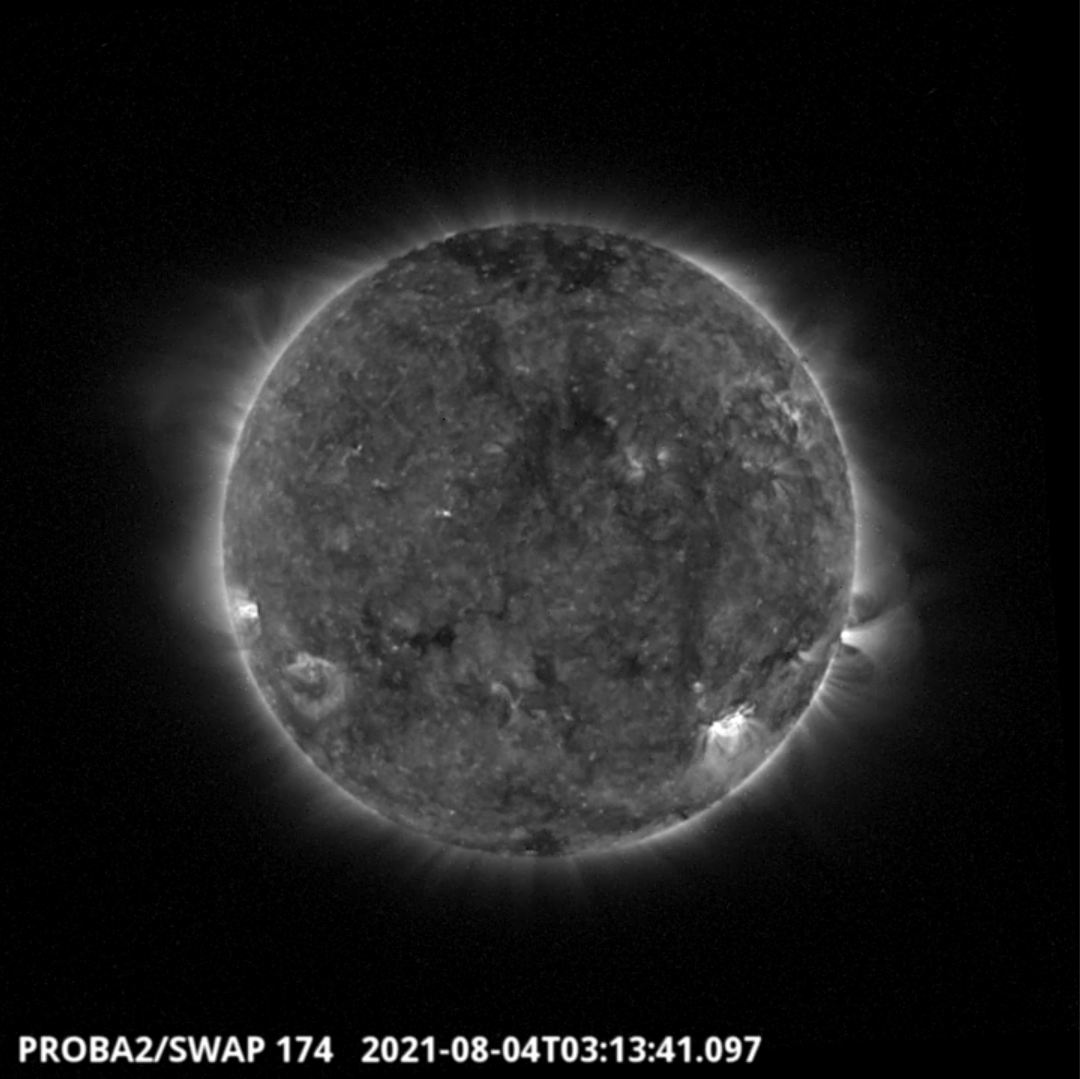
A B5.9 flare was observed by SWAP and LYRA on 2021-Aug-04. The flare and associated eruption is visible in the south-west of the solar disk on 2021-Aug-04, as shown in the SWAP image above taken at 03:13 UT.
Find a movie of the event here (SWAP movie): https://proba2.sidc.be/swap/movies/20210804_swap_movie.mp4
The International Sunspot Number by Silso
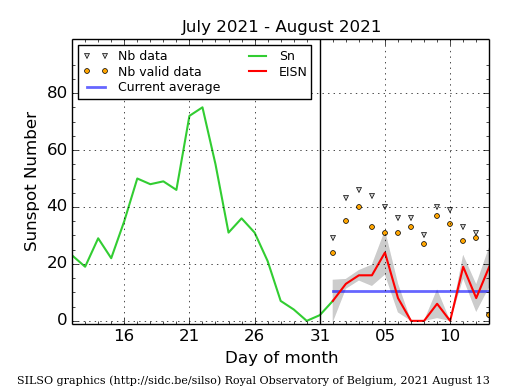
The daily Estimated International Sunspot Number (EISN, red curve with shaded error) derived by a simplified method from real-time data from the worldwide SILSO network. It extends the official Sunspot Number from the full processing of the preceding month (green line), a few days more than one solar rotation. The horizontal blue line shows the current monthly average. The yellow dots gives the number of stations that provided valid data. Valid data are used to calculate the EISN. The triangle gives the number of stations providing data. When a triangle and a yellow dot coincide, it means that all the data is used to calculate the EISN of that day.
Review of geomagnetic activity
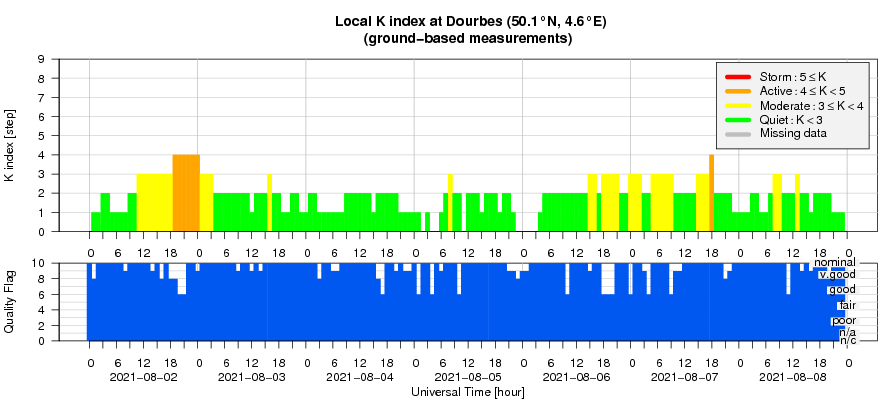
An ICME arrived near Earth around 8h UT on August 2, leading to a maximum solar wind speed of about 420 km/s and a maximal Interplanetary Magnetic Field (IMF) magnitude of about 14 nT. This ICME was probably associated with the CME that was first observed at 10:36 UT on July 28. The solar wind was nominal again early on August 3, until the arrival of a solar wind stream associated with the north polar coronal crown coronal hole arrived around 04:30 UT on August 7, leading to a maximal solar wind speed of about 500 km/s for a brief time, and a maximal IMF magnitude of about 13 nT. A gradual return to nominal solar wind levels started on August 8.
Geomagnetic levels were quiet to unsettled (K Dourbes smaller than 4) throughout the week, with the exception of a few active (K Dourbes equals 4) intervals on August 2.
Geomagnetic Observations at Dourbes (2 Aug 2021 - 8 Aug 2021)
The SIDC Space Weather Briefing
The Space Weather Briefing presented by the forecaster on duty from Aug 1 to 8. It reflects in images and graphs what is written in the Solar and Geomagnetic Activity report.

A pdf-version: https://www.stce.be/briefings/20210809_SWbriefing.pdf
The movie: https://www.stce.be/briefings/20210809_SWbriefing.m4v
Review of ionospheric activity (2 Aug 2021 - 8 Aug 2021)

The figure shows the time evolution of the Vertical Total Electron Content (VTEC) (in red) during the last week at three locations:
a) in the northern part of Europe(N61°, 5°E)
b) above Brussels(N50.5°, 4.5°E)
c) in the southern part of Europe(N36°, 5°E)
This figure also shows (in grey) the normal ionospheric behaviour expected based on the median VTEC from the 15 previous days.
The VTEC is expressed in TECu (with TECu=10^16 electrons per square meter) and is directly related to the signal propagation delay due to the ionosphere (in figure: delay on GPS L1 frequency).
The Sun's radiation ionizes the Earth's upper atmosphere, the ionosphere, located from about 60km to 1000km above the Earth's surface.The ionization process in the ionosphere produces ions and free electrons. These electrons perturb the propagation of the GNSS (Global Navigation Satellite System) signals by inducing a so-called ionospheric delay.
See http://stce.be/newsletter/GNSS_final.pdf for some more explanations ; for detailed information, see http://gnss.be/ionosphere_tutorial.php