- Table of Content
- 1.A filament goe...
- 2.Nominate candi...
- 3.Review of sola...
- 4.PROBA2 Observa...
- 5.The Internatio...
- 6.Geomagnetic Ob...
- 7.The SIDC Space...
- 8.Review of iono...
2. Nominate candidates for the international space weather and space climate medals
3. Review of solar and geomagnetic activity
4. PROBA2 Observations (16 Aug 2021 - 22 Aug 2021)
5. The International Sunspot Number by Silso
6. Geomagnetic Observations at Dourbes (16 Aug 2021 - 22 Aug 2021)
7. The SIDC Space Weather Briefing
8. Review of ionospheric activity (16 Aug 2021 - 22 Aug 2021)
A filament goes kaboom!
Solar filaments are clouds of charged particles ("plasma") above the solar surface squeezed between magnetic regions of opposite polarity. Being cooler and denser than the plasma underneath and their surroundings, they appear as dark lines when seen on the solar disk and as bright blobs when seen near the solar limb (then they are called "prominences"). Special filters are required to observe these features, such as e.g. the Hydrogen-alpha (H-alpha) filter (H-alpha a line in the red part of the solar spectrum).
Late on 13 August, a prominence became visible behind the northeast solar limb. As it got carried to and over the limb by the solar rotation, the height of the prominence rose to about 100.000 km. Certainly not a record, but many solar observers reported on the dynamics of the prominence. On 17 August, it started its transit over the solar limb. When the filament was finally fully visible on the solar disk (late on 19 August), it showed a peculiar upside-down U-shape, with its western (leading) leg somewhat longer and close to the extension of the Sun's northern polar coronal hole. The filament remained relatively stable, until it started to dissolve on 22 August, gradually erupting late on 22 and early on 23 August. The dissolution was visible in H-alpha and in extreme ultraviolet (EUV), the eruptive part was only visible in EUV.
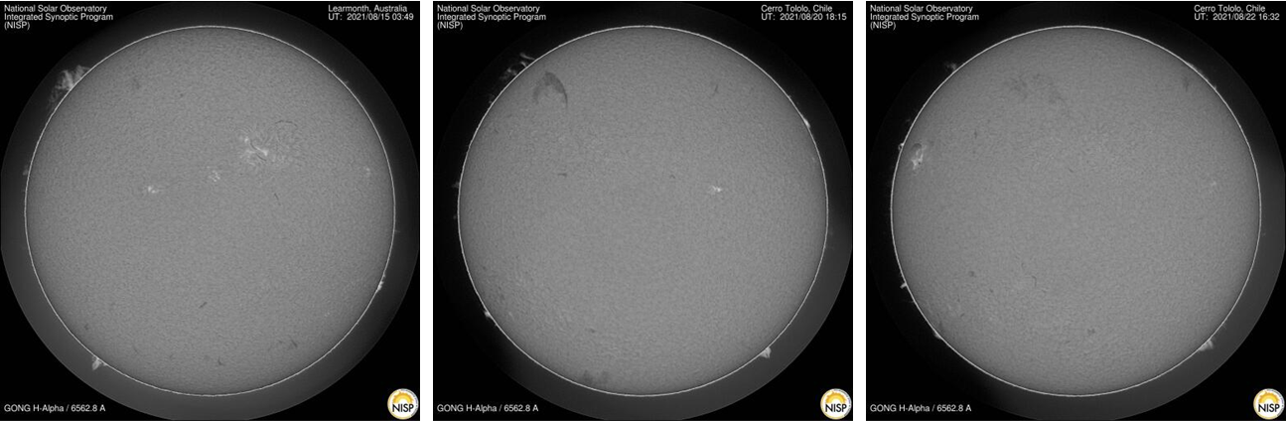
Above imagery was obtained from the GONG H-alpha Network (https://gong2.nso.edu/products/tableView/table.php?configFile=configs/hAlpha.cfg ). A movie covering the period from 13 till 23 August (a cadence of about 2 hours) is available in the online version of this article at https://www.stce.be/news/547/welcome.html

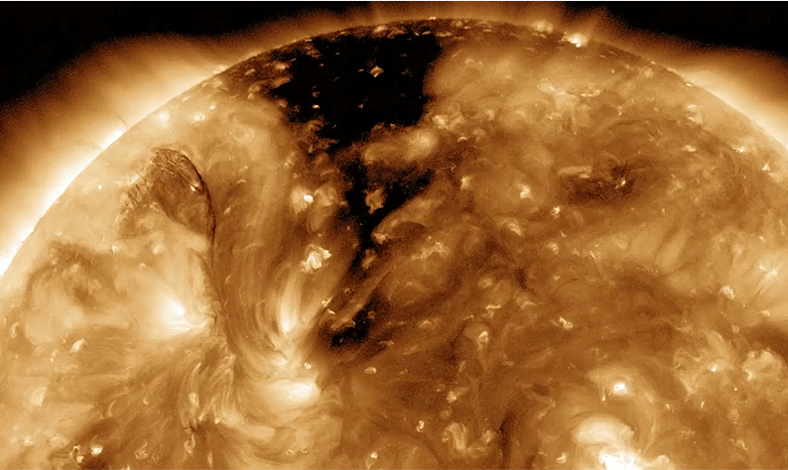
Above imagery was obtained with SDO/AIA (https://sdo.gsfc.nasa.gov/data/aiahmi/ ) from 20 till 23 August, with on the left AIA304 showing the Sun's atmosphere at relatively low temperatures of about 80.000 degrees, and on the right AIA193 covering higher temperatures near 1.25 million degrees. Whereas the AIA304 images remain closer to what was visible in H-alpha, the AIA193 images depict much better the intricate nature of the filament's dissolution and final eruption. The latter is highlighted in the zoomed version of the eruption below.
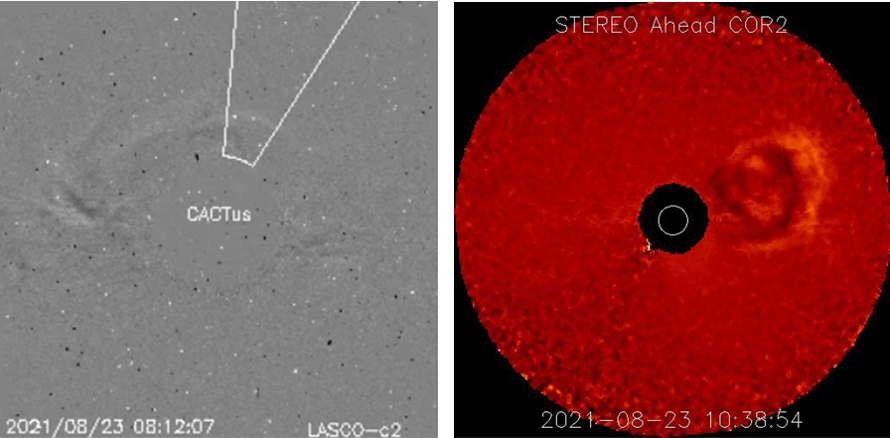
The associated coronal mass ejection (CME) was barely distinguishable in SOHO/LASCO C2 coronagraphic imagery (top left - from the CACTus website at https://wwwbis.sidc.be/cactus/ ). The bulk of the CME is directed away from Earth (northwards), but an earth-directed component is not excluded and may deliver a glancing blow within a few days (STEREO-A/COR2 image to the right - https://stereo-ssc.nascom.nasa.gov/cgi-bin/images ).
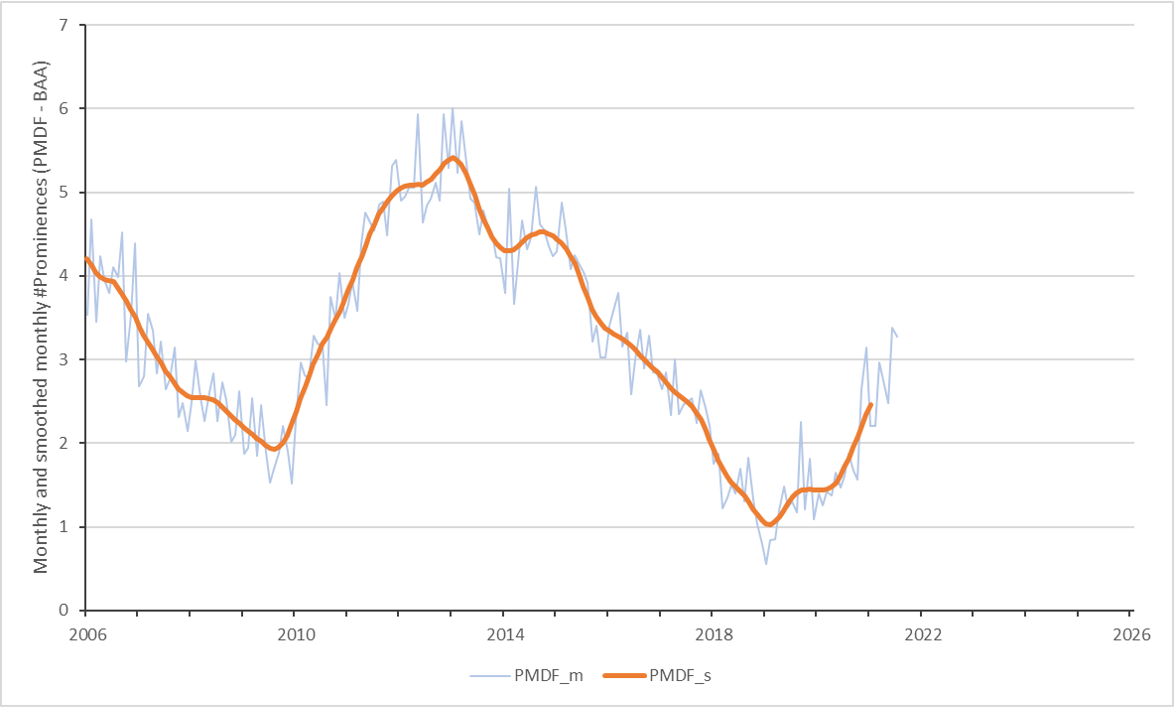
Solar observers have recorded an increased number of filaments and prominences over the last few months. The Solar Section of the British Astronomical Association (https://britastro.org/section_front/21 ) has already a decades-long track of counting the daily number of prominences (H-alpha), called the Prominence Mean Daily Frequency (PMDF). The graph above shows the monthly and monthly smoothed number of prominences as compiled from their network obvservations, clearly showing the PMDF is on the rise again after a minimum which was deeper than the previous one in 2009. With still a number of years to go to the maximum, this number is expected to further increase considerably.
Nominate candidates for the international space weather and space climate medals

The international space weather and space climate medals are prestigious recognitions of major contributions in the field of space weather, with a specific focus for each of the three medals.
The recipient of the Kristian Birkeland Medal must have demonstrated a unique ability to combine basic and applied research to develop useful space weather products that are being used outside the research community, and/or across scientific research disciplines. The work must have led to a better physical comprehension of the solar-terrestrial phenomena related to space weather, to a drastic improvement of space weather modeling, or to a new generation of instruments.
To win the Baron Marcel Nicolet Medal one must have demonstrated a unique ability to bind the space weather community in a spirit of peace and friendship, to educate within the space weather community, to go also beyond the space weather research community and address larger audiences, and/or to serve the space weather.
The Alexander Chizhevsky Medal is awarded to an early career scientist in recognition of outstanding achievements in space weather with an innovative approach. The nominee must be an early career scientist within 8 years of receiving their Ph.D. at the time of nomination.
The deadline for the 2021 contest for the international space weather and space climate medals is approaching. Please send your nominations by September, 5th 2021 latest. The new medal recipients will be announced in a medal ceremony at the European Space Weather Week, October 25th, 2021. The winners will be invited to give a 20 minutes lecture during a dedicated session.
Find all information on how to nominate a colleague at the ESWW17 website: http://esww17.iopconfs.org/medals
Review of solar and geomagnetic activity
Solar activity
The week started with NOAA regions 2853 and 2855, 2856 and 2857. NOAA AR 2858 appeared on 18 August. These ARs did not produce any flaring above the B-class level. On 20 August NOAA AR 2859 rotated into view from the east limb and produced 6 C-class flares in 2 days. The strongest was a C3.0 flare peaking at 15:57 UT on 20 August. This was the only AR visible at the end of the week
There were no Earth-directed CMEs.
The southern extension of the north polar coronal hole crossed the central meridian on 21 August.
The greater than 10 MeV proton flux was below the threshold the full week.
The greater than 2 MeV electron flux remained below the 1000 pfu during the week.
The 24-hour electron fluence was at normal levels during the whole week.
Geomagnetic activity
The Earth was immersed in slow solar wind the full week. With speeds mostly below 500 km/s and interplanetary magnetic field magnitude below 8 nT.
K was between 0 and 3, both locally at Dourbes and at planetary levels.
PROBA2 Observations (16 Aug 2021 - 22 Aug 2021)
Solar Activity
Solar flare activity fluctuated between very low and low during the week.
In order to view the activity of this week in more detail, we suggest to go to the following website from which all the daily (normal and difference) movies can be accessed: https://proba2.oma.be/ssa
This page also lists the recorded flaring events.
A weekly overview movie can be found here (SWAP week 595): https://proba2.sidc.be/swap/data/mpg/movies/weekly_movies/weekly_movie_2021_08_16.mp4
Details about some of this week's events can be found further below.
If any of the linked movies are unavailable they can be found in the P2SC movie repository here: https://proba2.oma.be/swap/data/mpg/movies/
Monday Aug 16
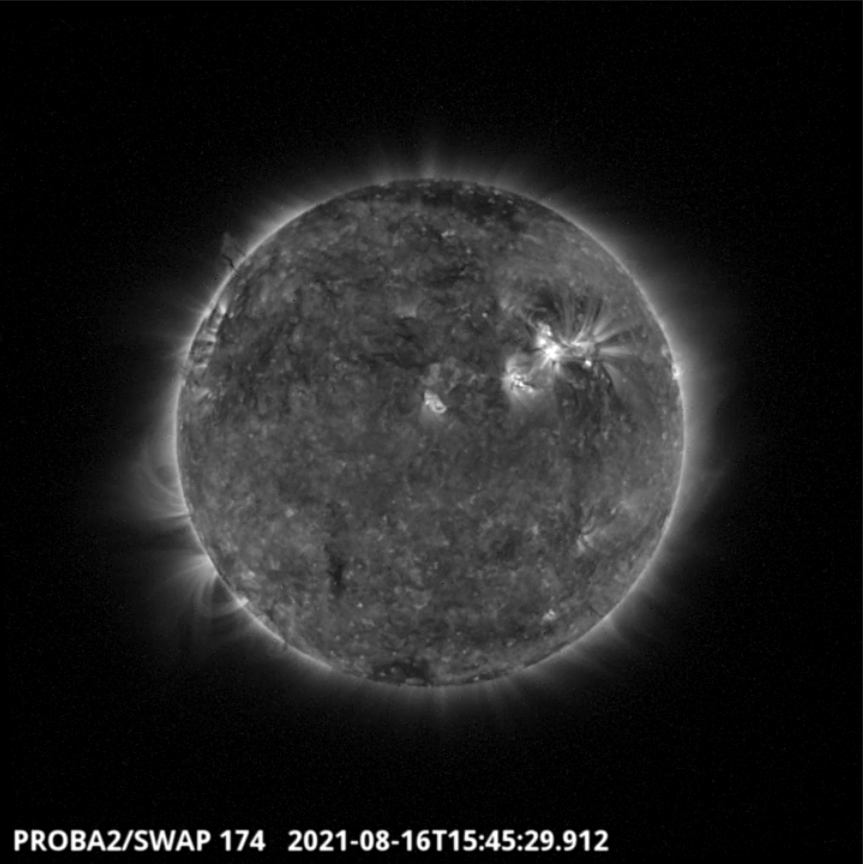
A large filament was visible on the disk for much of the week. The filament can be seen over the north-east limb on 2021-Aug-16, as shown in the SWAP image above taken at 15:45 UT.
Find a movie of the event here: https://proba2.sidc.be/swap/movies/20210816_swap_movie.mp4 (SWAP movie)
Friday Aug 20
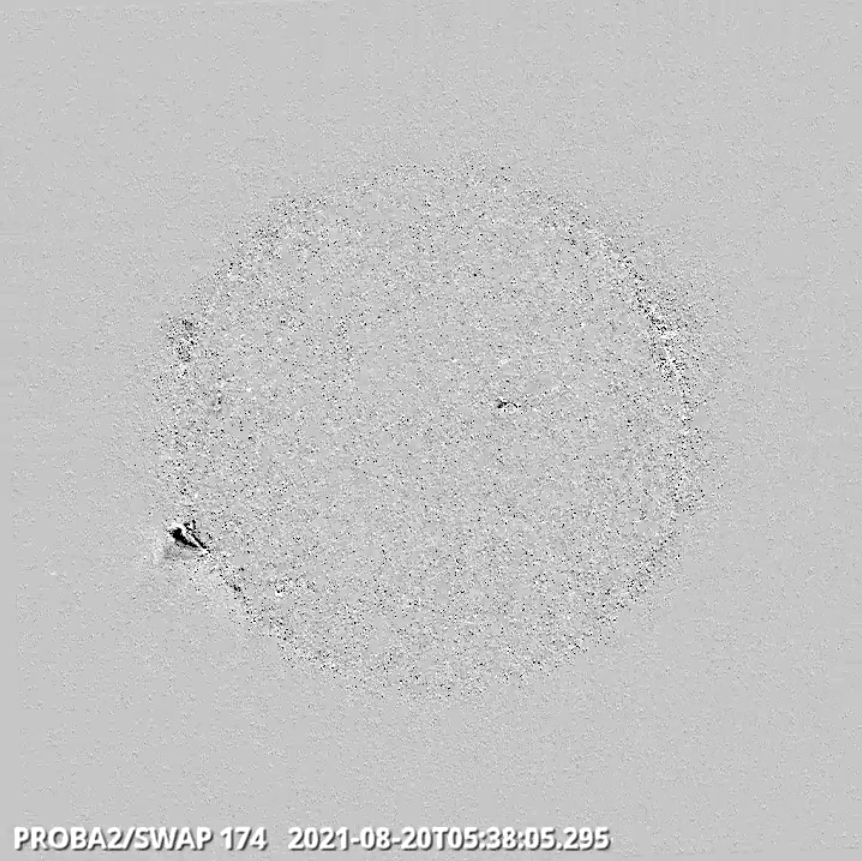
An eruption was observed by SWAP from beyond the south-east limb of the solar disk on 2021-Aug-20, as shown in the SWAP difference image above taken at 05:38 UT.
Find a movie of the entire day here: https://proba2.sidc.be/swap/movies/20210820_swap_movie.mp4 (SWAP movie) and here: https://proba2.sidc.be/swap/movies/20210820_swap_diff.mp4 (SWAP difference movie).
The International Sunspot Number by Silso
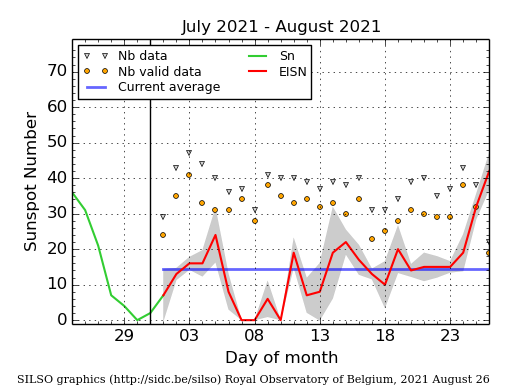
The daily Estimated International Sunspot Number (EISN, red curve with shaded error) derived by a simplified method from real-time data from the worldwide SILSO network. It extends the official Sunspot Number from the full processing of the preceding month (green line), a few days more than one solar rotation. The horizontal blue line shows the current monthly average. The yellow dots gives the number of stations that provided valid data. Valid data are used to calculate the EISN. The triangle gives the number of stations providing data. When a triangle and a yellow dot coincide, it means that all the data is used to calculate the EISN of that day.
Geomagnetic Observations at Dourbes (16 Aug 2021 - 22 Aug 2021)

The SIDC Space Weather Briefing
The Space Weather Briefing presented by the forecaster on duty from Aug 16 to 22. It reflects in images and graphs what is written in the Solar and Geomagnetic Activity report.

A pdf-version: https://www.stce.be/briefings/20210823_SWbriefing.pdf
The movie: https://www.stce.be/briefings/20210823_SWbriefing.m4v
Review of ionospheric activity (16 Aug 2021 - 22 Aug 2021)

The figure shows the time evolution of the Vertical Total Electron Content (VTEC) (in red) during the last week at three locations:
a) in the northern part of Europe(N61°, 5°E)
b) above Brussels(N50.5°, 4.5°E)
c) in the southern part of Europe(N36°, 5°E)
This figure also shows (in grey) the normal ionospheric behaviour expected based on the median VTEC from the 15 previous days.
The VTEC is expressed in TECu (with TECu=10^16 electrons per square meter) and is directly related to the signal propagation delay due to the ionosphere (in figure: delay on GPS L1 frequency).
The Sun's radiation ionizes the Earth's upper atmosphere, the ionosphere, located from about 60km to 1000km above the Earth's surface.The ionization process in the ionosphere produces ions and free electrons. These electrons perturb the propagation of the GNSS (Global Navigation Satellite System) signals by inducing a so-called ionospheric delay.
See http://stce.be/newsletter/GNSS_final.pdf for some more explanations ; for detailed information, see http://gnss.be/ionosphere_tutorial.php