- Table of Content
- 1.North and Sout...
- 2.Review of sola...
- 3.PROBA2 Observa...
- 4.The Internatio...
- 5.Review of geom...
- 6.Geomagnetic Ob...
- 7.Review of iono...
- 8.Science festiv...
2. Review of solar activity
3. PROBA2 Observations (13 Sep 2021 - 19 Sep 2021)
4. The International Sunspot Number by Silso
5. Review of geomagnetic activity
6. Geomagnetic Observations at Dourbes (13 Sep 2021 - 19 Sep 2021)
7. Review of ionospheric activity (13 Sep 2021 - 19 Sep 2021)
8. Science festival
North and South
During the past summer holidays, a research article (https://doi.org/10.1051/0004-6361/202141195 ) has been published that resulted from a close collaboration between SILSO (https://wwwbis.sidc.be/silso/ ), the University of Graz (Austria) and the Skolkovo Institute of Science and Technology (Moscow, Russia). The paper establishes the official sunspot numbers for both solar hemispheres extending it all the way back to 1874. Previously, these existed only for the last 3 solar cycles, starting in 1992 (see the data at the SILSO website https://wwwbis.sidc.be/silso/datafiles). The newly extended hemispheric sunspot numbers series are based on the sunspot areas listed in the Greenwich photographic catalogue, and are calibrated on the existing SILSO reference hemispheric database.
The graph underneath shows the hemispheric sunspot numbers from 1874-present based on the data from the article, and available at a dedicated SILSO webpage (https://wwwbis.sidc.be/silso/extheminum ). Colors indicate which solar hemisphere is dominating: "green" for the northern hemisphere, and "red" for the southern one. For example, the green color between 1958 and 1970 clearly showed a strong domination of the northern solar hemisphere over the southern one. Currently (2021), the southern hemisphere is slightly dominating.
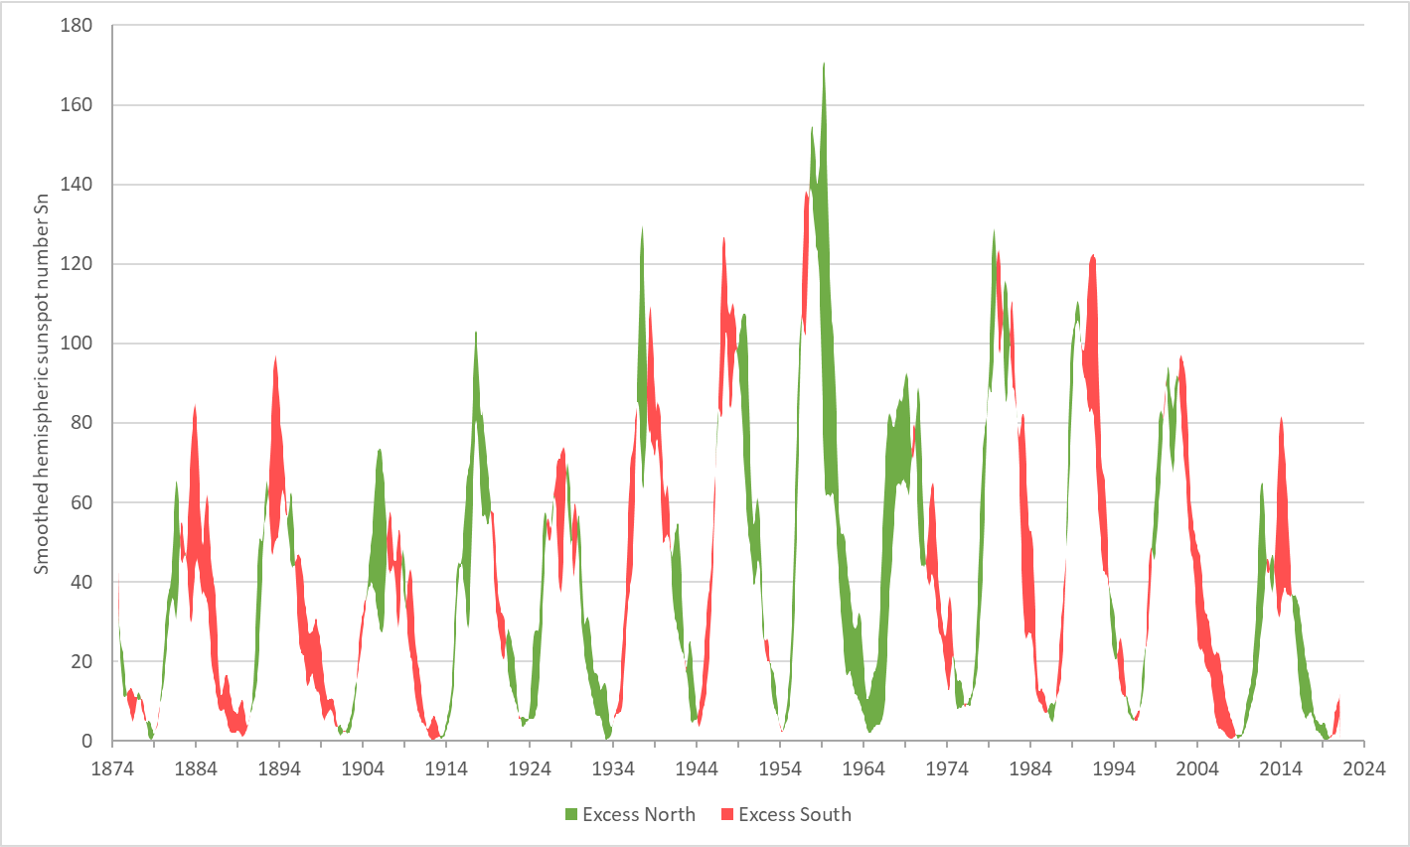
Other conclusions from the paper were that the strongest asymmetry occured for solar cycle 19 (SC19 - 1954-1964), in which the northern hemisphere showed a cumulated predominance of 42 percent. The phase shift between the peaks of solar activity in the two hemispheres may be up to 28 months, with a mean absolute value over cycles 12–24 of 16.8 months. The phase shifts reveal an overall asymmetry of the northern hemisphere reaching its cycle maximum earlier (in 10 out of 13 cases), with a mean signed phase shift of -7.6 months (i.e. earlier). It is believed that this new catalogue will be essential to accurately predict space weather since now the scientific community has continuous hemispheric data for a longer period to make meaningful solar cycle predictions. Indeed, we currently still do not fully understand how the solar dynamo, which is thought to be the source of the solar magnetic cycle, works and how the solar magnetic field is generated.
As study co-author and the head of the World Data Center SILSO Frédéric Clette commented: "For permanent technical infrastructures, for long-term issues like ozone depletion or climate, and in view of future long-duration manned space missions to the Moon or Mars, there is a growing need for mid- and long-term forecasts of the trend of solar activity over the next few months or years. As part of an emerging discipline called 'space climate', such long-term predictions of the strength of the solar cycle can only rest on a detailed knowledge of the actual evolution of many past solar cycles. Our newly extended data series is one of the key steps in the growing efforts to revisit and fully exploit legacy data collections using the modern tools of the 21st century."
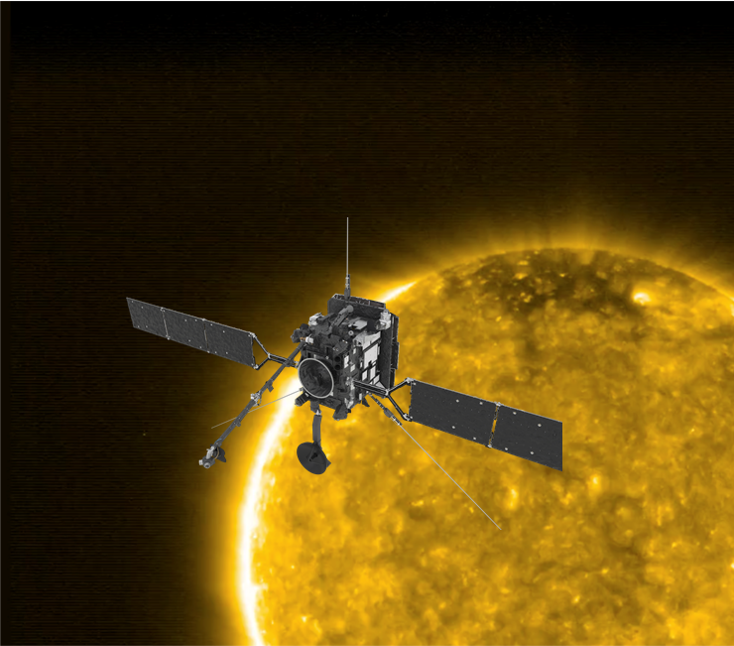
Moreover, the space weather community will soon get help from the Solar Orbiter, a groundbreaking space mission launched in February last year to fly very close to the Sun. It will perform gravitational maneuvers to reach out of the ecliptic and glimpse at the poles for the first time in history. The first polar pass is expected to take place in March 2025 with the spacecraft reaching an inclination of 17 degrees above the ecliptic plane and increasing to 33 degrees in July 2029. Solar Orbiter will have a much better view of the solar poles than is possible from Earth, and so it will provide solar physicists with much needed insight on what's happening with the polar magnetic fields, believed by many scholars to be a key-ingredient for the solar dynamo performance. It is believed that the newly developed product of hemispheric sunspot numbers together with the unprecedented observations and fundamentally new knowledge from the Solar Orbiter will help the scientific community to advance solar cycle studies and space weather predictions.
More information is available in a special newsitem at the SILSO website at https://wwwbis.sidc.be/silso/node/172 . The source paper reference is: Astrid M. Veronig, Shantanu Jain, Tatiana Podladchikova, Werner Poetzi, Frederic Clette, 2021. Hemispheric Sunspot Numbers 1874-2020, Astronomy and Astrophysics, 652, A56, DOI: https://doi.org/10.1051/0004-6361/202141195
Review of solar activity
Solar activity was at low and very low levels for the past week. Four C-class flares were detected and four Active Regions (AR) could be seen from Earth's view over the last week. NOAA AR 2866 (Catania group 40) was the most magnetically complex region of the past week, however, it produced only one of the four flares because it rotated out of Earth's view on 15 Sep. NOAA AR 2868 (Catania group 39) did not produce an C-class flares during the last seven days and it also rotated out of Earth's view on 15 Sep. NOAA AR 2870 disintegrated into a plage early on the weak (13 Sep) and did not produce any noticeable activity. NOAA AR 2871 produced the remaining three C-class flares on 17, 18, and 19 Sep. It should be noted that NOAA AR 2871 was only numbered on 19 Sep, hence it produced the C-class flares of 17 and 18 Sep while its foot points were not yet visible from Earth.
Several Corona Mass Ejection (CME) were detected by CACTUS in LASCO-C2/SOHO images. The majority was back-sided, with only one, on 13 Sep, proven to be geo-effective. This CME was caused by the eruption of a very long filament that produced a partial, but slow CME. A partial halo CME detected on 18 Sep was estimated to be back-sided, however, this could not be confirmed by COR2/STEREO-A.
The greater than 10 MeV proton flux was at nominal levels during the past week.
The greater than 2MeV electron flux was below the 1000 pfu threshold for the past week.
The 24h fluence for the greater than 2MeV electron flux was at nominal levels during the last week.
PROBA2 Observations (13 Sep 2021 - 19 Sep 2021)
Solar Activity
Solar flare activity fluctuated from very low to low during the week.
In order to view the activity of this week in more detail, we suggest to go to the following website from which all the daily (normal and difference) movies can be accessed: https://proba2.oma.be/ssa
This page also lists the recorded flaring events.
A weekly overview movie can be found here (SWAP week 599): https://proba2.sidc.be/swap/data/mpg/movies/weekly_movies/weekly_movie_2021_09_13.mp4
Details about some of this week's events can be found further below.
If any of the linked movies are unavailable they can be found in the P2SC movie repository here: https://proba2.oma.be/swap/data/mpg/movies/
Friday Sep 17
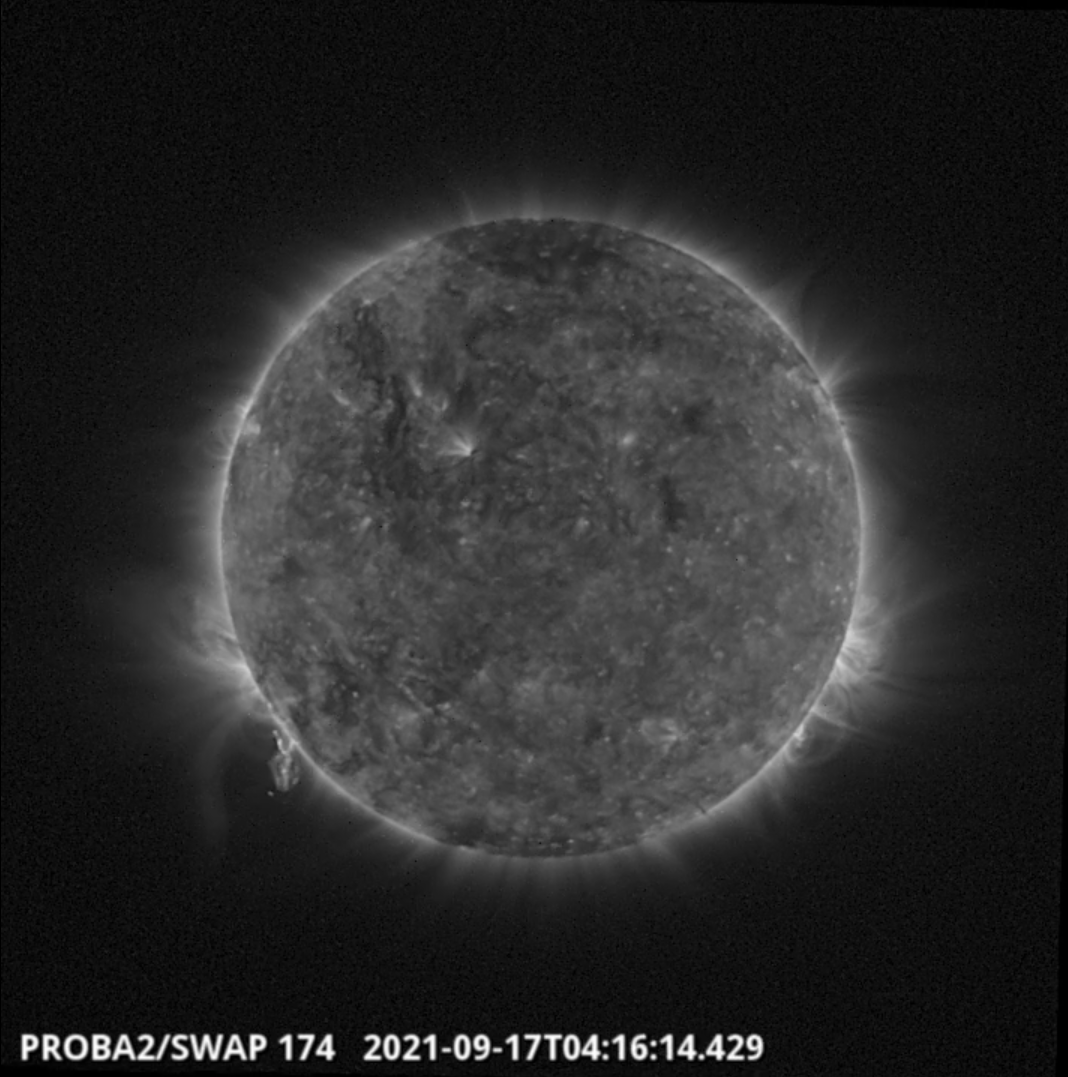
The largest flare of the week, a C3.5 flare, was observed by SWAP and LYRA on 2021-Sep-17. The flare and associated eruption is visible on the south-east limb of the solar disk, as shown in the SWAP image above taken at 04:16 UT.
Find a movie of the event here (SWAP movie): https://proba2.sidc.be/swap/movies/20210917_swap_movie.mp4
The International Sunspot Number by Silso
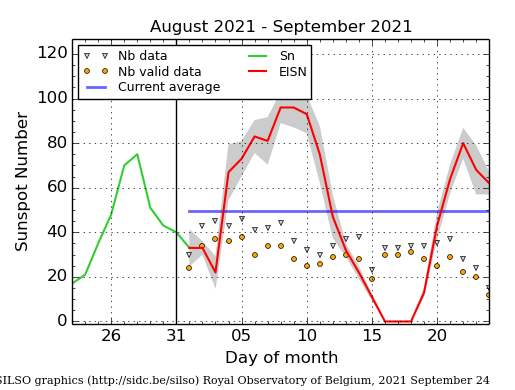
The daily Estimated International Sunspot Number (EISN, red curve with shaded error) derived by a simplified method from real-time data from the worldwide SILSO network. It extends the official Sunspot Number from the full processing of the preceding month (green line), a few days more than one solar rotation. The horizontal blue line shows the current monthly average. The yellow dots gives the number of stations that provided valid data. Valid data are used to calculate the EISN. The triangle gives the number of stations providing data. When a triangle and a yellow dot coincide, it means that all the data is used to calculate the EISN of that day.
Review of geomagnetic activity
The solar wind parameters (based on DSCOVR and ACE data) were at a typical slow solar wind regime for most of last week. The exception was the arrival of the CME that erupted on 13 Sep. It became geo-effective on 17 Sep and its effects lasted until 18 Sep. This ICME had a strong negative vertical magnetic field component (Bz) with a lowest value of -13.5 nT.
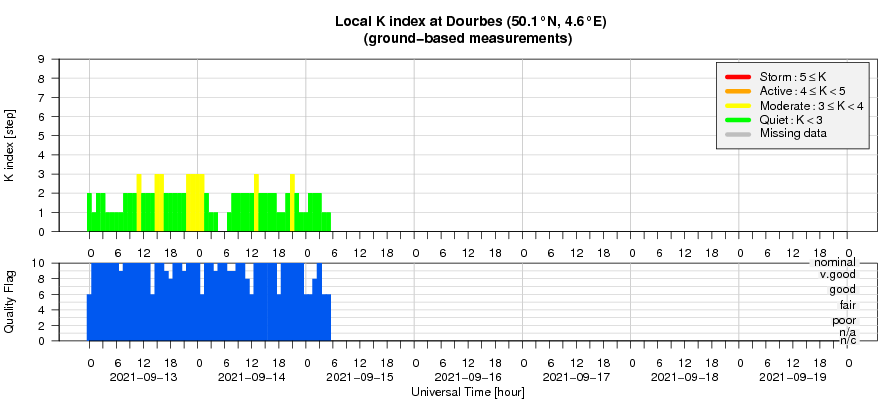
The geomagnetic conditions were mostly quiet with the exception of the 17 Sep and the early hours of 18 Sep, when they became moderate to stormy. The storm conditions of NOAA Kp=5 were reached on 17 Sep 18:00-24:00 UT. K Dourbes followed a very similar pattern to NOAA Kp.
Geomagnetic Observations at Dourbes (13 Sep 2021 - 19 Sep 2021)
Review of ionospheric activity (13 Sep 2021 - 19 Sep 2021)
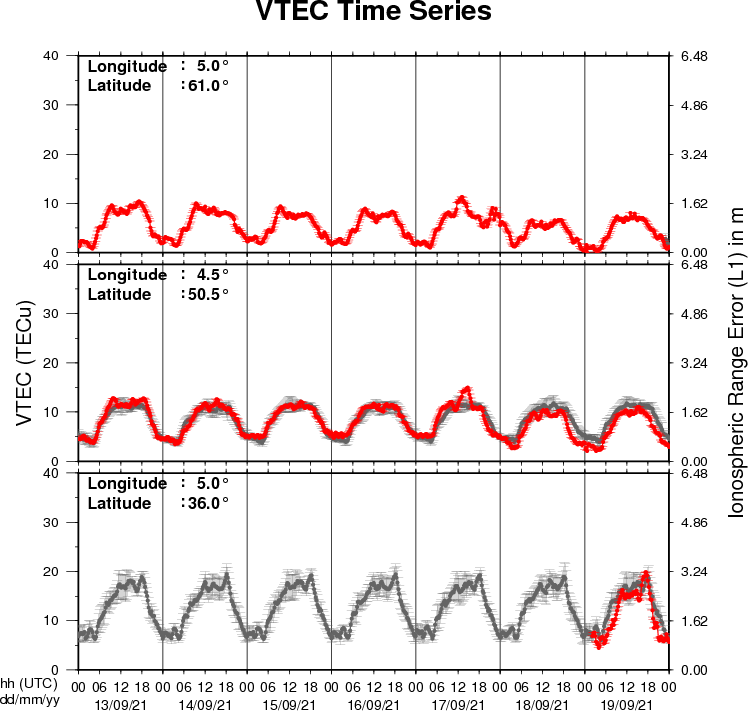
The figure shows the time evolution of the Vertical Total Electron Content (VTEC) (in red) during the last week at three locations:
a) in the northern part of Europe(N61°, 5°E)
b) above Brussels(N50.5°, 4.5°E)
c) in the southern part of Europe(N36°, 5°E)
This figure also shows (in grey) the normal ionospheric behaviour expected based on the median VTEC from the 15 previous days.
The VTEC is expressed in TECu (with TECu=10^16 electrons per square meter) and is directly related to the signal propagation delay due to the ionosphere (in figure: delay on GPS L1 frequency).
The Sun's radiation ionizes the Earth's upper atmosphere, the ionosphere, located from about 60km to 1000km above the Earth's surface.The ionization process in the ionosphere produces ions and free electrons. These electrons perturb the propagation of the GNSS (Global Navigation Satellite System) signals by inducing a so-called ionospheric delay.
See http://stce.be/newsletter/GNSS_final.pdf for some more explanations ; for detailed information, see http://gnss.be/ionosphere_tutorial.php
Science festival
The Science festival is in its full swing with 'Panic in the space weather room' and 'Northern lights':
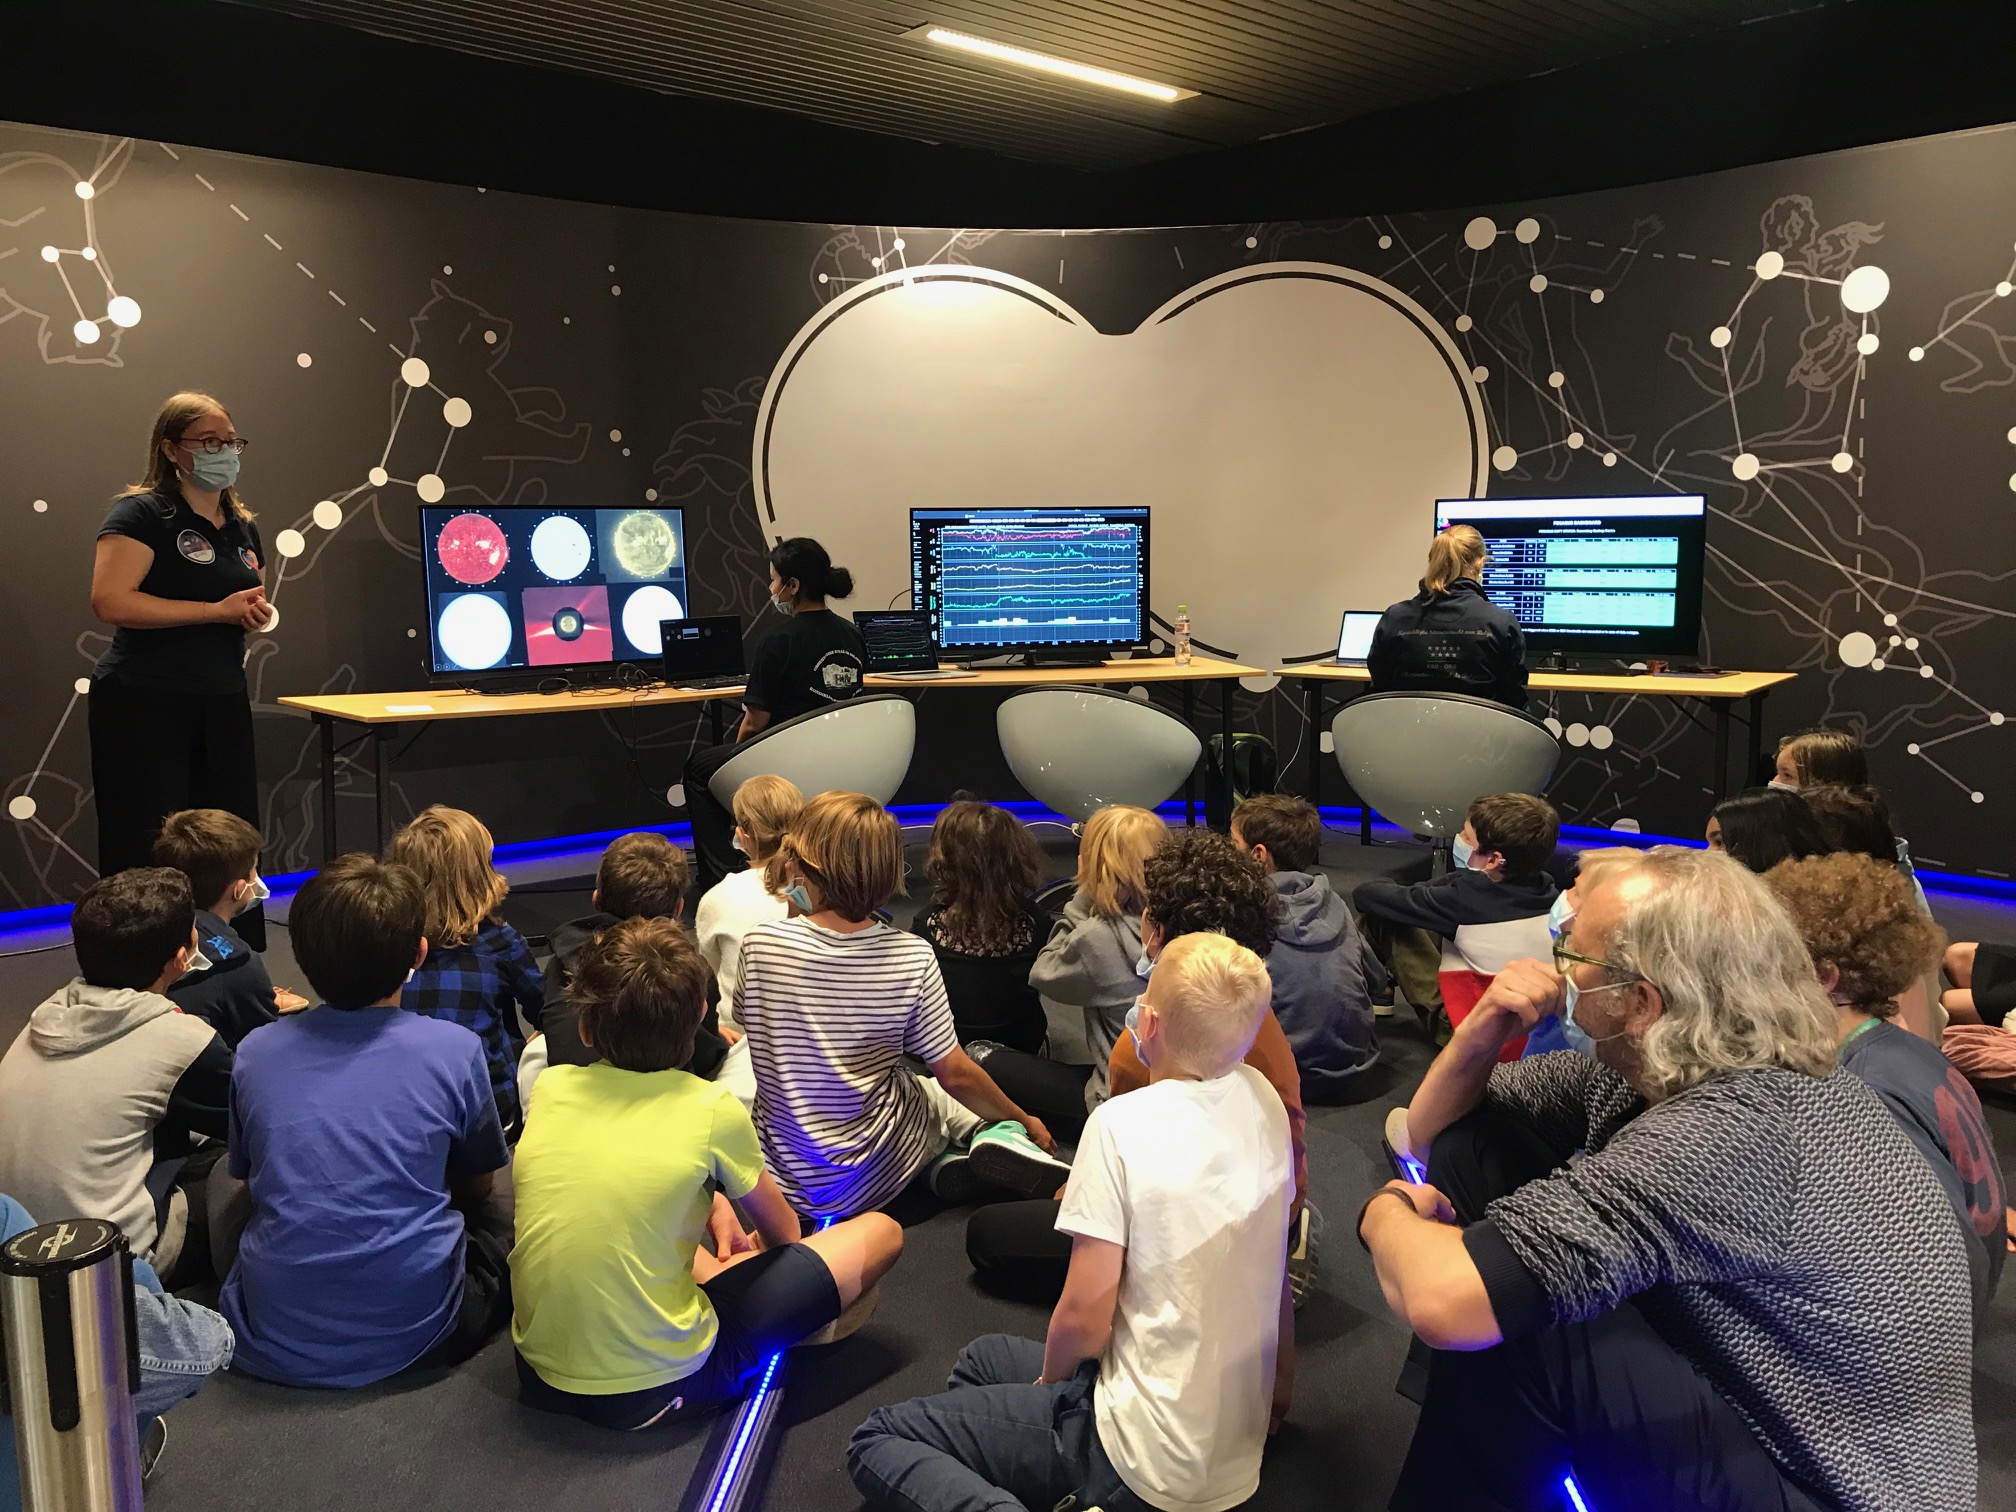
Check out at: https://wisenight.eu