- Table of Content
- 1.Antarctic Ecli...
- 2.Review of sola...
- 3.Noticeable Sol...
- 4.The Internatio...
- 5.PROBA2 Observa...
- 6.Review of geom...
- 7.Geomagnetic Ob...
- 8.The SIDC Space...
- 9.Review of iono...
- 10.Action!
2. Review of solar activity
3. Noticeable Solar Events (29 Nov 2021 - 5 Dec 2021)
4. The International Sunspot Number by Silso
5. PROBA2 Observations
6. Review of geomagnetic activity
7. Geomagnetic Observations in Belgium
8. The SIDC Space Weather Briefing
9. Review of ionospheric activity
10. Action!
Antarctic Eclipse Observations
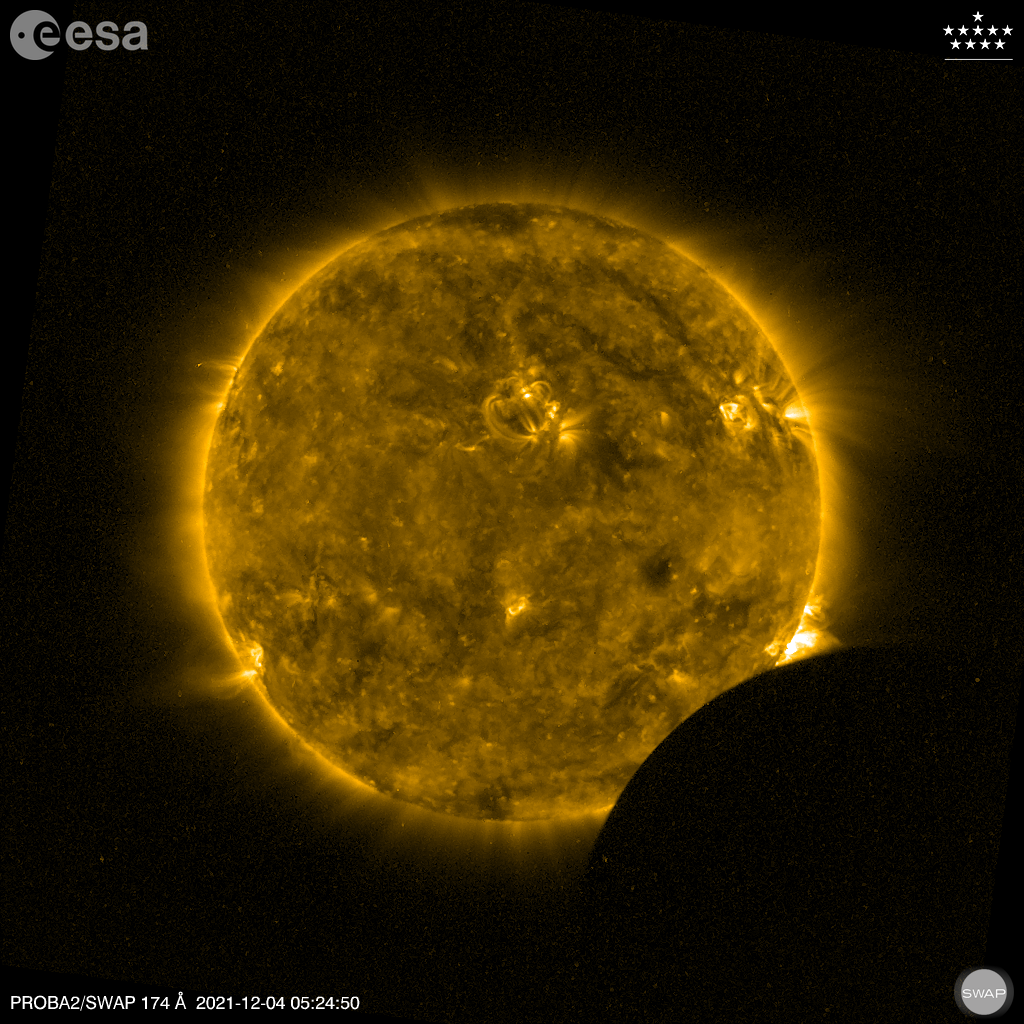
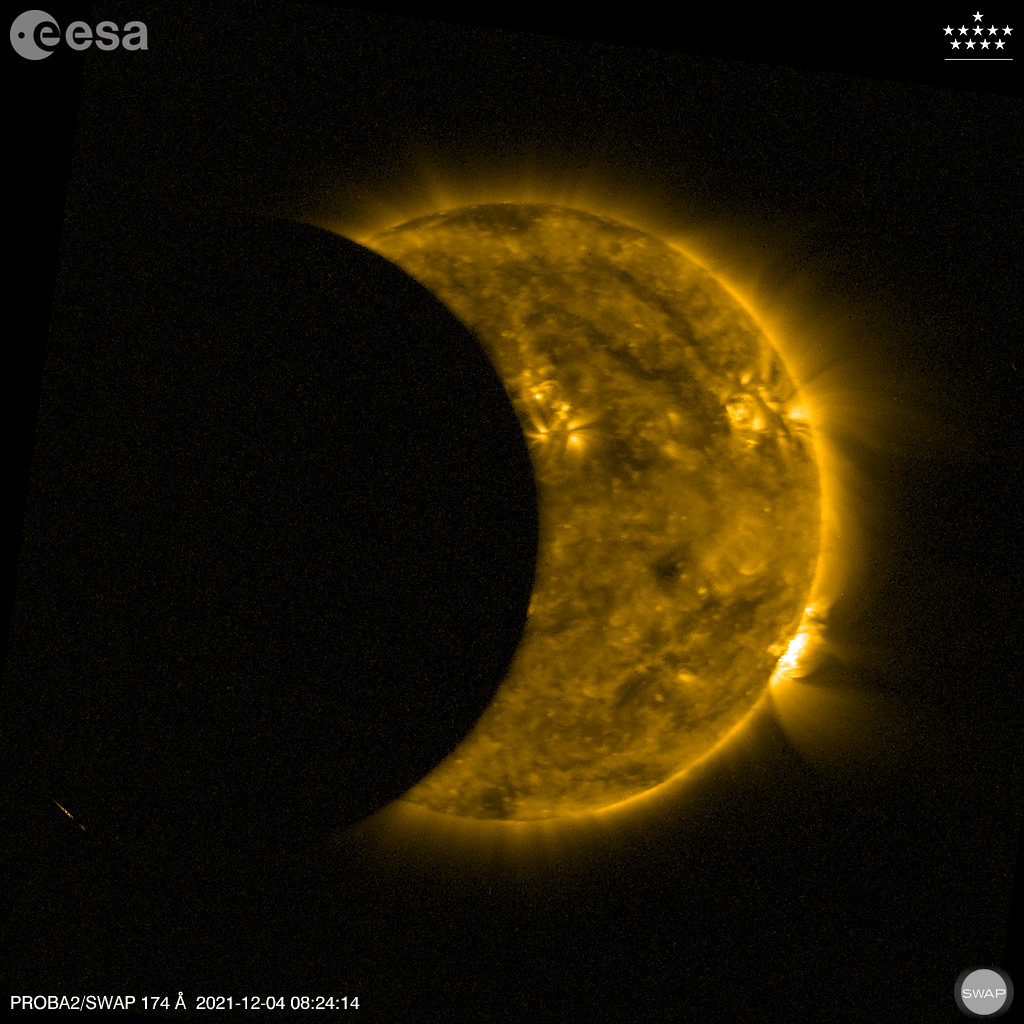
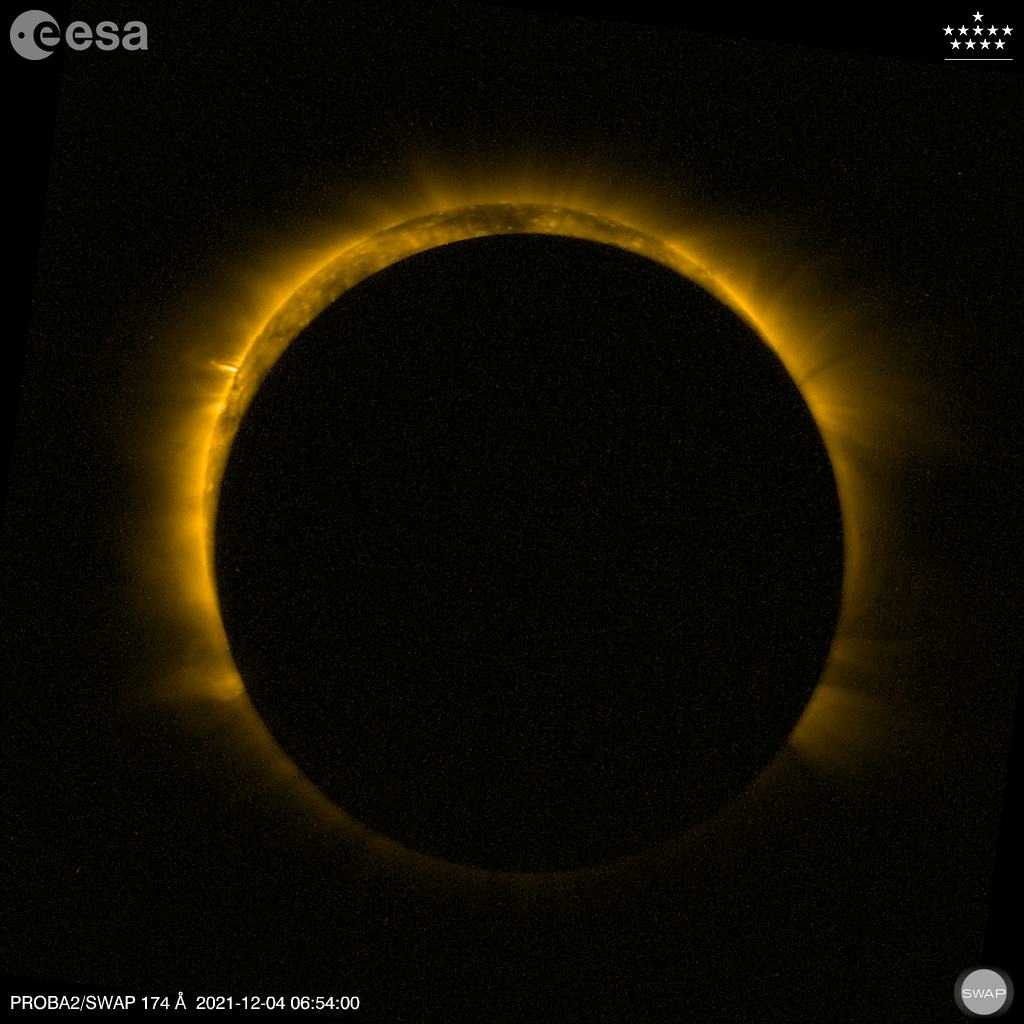
While the penguins were gazing at the total eclipse on December 4 (https://proba2.sidc.be/2021Dec4Eclipse), the instruments onboard the PROBA2 satellite worked overtime to image and measure not one, but four passages of the moon in front of the sun. One of these occultations was nearly total for the SWAP EUV imager: as much as 96% of the solar disk was covered by the moon during the second passage (middle image below). The fourth time that the moon was in SWAP's field of view, it did not touch the solar disk, which made it difficult to observe the moon in the images. The pictures below show the three first transits of the moon observed by SWAP.
LYRA observations

Also the LYRA radiometer onboard was ready to measure the extinction of the solar light as it was blocked by the moon. As for all eclipses, LYRA activated one of its backup units, which measured together with the regular unit. The instrument monitored the progressive extinction of the solar light in its channels that observe in the ultraviolet (red and green curves) and extreme ultraviolet (black and blue curves). As can be seen in the figure below showing the second and third passage, the extreme ultraviolet curves have an asymmetric profile. This is caused by the fact that the sun, in those wavelengths, doesn't emit uniformly over its surface. Active regions appear much brighter than the rest of the solar disk. The distortion of the extreme ultraviolet curves is caused by the sudden occultation of an active region located at the right limb of the sun (see image above on the right). Interestingly, that active region produced several flares of moderate amplitude (C-class) on the day of the eclipse (see the list of flares on https://proba2.sidc.be/ssa?date=2021-12-04).
Eclipses in 2022

This was the 28th eclipse observed by the PROBA2 instruments. In 2022, two eclipses will take place: on April 30 and on October 25. This last one is a special one. Not only because it is the 30th eclipse that PROBA2 will observe; a partial eclipse will be visible from Belgium around midday! Let's hope the weather will cooperate so that we can also observe this spectacle from ground.
Review of solar activity
Solar activity was at very low level for the first half of the week increasing to low level on Dec 03 and moderate levels on Dec 05. Six Active Regions (AR) were present on the side of the Sun facing Earth. Their magnetic configuration was simple and produced only B-flares. Towards the end of the week, NOAA AR 2898 became more active and produced an M1.4 flare on Dec 05. At the time of the M flare, the AR had already rotated over the western limb. By the end of the week, three small ARs appeared on the solar disk.
Multiple filament eruptions were observed but no Earth-directed Coronal Mass Ejections (CMEs) were detected in the available coronagraph imagery.
The greater than 10 MeV proton flux was at nominal levels. The greater than 2 MeV electron flux exceeded the 1000 pfu alert threshold on multiple occasions between Dec 02 and Dec 05 and the 24h electron fluence reached moderate levels.
Noticeable Solar Events (29 Nov 2021 - 5 Dec 2021)
| DAY | BEGIN | MAX | END | LOC | XRAY | OP | 10CM | TYPE | Cat | NOAA |
| 05 | 0658 | 0719 | 0736 | M1.4 | III/1 | 2898 |
| LOC: approximate heliographic location | TYPE: radio burst type |
| XRAY: X-ray flare class | Cat: Catania sunspot group number |
| OP: optical flare class | NOAA: NOAA active region number |
| 10CM: peak 10 cm radio flux |
The International Sunspot Number by Silso
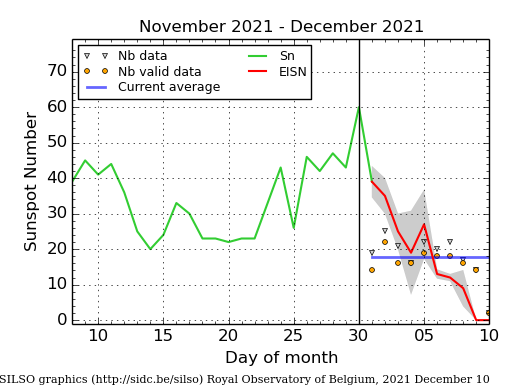
The daily Estimated International Sunspot Number (EISN, red curve with shaded error) derived by a simplified method from real-time data from the worldwide SILSO network. It extends the official Sunspot Number from the full processing of the preceding month (green line), a few days more than one solar rotation. The horizontal blue line shows the current monthly average. The yellow dots gives the number of stations that provided valid data. Valid data are used to calculate the EISN. The triangle gives the number of stations providing data. When a triangle and a yellow dot coincide, it means that all the data is used to calculate the EISN of that day.
PROBA2 Observations
Solar Activity
Solar flare activity increased from very low to moderate during the week.
In order to view the activity of this week in more detail, we suggest to go to the following website from which all the daily (normal and difference) movies can be accessed: https://proba2.oma.be/ssa
This page also lists the recorded flaring events.
A weekly overview movie can be found here (SWAP week 610): https://proba2.sidc.be/swap/data/mpg/movies/weekly_movies/weekly_movie_2021_11_29.mp4
Details about some of this week's events can be found further below.
If any of the linked movies are unavailable they can be found in the P2SC movie repository here: https://proba2.oma.be/swap/data/mpg/movies/
Saturday Dec 04
On 2021-Dec-04 a total eclipse as seen from Earth was observed by SWAP and LYRA as three partial solar eclipses. The SWAP image above was taken during the second partial occultation.
Find a movie of the event here: https://proba2.sidc.be/Events/2021-Dec-4-SolarEclipse/movies/swap_eclipse_2021_12_04_logos_lossless.mp4 and further images available here https://proba2.sidc.be/Events/2021-Dec-4-SolarEclipse/
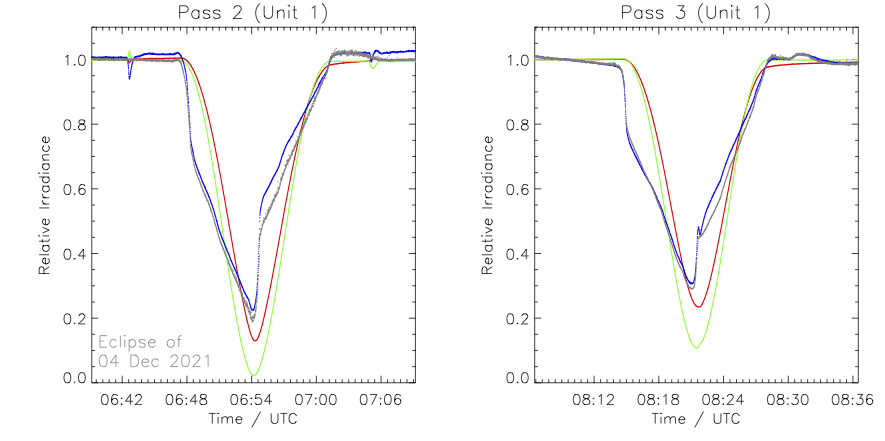
The occultations were also observed by LYRA's "calibration unit" (unit 1) in addition to the nominal one (unit 2). The plots above show normalized observations by LYRA during two passes in the eclipse zone. The colors correspond to the observations by the four channels of LYRA: red = Lyman-alpha, green = Herzberg, blue = Aluminum, black = Zirconium.
Sunday Dec 05
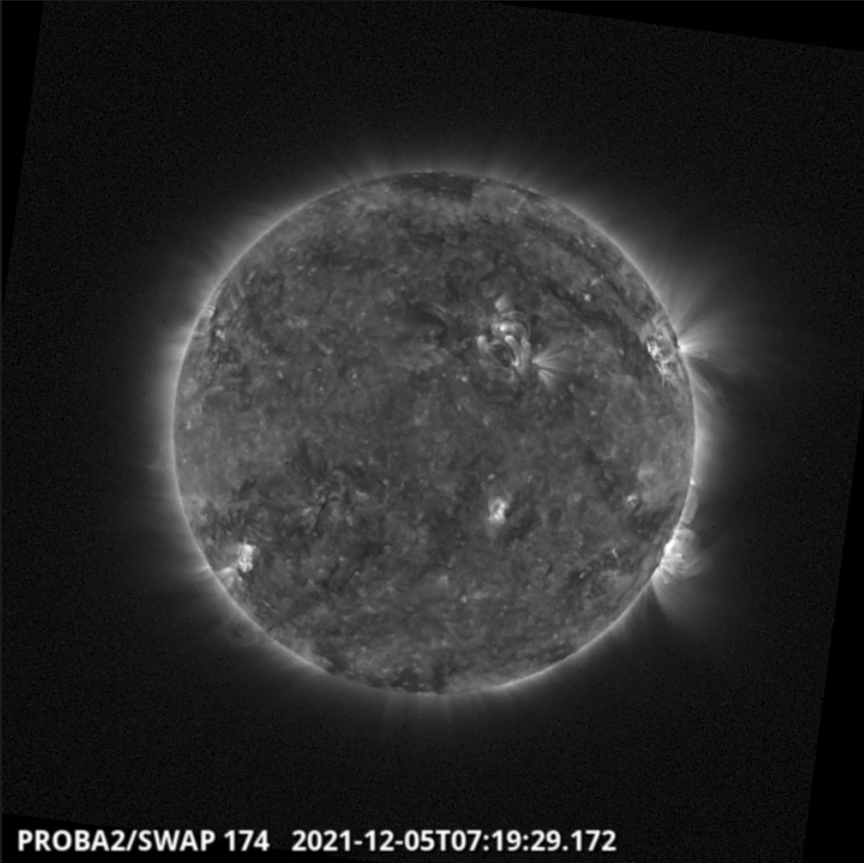
The largest flare of the week, an M1.4 flare, was observed by SWAP and LYRA. The flare is visible on the south-west limb of the solar disk on 2021-Dec-05, as shown in the SWAP image above taken at 07:19 UT.
Find a movie of the event here (SWAP movie): https://proba2.sidc.be/swap/movies/20211205_swap_movie.mp4
Review of geomagnetic activity
The solar wind data (DSCOVR) showed late on Nov 30, the arrival of a high speed stream (HSS) associated with the positive polarity Coronal Hole (CH), which began to cross the central meridian on Nov 28. The total magnetic field reached a maximum value of 17 nT, with a minimum Bz of -16 nT on Nov 30. The solar wind speed gradually increased and reached a maximum value of 576 km/s on Dec 01, before beginning to decrease gradually. Further enhancements were then seen in the solar wind speed on Dec 04 and Dec 05, most likely in response to the HSS associated with two further positive polarity CHs that crossed the central meridian on Dec 01 and Dec 02.
Geomagnetic conditions were unsettled to active for most of the week, with one period of minor storm conditions (NOAA Kp=5) in response to the enhanced IMF and strong negative Bz associated with the arrival of the HSS on Nov 30.
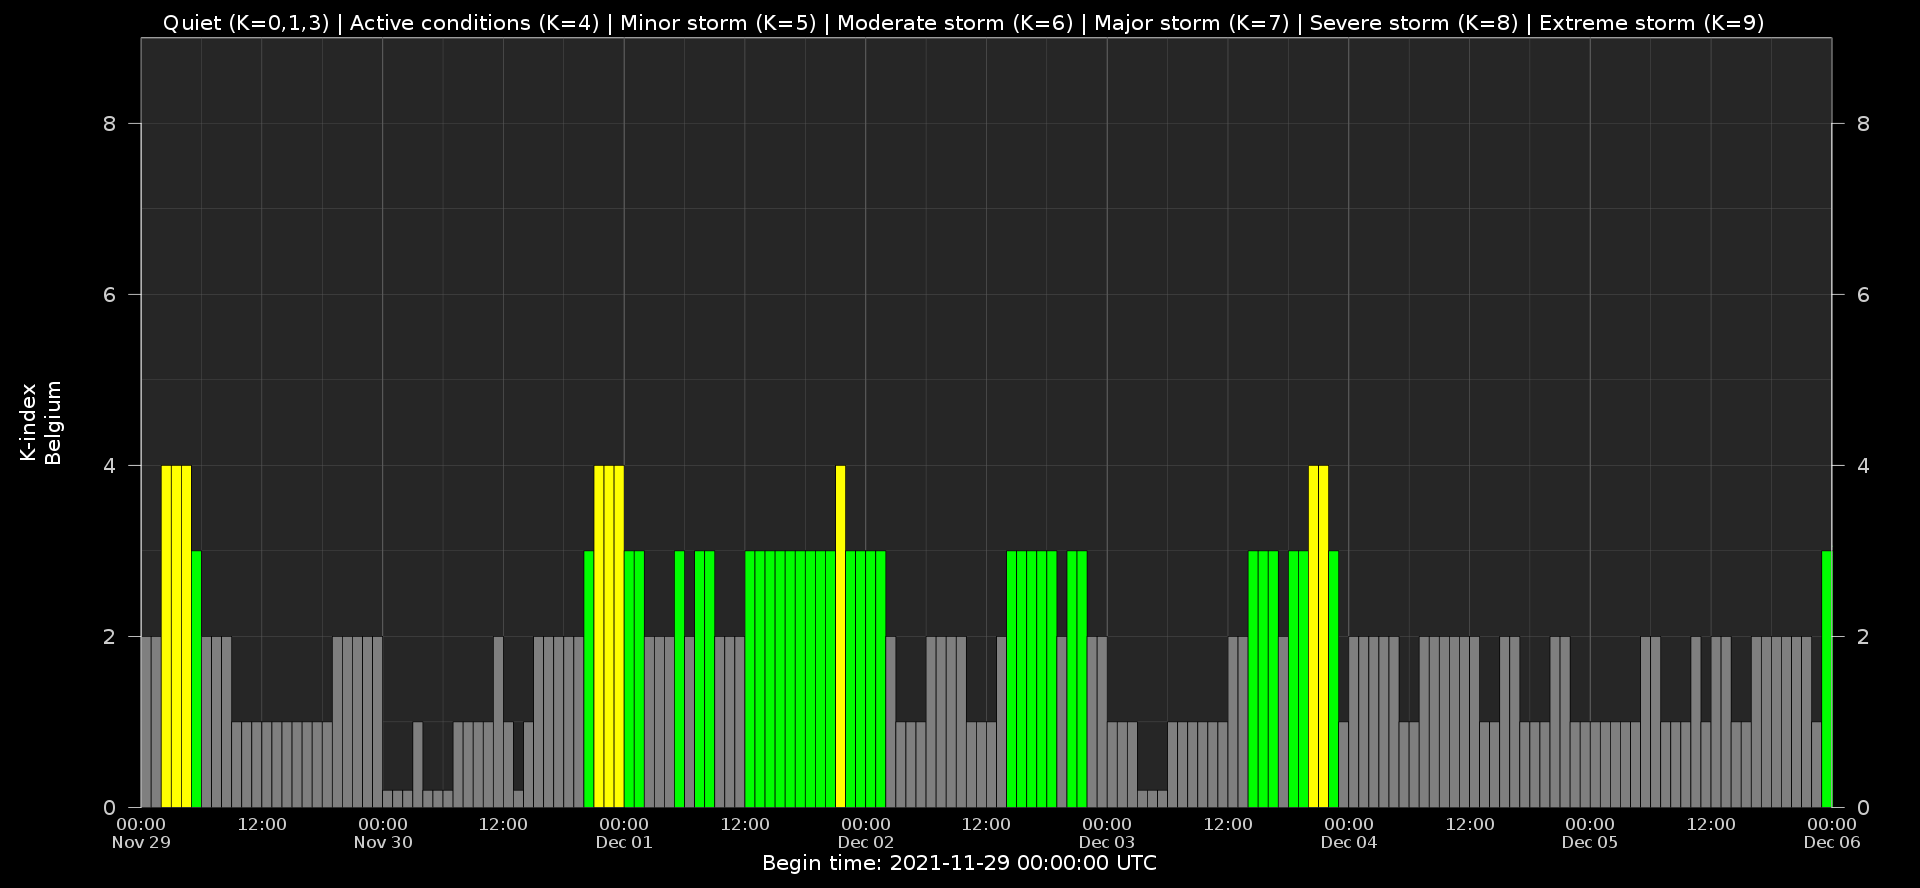
Geomagnetic Observations in Belgium
Local K-type magnetic activity index for Belgium based on data from Dourbes (DOU) and Manhay (MAB). Comparing the data from both measurement stations allows to reliably remove outliers from the magnetic data. At the same time the operational service availability is improved: whenever data from one observatory is not available, the single-station index obtained from the other can be used as a fallback system.
Both the two-station index and the single station indices are available here: http://ionosphere.meteo.be/geomagnetism/K_BEL/
The SIDC Space Weather Briefing
The Space Weather Briefing presented by the forecaster on duty from Nov 29 to Dec 5. It reflects in images and graphs what is written in the Solar and Geomagnetic Activity report.

A pdf-version: https://www.stce.be/briefings/20211206_SWbriefing.pdf
The movie: https://www.stce.be/briefings/20211206_SWbriefing.m4v
Review of ionospheric activity
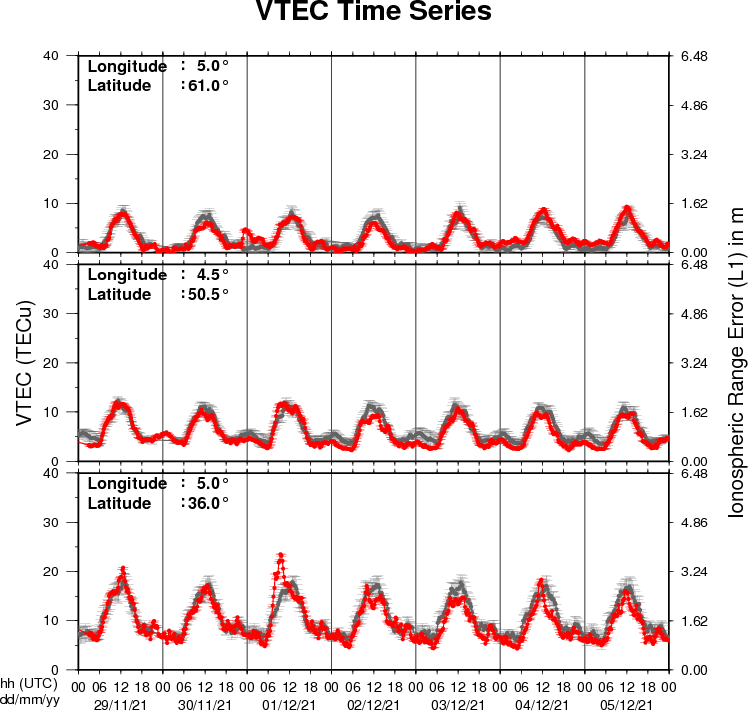
The figure shows the time evolution of the Vertical Total Electron Content (VTEC) (in red) during the last week at three locations:
a) in the northern part of Europe(N61�, 5�E)
b) above Brussels(N50.5�, 4.5�E)
c) in the southern part of Europe(N36�, 5�E)
This figure also shows (in grey) the normal ionospheric behaviour expected based on the median VTEC from the 15 previous days.
The VTEC is expressed in TECu (with TECu=10^16 electrons per square meter) and is directly related to the signal propagation delay due to the ionosphere (in figure: delay on GPS L1 frequency).
The Sun's radiation ionizes the Earth's upper atmosphere, the ionosphere, located from about 60km to 1000km above the Earth's surface.The ionization process in the ionosphere produces ions and free electrons. These electrons perturb the propagation of the GNSS (Global Navigation Satellite System) signals by inducing a so-called ionospheric delay.
See http://stce.be/newsletter/GNSS_final.pdf for some more explanations ; for detailed information, see http://gnss.be/ionosphere_tutorial.php
Action!
Check out our activity calendar: activities and encounters with the Sun-Space-Earth system and Space Weather as the main theme. We provide occasions to get submerged in our world through educational, informative and instructive activities.
If you want your event in our calendar, contact us: stce_coordination at stce.be
in 2021
* December 16, ISSI Game Changers Online Seminars: Subsurface Life on Earth and on Other Planets in the Solar System
* December 16, KUL/CmPA seminar: BxC: a swift generator for magnetohydrodynamic turbulence
In 2022
* January 25, Public Lecture on the Solar Corona in EUV (Dutch), Urania, Hove, Belgium
* February 14-18, online Space Weather Introductory Course by SWEC, Space Weather Education Center - registrations are open
* February 22, Public Lecture on Space Weather and Aviation (Dutch), Urania, Hove, Belgium
* February 26, Public Lecture on Space Weather, Satellites and Aviation (Dutch), UGent Volkssterrenwacht Armand Pien, Gent, Belgium
* March 14-16, onsite (!) Space Weather Introductory Course by SWEC, Space Weather Education Center - registrations are open
* April 28, Public Lecture on SDO/EUI, Astropolis, Oostende, Belgium
* August 25, Public Lecture on Space Weather and Aviation, Astropolis, Oostende, Belgium
* October 24-28, 18th European Space Weather Week, Zagreb, Croatia
Check: https://www.stce.be/calendar