- Table of Content
- 1.Science result...
- 2.Celebrating SW...
- 3.Review of sola...
- 4.Review of geom...
- 5.The Internatio...
- 6.PROBA2 Observa...
- 7.Geomagnetic Ob...
- 8.The SIDC Space...
- 9.Review of iono...
- 10.Action!
2. Celebrating SWAP's first glimpse of the Sun
3. Review of solar activity (6 Dec 2021 - 12 Dec 2021)
4. Review of geomagnetic activity
5. The International Sunspot Number by Silso
6. PROBA2 Observations
7. Geomagnetic Observations in Belgium
8. The SIDC Space Weather Briefing
9. Review of ionospheric activity
10. Action!
Science results from SolO's cruise phase
The article underneath was based on ESA's Solar Orbiter news item released on 14 December which is available at https://www.esa.int/Science_Exploration/Space_Science/Solar_Orbiter/Solar_Orbiter_publishes_a_wealth_of_science_results_from_its_cruise_phase The papers from the Special Issue of Astronomy and Astrophysics can be consulted at https://www.aanda.org/
Solar Orbiter ("SolO") was launched on 10 February at 04:03UTC from Cape Canaveral, Florida. After a 3-month commissioning phase, during which the spacecraft and its instruments were tested for proper functioning, SolO entered its cruise phase on 15 June 2020. This cruise phase included three gravity assists (two past Venus and one past the Earth) that have guided Solar Orbiter now on a trajectory much closer to the Sun. During this period, the spacecraft sampled its local environment while its telescopes underwent several calibration campaigns to get ready for science operations near the Sun. This science phase started after the recent Earth flyby on 27 November (see this STCE newsitem at https://www.stce.be/EUI_EarthFlyby ).
So, one would not expect that SolO would generate a lot of science during its cruise phase, but that's exactly what happened. In fact, so many great scientific discoveries and observations were made that Astronomy and Astrophysics dedicated a Special Issue to it (https://www.aanda.org/ ). Underneath a few examples to illustrate the importance and variety of the findings made by SolO so far.
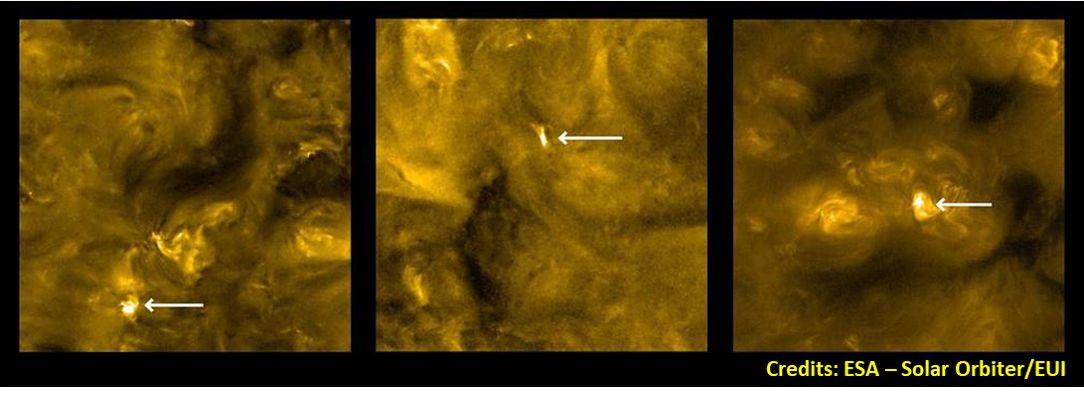
From a distance of 77 million km, The Extreme Ultraviolet Imager (EUI) revealed the existence of very tiny explosions on the Sun already from its first-light images mid-2020 (see this newsitem at https://www.stce.be/EUI_first_light ). These "campfires" are between 400 and 4000 kilometers in size and emit extremely short-waved ultraviolet light of high intensity for a short time. In EUV images, they appear as tiny, bright, short-lived spots. Though they are very small in size, it is believed that if sufficient in number, they could play a key role in explaining the million-degree-temperature of the Sun's outer atmosphere, the corona, which has defied explanation for many decades. As SolO will reach perihelions that will get it as close to the Sun as 42 million km in the coming years, this offers exciting prospects of the high-cadence, high-resolution imagery we can expect from this first-class EUV imager.
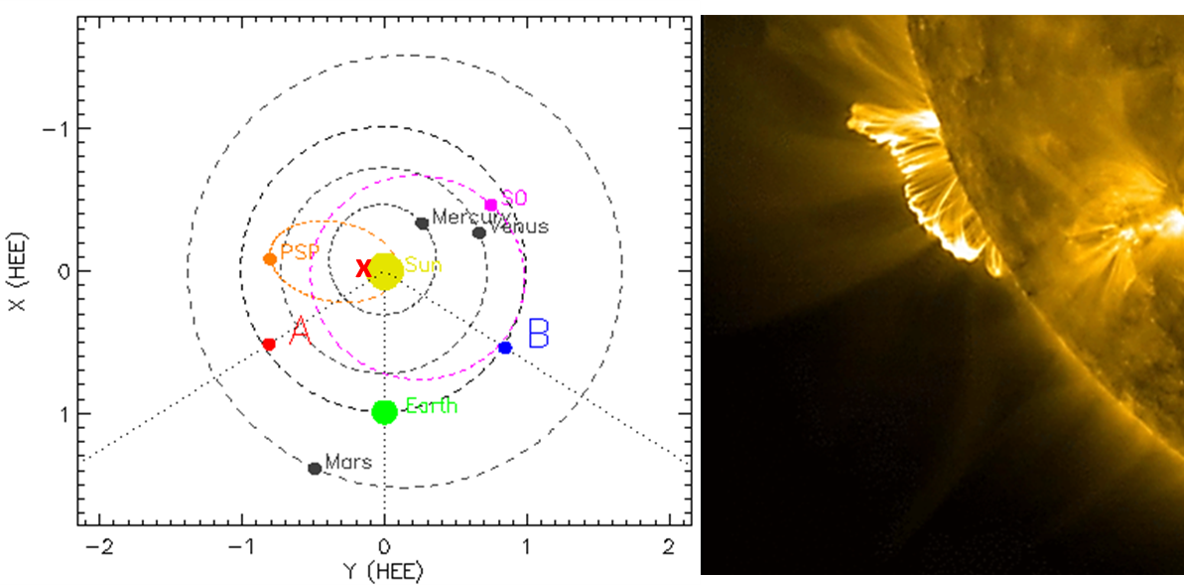
Late November 2020, Solar Orbiter observed its first widespread energetic particle event following a significant solar eruption on 29 November. The source region was still behind the Sun's east limb as seen from Earth (SDO/AIA image on the lower right), yet the eruption managed to reach a M4.4 peak in x-ray, produced a brief but weak proton flux enhancement, and was accompanied by a fast coronal mass ejection (CME; 1250 km/s - see this STCE Newsitem at
https://www.stce.be/news/506/welcome.html ). It's quite amazing that both Earth (GOES) and Solar Orbiter recorded an increase in the energetic particle flux, as they were magnetically very poorly connected to the blast region unlike STEREO-A and the Parker Solar Probe (see the annotated sketch with the position of the spacecraft and planets underneath; the red cross marks the location of the eruption). Their positions indicate that the event spread over at least 230 degrees in solar longitude (angle "Earth-STEREO-A-SolO"). This kind of events and measurements help in determining how much of the spread was due to the size of the eruption, and how much to other physical processes.
The observation of an interplanetary CME in the solar wind data by SolO on 19 April 2020 contributed to the research field of stealth CMEs. These are CMEs with no apparent source location on the Sun. As such, they pose a challenge to space weather forecasters as it's much harder to tell if a CME is earth-directed or not, when it will arrive and what its intensity may be. In this case, the measurements of the ICME by SolO indicated that its magnetic field strength (20 nT) was about double that of a normal CME, suggesting a sizeable solar event. However, the problem was that the visible surface of the Sun was devoid of sunspots at that time. Eventually, researchers were able to trace the CME back to the eruption of a coronal cavity on 13 April.
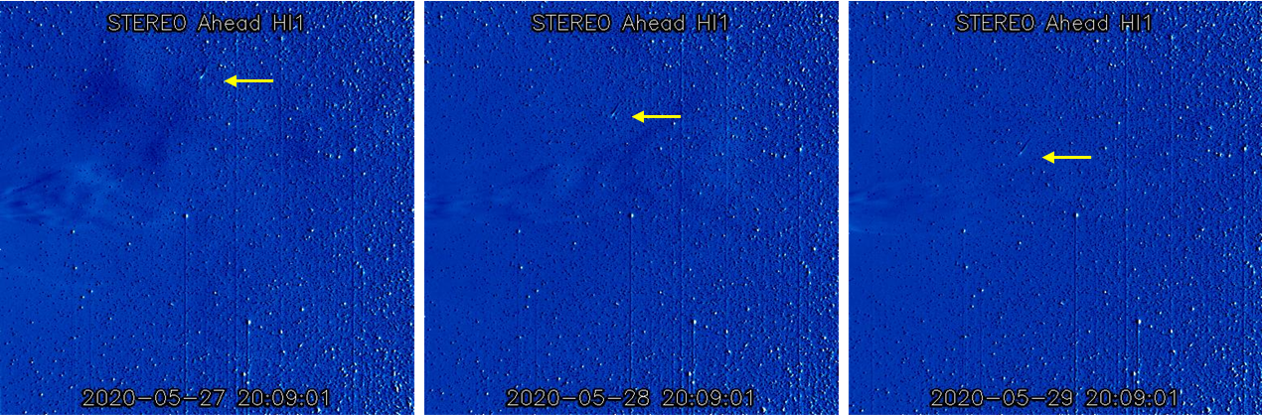
On 4 June 2020, Solar Orbiter has also flown thru the tail of a comet. It was actually predicted that the spacecraft would fly through the tail of comet ATLAS (C/2019/Y4), but only after SolO had alreay been launched. So, the scientists did their utmost to get at least some of the instruments ready in time to acquire data. Though the comet was disintegrating and as such leaving only a faint tail, data from SolO's passage indicated that the surrounding magnetic field suddenly changed its polarity, which would be expected if the Sun's magnetic field were draped around a piece of the broken comet's nucleus. The annotated STEREO-A images underneath were made by its Heliospheric Imager HI1 just a few days before SolO would fly thru the comet's tail. The Sun is off the left of the image, and a faint tail is visible as comet ATLAS moves from the upper right to the lower left.
Solar Orbiter is now in its main science phase, with all teams preparing for its close pass of the Sun in March 2022. Already, the results obtained during SolO's cruise phase show how much great science has been done, and provide a good justification to expect many more exciting results.
Celebrating SWAP's first glimpse of the Sun
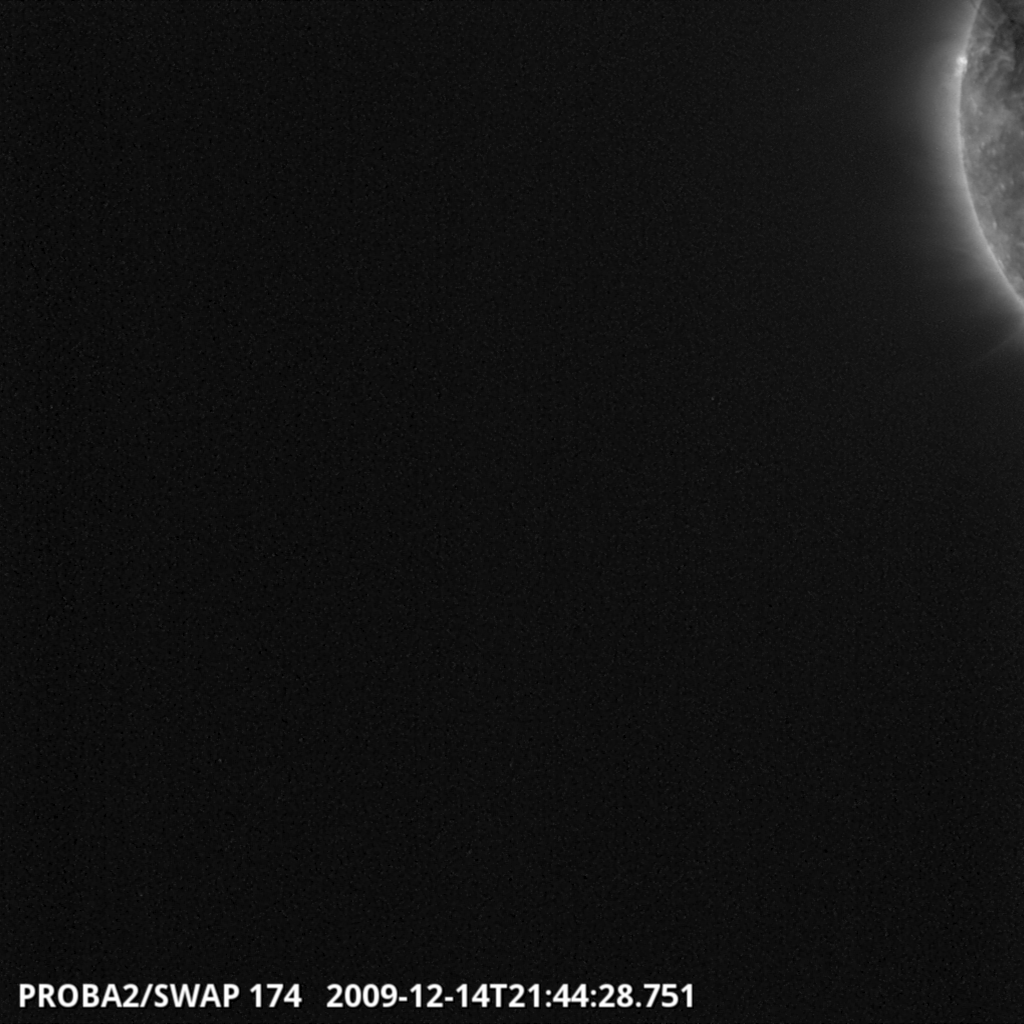
Twelve years ago this week, on 14 december 2009, the SWAP EUV telescope onboard the PROBA2 satellite laid its eye on the sun for the first time. After the nerve-racking procedure of opening the instrument door and taking this first image, PROBA2 operators and scientists waited impatiently for this first image to be downloaded from the satellite. Clearly, there was some work to be done on the pointing of the satellite to have the full solar disk in the SWAP field-of-view. Nevertheless, all PROBA2 team members were delighted with this result. It clearly showed that the instrument had endured the launch well, and that the detector and filters were in good shape. In fact, even after 12 years of nearly continuous observations, the SWAP instrument still produces excellent data with little degradation.�
After this door opening, the science and operations teams worked closely together to fix the pointing and to characterize the SWAP instrument. In January 2010, routine observations for SWAP started.�After tests in the dark in late 2009, the three doors of the LYRA radiometer, also onboard PROBA2,�were unlocked and opened as well on 5 and 6 January 2010. PROBA2 was set for its hugely successful journey to observe the Sun, which is lasting much longer than the originally planned 2-year period!
Review of solar activity (6 Dec 2021 - 12 Dec 2021)
The solar activity was low. Only few small C-flares were observed.
In the beginning of the week, multiple backside Coronal Mass Ejections (CMEs) were observed. These CME's were associated with backside flaring activity. Two on-disc filaments erupted on December 5 and 6. However the eruptive material was faint and as a consequence no disturbance in the solar wind was expected to arrive near Earth.
The greater than 10 MeV proton flux was at nominal levels in the past week. The greater than 2 MeV electron flux exceeded the 1000 pfu alert threshold and the greater than 2 MeV electron fluence was mostly at moderate levels.
Review of geomagnetic activity
The solar wind parameters (ACE+DSCOVR) were very slightly enhanced due to the influence of the high-speed streams from small equatorial coronal holes (negative polarity, north and south hemisphere). The wind speed increased to 533 km/s in the beginning of the week, then decreased up to 285 km/s, the total magnetic field reached 9.9 nT, and its southward component, Bz, fluctuated between -8.4 nT and +6.3 nT.
Geomagnetic conditions were mostly quiet with some unsettled periods in response to the influence of the wind streams associated to the small equatorial coronal holes.
The International Sunspot Number by Silso
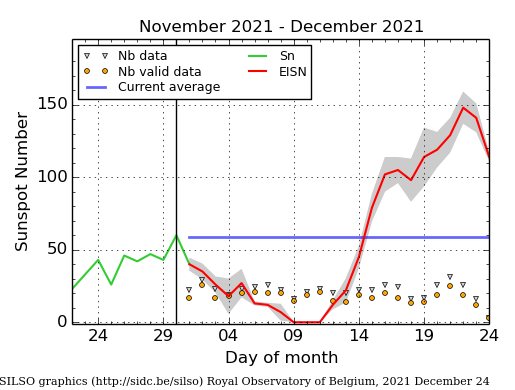
The daily Estimated International Sunspot Number (EISN, red curve with shaded error) derived by a simplified method from real-time data from the worldwide SILSO network. It extends the official Sunspot Number from the full processing of the preceding month (green line), a few days more than one solar rotation. The horizontal blue line shows the current monthly average. The yellow dots gives the number of stations that provided valid data. Valid data are used to calculate the EISN. The triangle gives the number of stations providing data. When a triangle and a yellow dot coincide, it means that all the data is used to calculate the EISN of that day.
PROBA2 Observations
Solar Activity
Solar flare activity fluctuated from very low to low during the week.
In order to view the activity of this week in more detail, we suggest to go to the following website from which all the daily (normal and difference) movies can be accessed: https://proba2.oma.be/ssa
This page also lists the recorded flaring events.
A weekly overview movie can be found here (SWAP week 611). https://proba2.oma.be/swap/data/mpg/movies/weekly_movies/weekly_movie_2021_12_06.mp4
Details about some of this week's events can be found further below.
If any of the linked movies are unavailable they can be found in the P2SC movie repository here https://proba2.oma.be/swap/data/mpg/movies/
Monday Dec 06
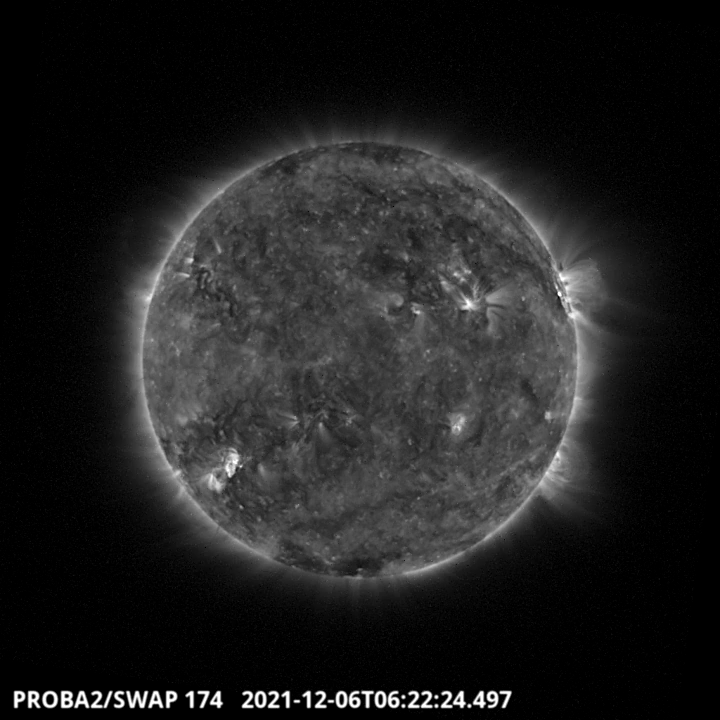
The largest flare of the week, a C1.3 flare, occurred in the north-west region of the Sun, in the active region NOAA 2902 around 6:22 UT - SWAP image. Find a movie of the events here (SWAP movie) https://proba2.oma.be/swap/data/mpg/movies/20211206_swap_movie.mp4
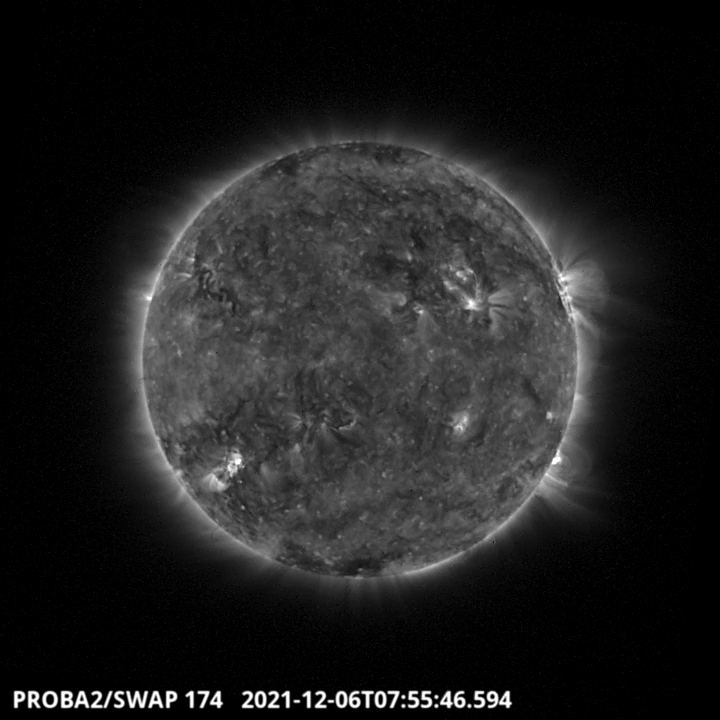
Flows were observed in the South in Eastern Hemisphere. They were associated to a B9.6 flare that originated from the active region NOAA 2904 around 7:55 UT - SWAP image. Find a movie of the events here (SWAP movie) https://proba2.oma.be/swap/data/mpg/movies/20211206_swap_movie.mp4
Sunday Dec 12
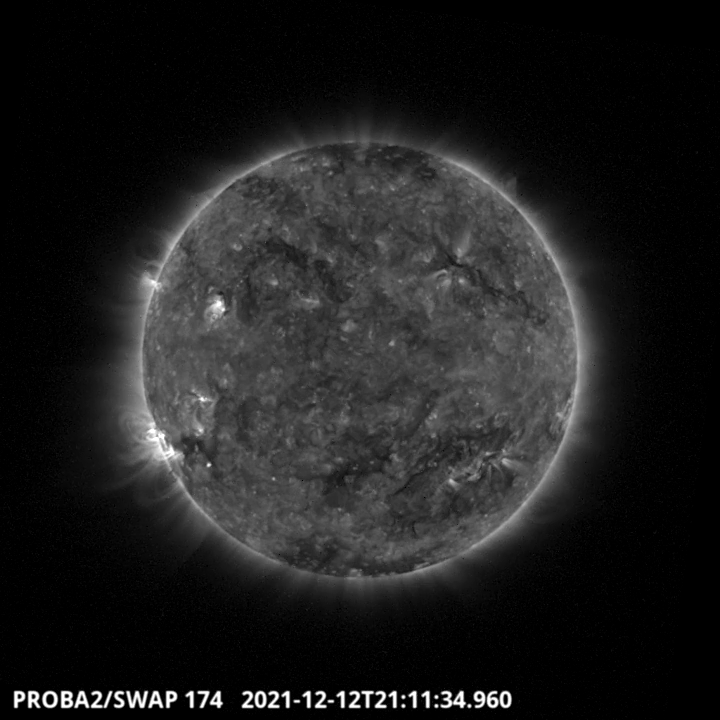
A C1.2 flare occurred on the South West limb of the solar disk around 21:11 UT, as seen on the SWAP image above. Find a movie of the events here (SWAP movie) https://proba2.oma.be/swap/data/mpg/movies/20211212_swap_movie.mp4
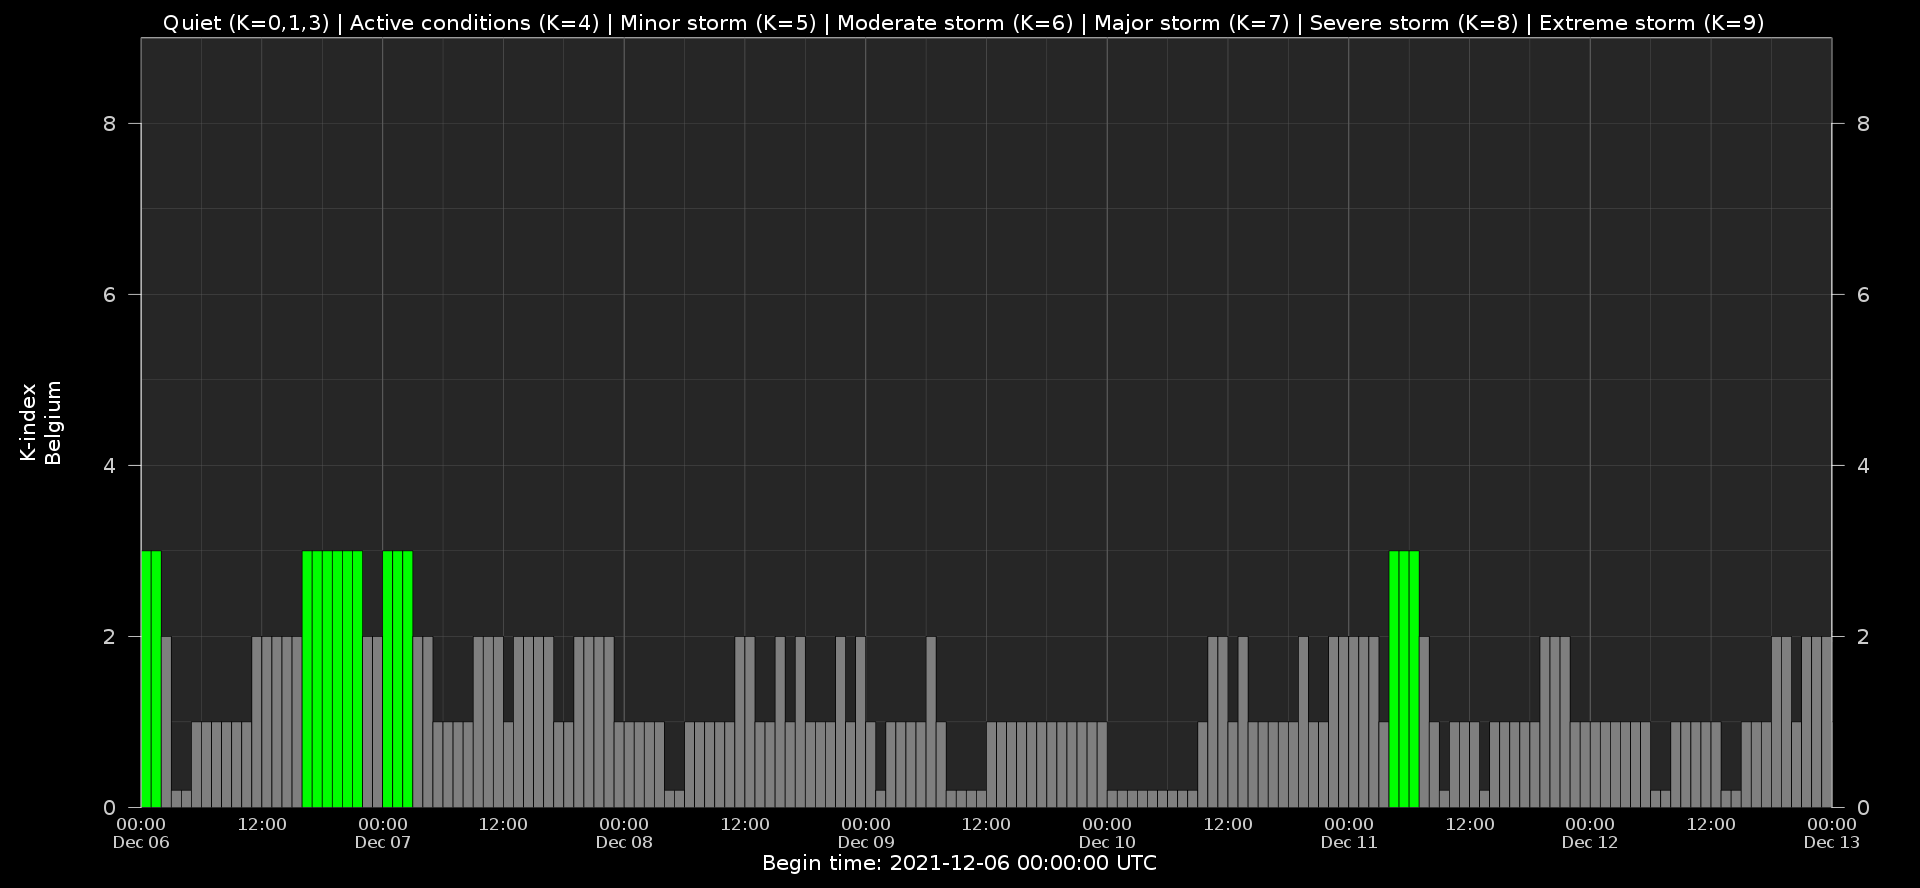
Geomagnetic Observations in Belgium
Local K-type magnetic activity index for Belgium based on data from Dourbes (DOU) and Manhay (MAB). Comparing the data from both measurement stations allows to reliably remove outliers from the magnetic data. At the same time the operational service availability is improved: whenever data from one observatory is not available, the single-station index obtained from the other can be used as a fallback system.
Both the two-station index and the single station indices are available here: http://ionosphere.meteo.be/geomagnetism/K_BEL/
The SIDC Space Weather Briefing
The Space Weather Briefing presented by the forecaster on duty from Dec 5 to 12. It reflects in images and graphs what is written in the Solar and Geomagnetic Activity report.

A pdf-version: https://www.stce.be/briefings/20211213_SWbriefing.pdf
The movie: https://www.stce.be/briefings/20211213_SWbriefing.m4v
Review of ionospheric activity
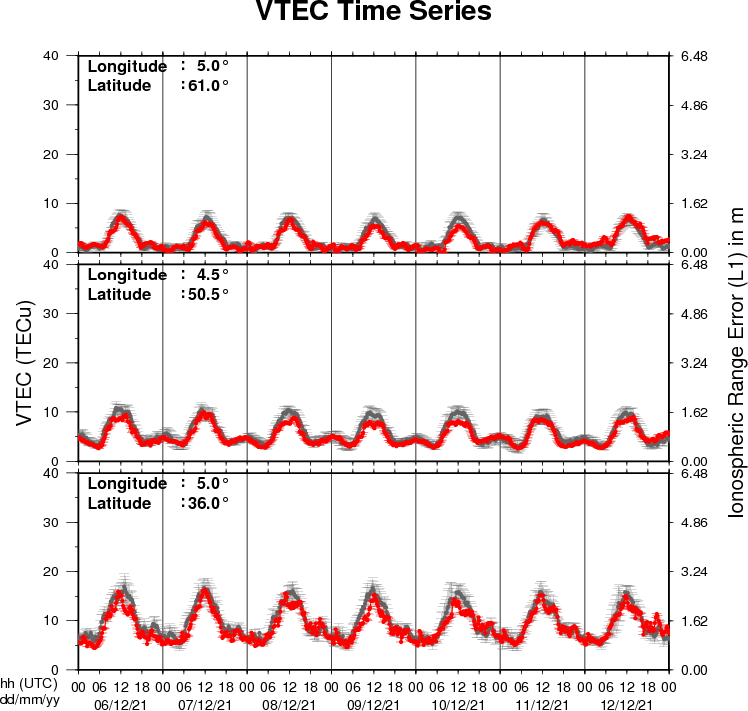
The figure shows the time evolution of the Vertical Total Electron Content (VTEC) (in red) during the last week at three locations:
a) in the northern part of Europe(N61�, 5�E)
b) above Brussels(N50.5�, 4.5�E)
c) in the southern part of Europe(N36�, 5�E)
This figure also shows (in grey) the normal ionospheric behaviour expected based on the median VTEC from the 15 previous days.
The VTEC is expressed in TECu (with TECu=10^16 electrons per square meter) and is directly related to the signal propagation delay due to the ionosphere (in figure: delay on GPS L1 frequency).
The Sun's radiation ionizes the Earth's upper atmosphere, the ionosphere, located from about 60km to 1000km above the Earth's surface.The ionization process in the ionosphere produces ions and free electrons. These electrons perturb the propagation of the GNSS (Global Navigation Satellite System) signals by inducing a so-called ionospheric delay.
See http://stce.be/newsletter/GNSS_final.pdf for some more explanations ; for detailed information, see http://gnss.be/ionosphere_tutorial.php
Action!
Check out our activity calendar: activities and encounters with the Sun-Space-Earth system and Space Weather as the main theme. We provide occasions to get submerged in our world through educational, informative and instructive activities.
If you want your event in our calendar, contact us: stce_coordination at stce.be
In 2022
* January 25, Public Lecture on the Solar Corona in EUV (Dutch), Urania, Hove, Belgium
* February 14-18, online Space Weather Introductory Course by SWEC, Space Weather Education Center - registrations are open
* February 22, Public Lecture on Space Weather and Aviation (Dutch), Urania, Hove, Belgium
* February 26, Public Lecture on Space Weather, Satellites and Aviation (Dutch), UGent Volkssterrenwacht Armand Pien, Gent, Belgium
* March 14-16, onsite (!) Space Weather Introductory Course by SWEC, Space Weather Education Center - registrations are open
* April 28, Public Lecture on SDO/EUI, Astropolis, Oostende, Belgium
* August 25, Public Lecture on Space Weather and Aviation, Astropolis, Oostende, Belgium
* October 24-28, 18th European Space Weather Week, Zagreb, Croatia
Check: https://www.stce.be/calendar