- Table of Content
- 1.High sunspot n...
- 2.Review of sola...
- 3.Review of geom...
- 4.The Internatio...
- 5.Noticeable Sol...
- 6.Geomagnetic Ob...
- 7.The SIDC Space...
- 8.Review of iono...
- 9.Action!
2. Review of solar activity
3. Review of geomagnetic activity
4. The International Sunspot Number by Silso
5. Noticeable Solar Events (20 Dec 2021 - 26 Dec 2021)
6. Geomagnetic Observations in Belgium
7. The SIDC Space Weather Briefing
8. Review of ionospheric activity
9. Action!
High sunspot numbers
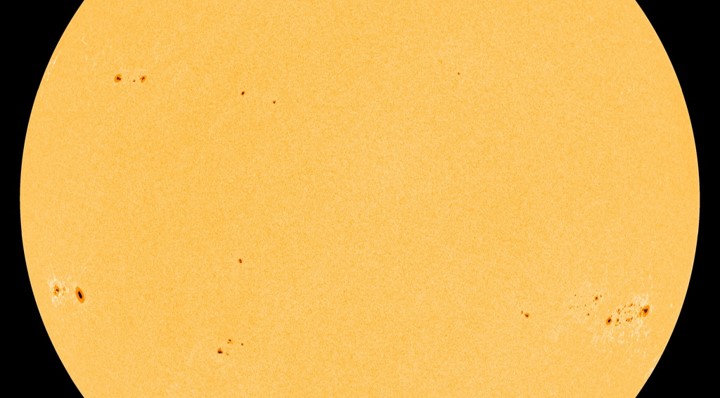
After a slow start with even a few spotless days on 9-11 December, sunspot activity shifted into a higher gear from mid-December onwards. A flurry of sunspot groups emerged, with the daily number of sunspot regions around 9 (6-11) for nearly 2 weeks. The daily estimated international sunspot number (EISN ; SILSO https://wwwbis.sidc.be/silso/eisnplot ) reached 149 and 145 on respectively 22 and 23 December. Though these are not the final values yet, they are virtually certain to be the highest values so far this solar cycle, and the highest recorded since September 2015. The SDO/HMI (http://sdo.gsfc.nasa.gov/data/aiahmi/ ) imagery underneath shows a still of the visible solar disk on 23 December at 11:00UT.
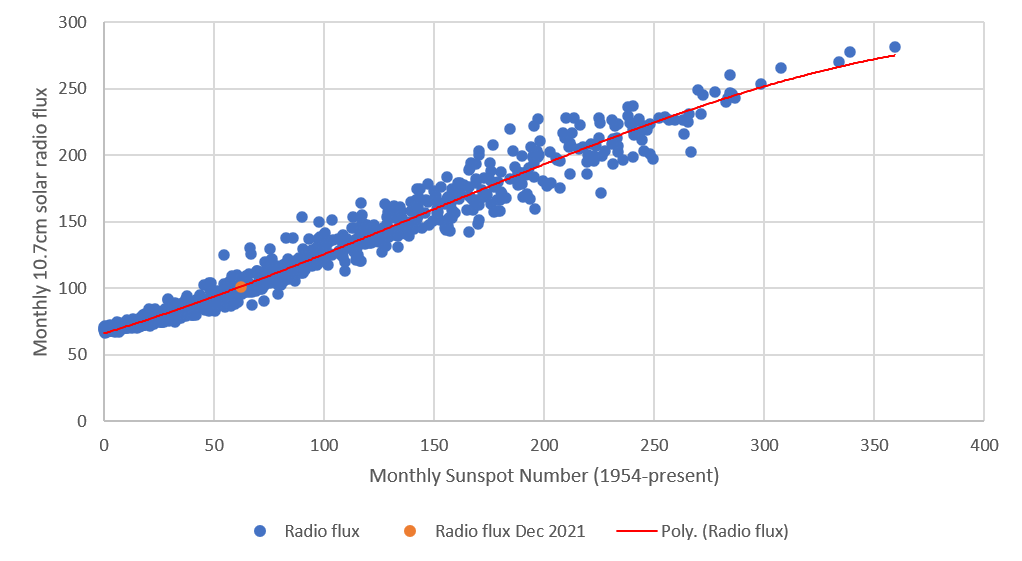
Quite a few of the visible sunspot groups were small and often barely visible, while the other groups had not very complex magnetic configurations. This was reflected in the flaring activity, with a relatively high number of C-class flares (10 or more every day), but only 5 low-level M-class flares (M1) during the entire period. Also the 10.7 cm solar radio flux (Penticton; https://www.spaceweather.gc.ca/index-en.php ) was at levels that could be expected for these sunspot numbers, occasionally enhanced by the radio noise generated by a solar flare taking place during or just before the recording period, such as on 18 and 21 December. The graph underneath shows the monthly values for the sunspot number versus the corresponding 10.7 cm radio flux since January 1954. The red curve, a 3rd-degree polynomial, gives a first idea of the relationship between these two parameters. Note it slightly underestimates the radio flux when the sunspot number is very low or very high, but as a first proxy it conveys the general evolution very well. The provisional (and incomplete) December 2021 pair of values (sunspot number, radio flux) nicely fits this curve, and also indicates that the current solar cycle still has a long way to go to its maximum (see the STCE's SC25 Tracking page at https://www.stce.be/content/sc25-tracking ), which is expected for August 2024 with smoothed values for the sunspot number and radio flux of 115 and 136 sfu (solar flux unit, 1 sfu = 10-22 W m-2 Hz-1) respectively.
Review of solar activity
Over the past week the solar activity was at very low to moderate with four M-class flares and sixty-six C-class flares. There were fourteen active regions in total throughout the week, the most active ones being NOAA 2907, NOAA 2908, NOAA 2916 and NOAA 2918. The beginning of the week was dominated by NOAA 2907 (beta-gamma), which produced the majority of the C-class flaring on Dec 19th - Dec 20th, and NOAA 2908 (beta), which produced several C-class flares and an M1.8-class flare (peak time at 11:30 UTC on Dec 20th). On Dec 21st NOAA 2916 (beta) rotated from behind the east limb and produced an M1.1 (peak time at 07:50 UTC on Dec 21th) and an M1.4-class flare (peak time at 11:44 UTC on Dec 21th). All C-class flares on that day were produced by NOAA 2907 (beta-gamma) and NOAA 2908 (beta).
On Dec 22nd NOAA 2908 (beta) produced two C-class flares and the last M-class flare for the week, an M1.3-class flare with peak time 07:06 UTC. For the rest of the week the flaring activity remained at low levels with C-class flaring produced by NOAA 2907 (beta-gamma), NOAA 2908 (beta), NOAA 2909 (beta), NOAA 2916 (beta) and NOAA 2918 (beta).
At the end of the week NOAA 2907 (beta-gamma) turned over the west limb and kept its low levels of flaring activity from behind the limb. Meanwhile NOAA 2916 became the biggest and most complex active region increasing the type of its underlying photospheric magnetic filed to beta-gamma-delta. Regardless of its complexity NOAA 2916 remained at low-levels of activity, producing low C-class flares.
A rather faint and slow partial halo coronal mass ejection (CME) lifted off the Sun around midday on Dec 20th as a result of the M1.8-class flaring. This CME was expected to have minor impacts on Earth on Dec 24th and a magnetic cloud from it was possibly registered to arrive at L1 at 6 am UTC on Dec 24th and leave the Earth environment at midnight the same day. No another Earth-directed CMEs were detected in the available chronograph imagery throughout the week.
The greater than 10 MeV proton flux was at nominal levels throughout the entire week. The greater than 2 MeV electron flux was at background levels in the beginning of the week and started oscillating above the 1000 pfu threshold from Dec 22nd on as a result of a high-speed stream. The electron fluence was at nominal levels at the beginning of the week, crossed the border of nominal to moderate levels on Dec 23rd and stayed at moderate levels for the rest of the week.
Review of geomagnetic activity
The solar wind throughout the week (based on DSCOVR and ACE data) was dominated by a high speed stream (HSS), which arrived to Earth in the afternoon of Dec 19th. The solar wind speed was at highest on Dec 20th and Dec 21st, reaching a maximum value of 688 km/s on Dec 21st. The interplanetary magnetic field reached almost 24 nT with a minimum Bz of 21 nT at the arrival of the co-rotating interaction region (CIR) ahead of the HSS and decreased towards background slow solar wind values from Dec 21st on. The solar wind speed, temperature and density were enhanced until Dec 26th and declines towards background solar conditions after. Around 6am UTC on Dec 24th and at midnight UTC later that day a rotation in the magnetic field orientation possibly marked the passage of a magnetic cloud related to the expected partial halo CME which lifted off the Sun on Dec 20th. This period was marked with decreased temperature, slower solar wind speeds and slightly depleted density.
The geomagnetic conditions throughout the week were mostly quiet to unsettled. Isolated periods with minor geomagnetic storms were registered on Dec 19th with the arrival of the CIR. Quiet to active conditions were registered on Dec 20th and quiet to unsettled conditions followed from Dec 21st onwards with a single global active period until 3am UTC on Dec 21st.
The International Sunspot Number by Silso
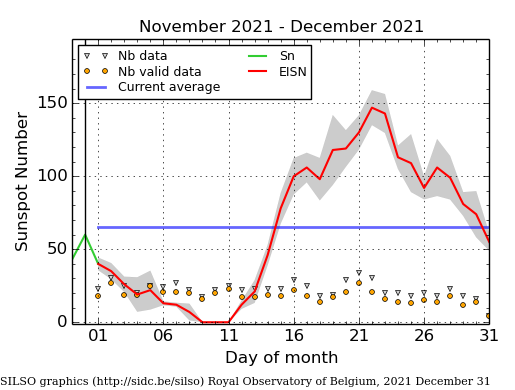
The daily Estimated International Sunspot Number (EISN, red curve with shaded error) derived by a simplified method from real-time data from the worldwide SILSO network. It extends the official Sunspot Number from the full processing of the preceding month (green line), a few days more than one solar rotation. The horizontal blue line shows the current monthly average. The yellow dots gives the number of stations that provided valid data. Valid data are used to calculate the EISN. The triangle gives the number of stations providing data. When a triangle and a yellow dot coincide, it means that all the data is used to calculate the EISN of that day.
Noticeable Solar Events (20 Dec 2021 - 26 Dec 2021)
| DAY | BEGIN | MAX | END | LOC | XRAY | OP | 10CM | TYPE | Cat | NOAA |
| 20 | 1112 | 1136 | 1155 | S22W5 | M1.8 | 1N | II/2 | 86 | 2908 | |
| 21 | 0743 | 0750 | 0757 | S21W14 | M1.1 | SF | 2916 | |||
| 21 | 1131 | 1144 | 1149 | M1.4 | III/1 | 2916 | ||||
| 22 | 0654 | 0706 | 0721 | S23W27 | M1.3 | 1N | II/2 | 86 | 2908 |
| LOC: approximate heliographic location | TYPE: radio burst type |
| XRAY: X-ray flare class | Cat: Catania sunspot group number |
| OP: optical flare class | NOAA: NOAA active region number |
| 10CM: peak 10 cm radio flux |
Geomagnetic Observations in Belgium
Local K-type magnetic activity index for Belgium based on data from Dourbes (DOU) and Manhay (MAB). Comparing the data from both measurement stations allows to reliably remove outliers from the magnetic data. At the same time the operational service availability is improved: whenever data from one observatory is not available, the single-station index obtained from the other can be used as a fallback system.
Both the two-station index and the single station indices are available here: http://ionosphere.meteo.be/geomagnetism/K_BEL/

The SIDC Space Weather Briefing
The Space Weather Briefing, made by the forecaster on duty covers the period Dec 19 to 26. It reflects in images and graphs what is written in the Solar and Geomagnetic Activity report.
A pdf-version: https://www.stce.be/briefings/20211227_SWbriefing.pdf
The movie: https://www.stce.be/briefings/20211227_SWbriefing.m4v
Review of ionospheric activity

The figure shows the time evolution of the Vertical Total Electron Content (VTEC) (in red) during the last week at three locations:
a) in the northern part of Europe(N61�, 5�E)
b) above Brussels(N50.5�, 4.5�E)
c) in the southern part of Europe(N36�, 5�E)
This figure also shows (in grey) the normal ionospheric behaviour expected based on the median VTEC from the 15 previous days.
The VTEC is expressed in TECu (with TECu=10^16 electrons per square meter) and is directly related to the signal propagation delay due to the ionosphere (in figure: delay on GPS L1 frequency).
The Sun's radiation ionizes the Earth's upper atmosphere, the ionosphere, located from about 60km to 1000km above the Earth's surface.The ionization process in the ionosphere produces ions and free electrons. These electrons perturb the propagation of the GNSS (Global Navigation Satellite System) signals by inducing a so-called ionospheric delay.
See http://stce.be/newsletter/GNSS_final.pdf for some more explanations ; for detailed information, see http://gnss.be/ionosphere_tutorial.php
Action!
Check out our activity calendar: activities and encounters with the Sun-Space-Earth system and Space Weather as the main theme. We provide occasions to get submerged in our world through educational, informative and instructive activities.
If you want your event in our calendar, contact us: stce_coordination at stce.be
In 2022
* January 25, Public Lecture on the Solar Corona in EUV (Dutch), Urania, Hove, Belgium
* February 14-18, online Space Weather Introductory Course by SWEC, Space Weather Education Center - registrations are open
* February 22, Public Lecture on Space Weather and Aviation (Dutch), Urania, Hove, Belgium
* February 26, Public Lecture on Space Weather, Satellites and Aviation (Dutch), UGent Volkssterrenwacht Armand Pien, Gent, Belgium
* March 14-16, onsite (!) Space Weather Introductory Course by SWEC, Space Weather Education Center - registrations are open
* April 28, Public Lecture on SDO/EUI, Astropolis, Oostende, Belgium
* August 25, Public Lecture on Space Weather and Aviation, Astropolis, Oostende, Belgium
* October 24-28, 18th European Space Weather Week, Zagreb, Croatia
Check: https://www.stce.be/calendar