- Table of Content
- 1.The Christmas ...
- 2.Review of sola...
- 3.PROBA2 Observa...
- 4.The Internatio...
- 5.Noticeable Sol...
- 6.Geomagnetic Ob...
- 7.The SIDC Space...
- 8.Review of iono...
- 9.Action!
2. Review of solar and geomagnetic activity
3. PROBA2 Observations
4. The International Sunspot Number by SILSO
5. Noticeable Solar Events (17 Jan 2022 - 23 Jan 2022)
6. Geomagnetic Observations in Belgium
7. The SIDC Space Weather Briefing
8. Review of ionospheric activity
9. Action!
The Christmas 2021 eruption
The best gifts are usually those that you don't expect. A few weeks ago, everybody was watching the numerous sunspot groups on the earth-facing solar hemisphere. Very few would have noticed the faint activity in SDO's and PROBA2's extreme ultraviolet (EUV) imagery beyond the Sun's northeast limb, starting around Christmas Eve. However, in EUV imagery from Solar Orbiter (SolO) and STEREO-A, that eruption revealed to be far more interesting. Those two spacecraft were trailing Earth by respectively 9 and 35 degrees, and so had a better view on the Sun's farside. The image underneath shows the positions of Earth, Solar Orbiter (pink dot), STEREO-A (A), and the Parker Solar Probe (PSP) on 25 December 2021 (00:00UT).

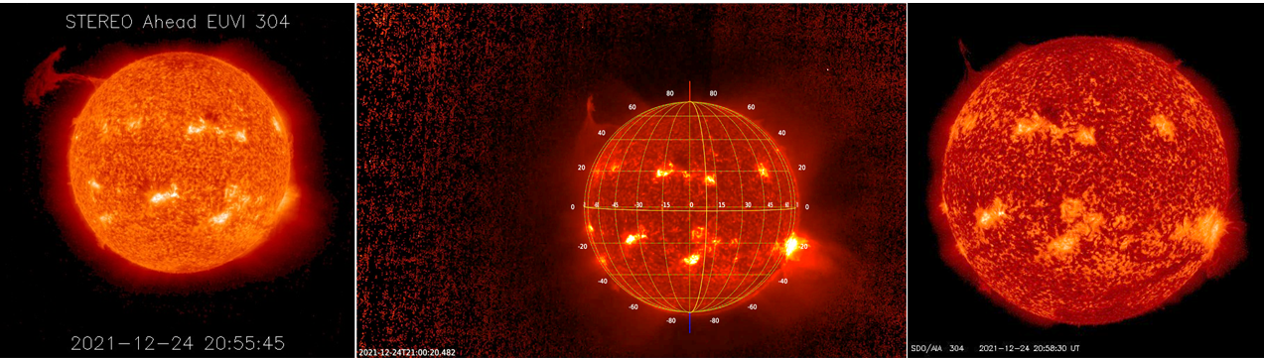
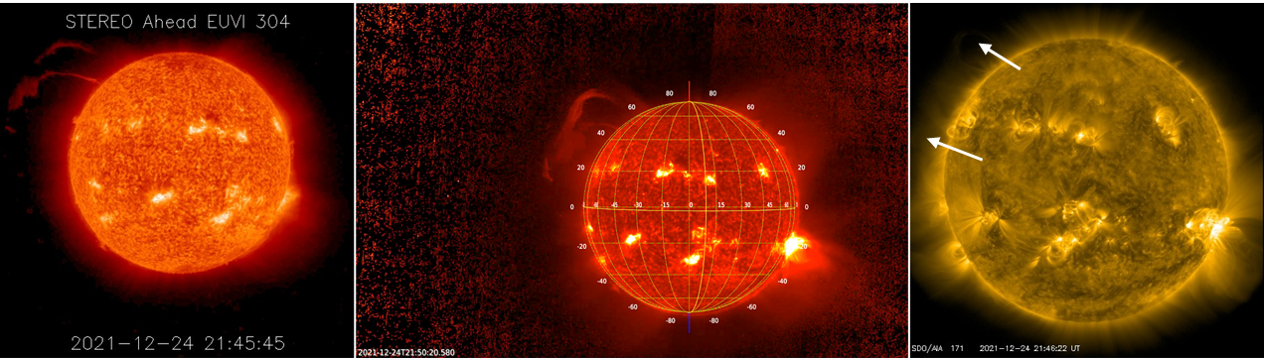
So, what did the EUV imagers on board of these satellites actually see? Underneath a comparison ordered according to the best view on the Sun's farside. On the left we have STEREO-A/EUVI 304, in the middle the view by SolO/EUI/FSI 304 (with coordinate grid overlaid), and on the right the SDO/AIA 304 or (annotated) 171 image. The wavelength of 30.4 nm allows the imaging of the solar corona at temperatures around 80.000 degrees, at 17.1 nm this temperature is already around 700.000 degrees. The top row shows the view between 20:55-21:00UT, the lower images around 21:45-21:50UT. These timings coincide with what was best visible of this eruption in the AIA imagery (with annotated AIA 171 images identifying the erupting structure). These images show there was a sizeable eruption on the Sun's farside, with a more revealing view by those spacecraft which were more trailing the Earth (STEREO-A, SolO) and with a wider field of view (SolO).
The real fun started after 22UT, and was only visible in Solar Orbiter's FSI imagery. Indeed, the Atmospheric Imaging Assembly (AIA) of the Solar Dynamics Observatory (SDO) is designed to provide EUV images that span about 1.3 solar diameters, while the EUVI instrument on board of STEREO-A provides images which have a circular full sun field of view (FOV) covering about 1.7 solar diameters. However, SolO's EUI Full Sun Imager (FSI) has a field of view that corresponds to 7.15 solar diameters at the average Sun-Earth distance (about 150 million km), and still 2 solar diameters at perihelion (point closest to the Sun in SolO's orbit). Hence, this FOV is unprecedentedly large for a coronal EUV imager (Rochus et al. (2020) - https://www.aanda.org/articles/aa/full_html/2020/10/aa36663-19/aa36663-19.html ), and allows for tracking eruptions such as the one on 24-25 December to a much further distance from the Sun than previously possible.
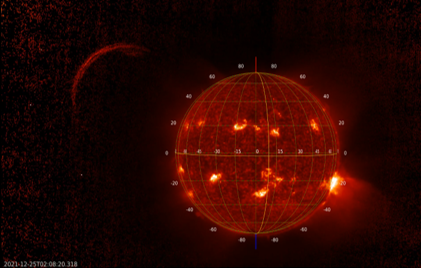
The screenshots underneath show the eruption on 25 December at 00:36UT and 02:08UT, evolving from a dense complex structure close to the Sun at 21:50UT (see above) to a slowly thinning and simplifying plasma ribbon hovering in space at a plane-of-the-sky (projected) distance of at least 700.000 km from the Sun (twice the Earth-Moon distance) around 00:36UT. This ribbon had a plane-of-the-sky length of at least 1.1 million km (about 3 times the Earth-Moon distance) at that time. Movie clips are available in the online version of this news item at https://www.stce.be/news/570/welcome.html
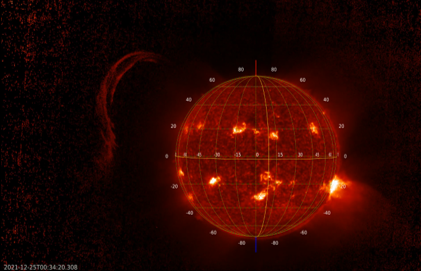
Further dissolving, shortening, and slowly moving away from the Sun, the ribbon could be tracked to more than 1 million km from the solar surface (again plane-of-the-sky) up to around 03UT on 25 December. From triangulation, the position of the eruption was approximately East 137 degrees North 39 degrees, which means that the event was on the farside for all 3 spacecraft, i.e. STEREO-A, SolO, and SDO (Earth: 47 degrees behind the east solar limb).
A slow-moving coronal mass ejection (CME) from this eruption was already well in progress as tracked by the SOHO/LASCO C2 and STEREO-A/COR2 coronagraphs from around 22UT on 24 December onwards, with plane-of-the-sky speeds of respectively 100-200 and 200-300 km/s. This difference is most likely attributable to the difference in vantage points between the 2 spacecraft, about 35 degrees.
Though SOHO and SolO were not observing from the same location, the separation is small enough to try and put the LASCO white-light coronagraphic pictures over the FSI EUV images. The imagery is made a bit noisy to allow tracking the ribbon simultaneously in EUV and white light in the overlap region, i.e. the coronagraphic imagery was made a bit transparent. Amazingly, by doing so, the obtained images seem to suggest that the plasma ribbon visible in EUV (FSI) also appeared in the white-light coronagraphic images from LASCO as can be seen in the annotated compilation underneath. There's a small time delay between the two, most likely due to the different perspective (about 9 degrees) or because a different part of the same structure is being imaged. A denoised version, available in the online news item, shows this even more clearly. Nonetheless, this offers a great opportunity to find out more on the kinematics, true structure, and composition of this feature as it further moved away from the Sun. Also, the position of the eruption (E137 N39) seems to suggest that the associated CME went in the direction of PSP, which offers another great science opportunity, this time to match the observed CME and maybe even the plasma ribbon to in-situ solar wind measurements by PSP. It looks like this Christmas eruption is going to result in some highly interesting science papers and conference talks for many scientists. We'll keep you posted of the results!

Credits movies and contributions: the SolO/EUI team (http://www.sidc.be/EUI/intro ) and JHelioviewer (https://www.jhelioviewer.org/).
Review of solar and geomagnetic activity
Solar Activity
At the start of the week, 8 active regions were counted. Only NOAA AR 2929 and 2930 produced C-class flares. The former produced also 2 M class flares also (M1.5 on 18 January and M5.5 on 20 January), both associated with CMEs.
There were CMEs with an Earth directed component on 15, 16 and 18 January.
Near the end of the week, only 2 active regions were visible, and solar activity was low.
A positive polarity equatorial coronal hole crossed central meridian on 21 January.
The greater than 10 MeV proton flux passed the threshold of 10 pfu on 20 January (due to the M5.5 flare and CME), for about half a day, then returned to nominal values. The greater than 2 MeV electron flux increased above the 1000 pfu alert threshold every day of the week (going back to nominal levels daily). The electron fluence was at normal to moderate levels.
Geomagnetic Activity
The Earth was under the influence of a high speed stream at the beginning of the week, until 20 January (with speeds close to 700 km/s) when the solar wind speed decreased below 500 km/s for the rest of the week. There were ICME arrivals on 17 January (CME from 14/1, K_Bel = 4, Kp = 5), on 18 January (CMEs from 15-16/1, K_Bel = 5, Kp = 6) and on 21 January (CME from 18 January, K_Bel = 3, Kp = 3).
PROBA2 Observations
Solar Activity
Solar flare activity fluctuated from very low to moderate during the week.
In order to view the activity of this week in more detail, we suggest to go to the following website from which all the daily (normal and difference) movies can be accessed: https://proba2.oma.be/ssa
This page also lists the recorded flaring events.
A weekly overview movie can be found here (SWAP week 617): https://proba2.sidc.be/swap/data/mpg/movies/weekly_movies/weekly_movie_2022_01_17.mp4
Details about some of this week�s events can be found further below.
If any of the linked movies are unavailable they can be found in the P2SC movie repository here: https://proba2.oma.be/swap/data/mpg/movies/
Thursday Jan 20
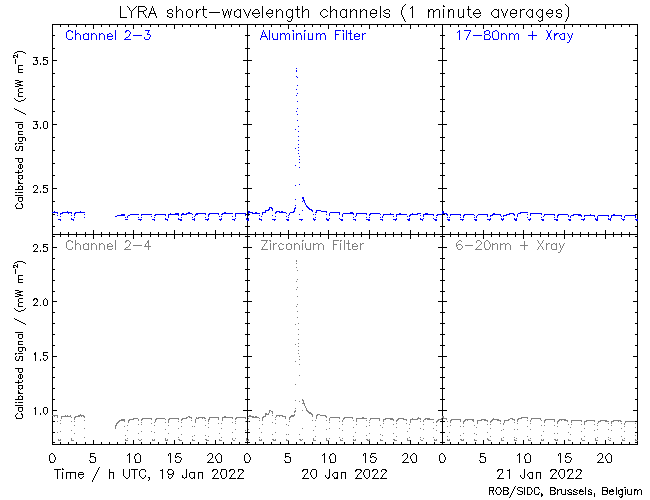
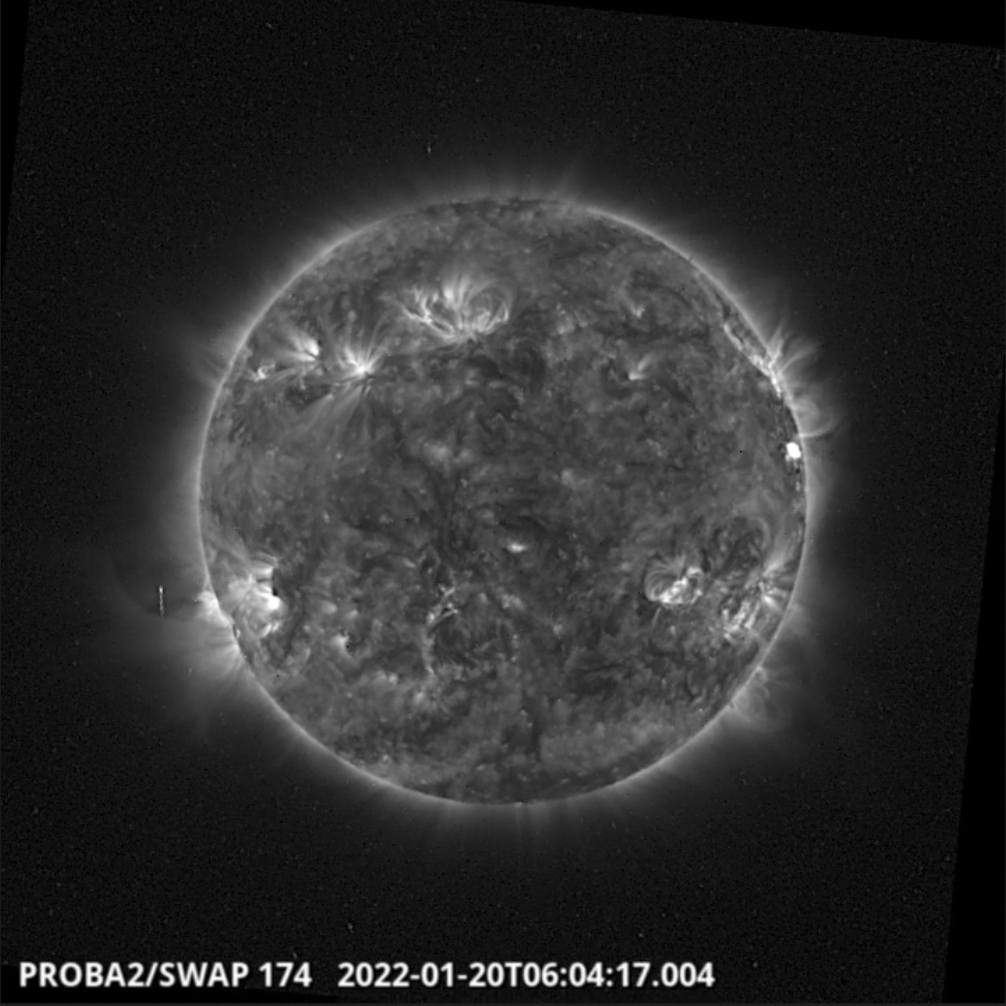
The largest flare of the week, an M5.5 flare, was observed by SWAP and LYRA. The flare is visible near the west limb on 2022-Jan-20, as shown in the SWAP image above taken at 06:04 UT.
Find a movie of the event here (SWAP movie): https://proba2.sidc.be/swap/movies/20220120_swap_movie.mp4
The International Sunspot Number by SILSO
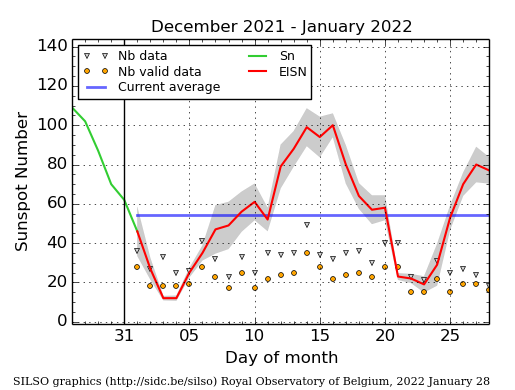
The daily Estimated International Sunspot Number (EISN, red curve with shaded error) derived by a simplified method from real-time data from the worldwide SILSO network. It extends the official Sunspot Number from the full processing of the preceding month (green line), a few days more than one solar rotation. The horizontal blue line shows the current monthly average. The yellow dots gives the number of stations that provided valid data. Valid data are used to calculate the EISN. The triangle gives the number of stations providing data. When a triangle and a yellow dot coincide, it means that all the data is used to calculate the EISN of that day.
Noticeable Solar Events (17 Jan 2022 - 23 Jan 2022)
| DAY | BEGIN | MAX | END | LOC | XRAY | OP | 10CM | TYPE | Cat | NOAA |
| 18 | 1701 | 1744 | 1817 | N9W54 | M1.5 | SF | 150 | II/1IV/1 | 6 | 2929 |
| 20 | 0541 | 0601 | 0612 | N8W68 | M5.5 | 1F | 350 | V/3II/2 | 6 | 2929 |
| LOC: approximate heliographic location | TYPE: radio burst type |
| XRAY: X-ray flare class | Cat: Catania sunspot group number |
| OP: optical flare class | NOAA: NOAA active region number |
| 10CM: peak 10 cm radio flux |
Geomagnetic Observations in Belgium
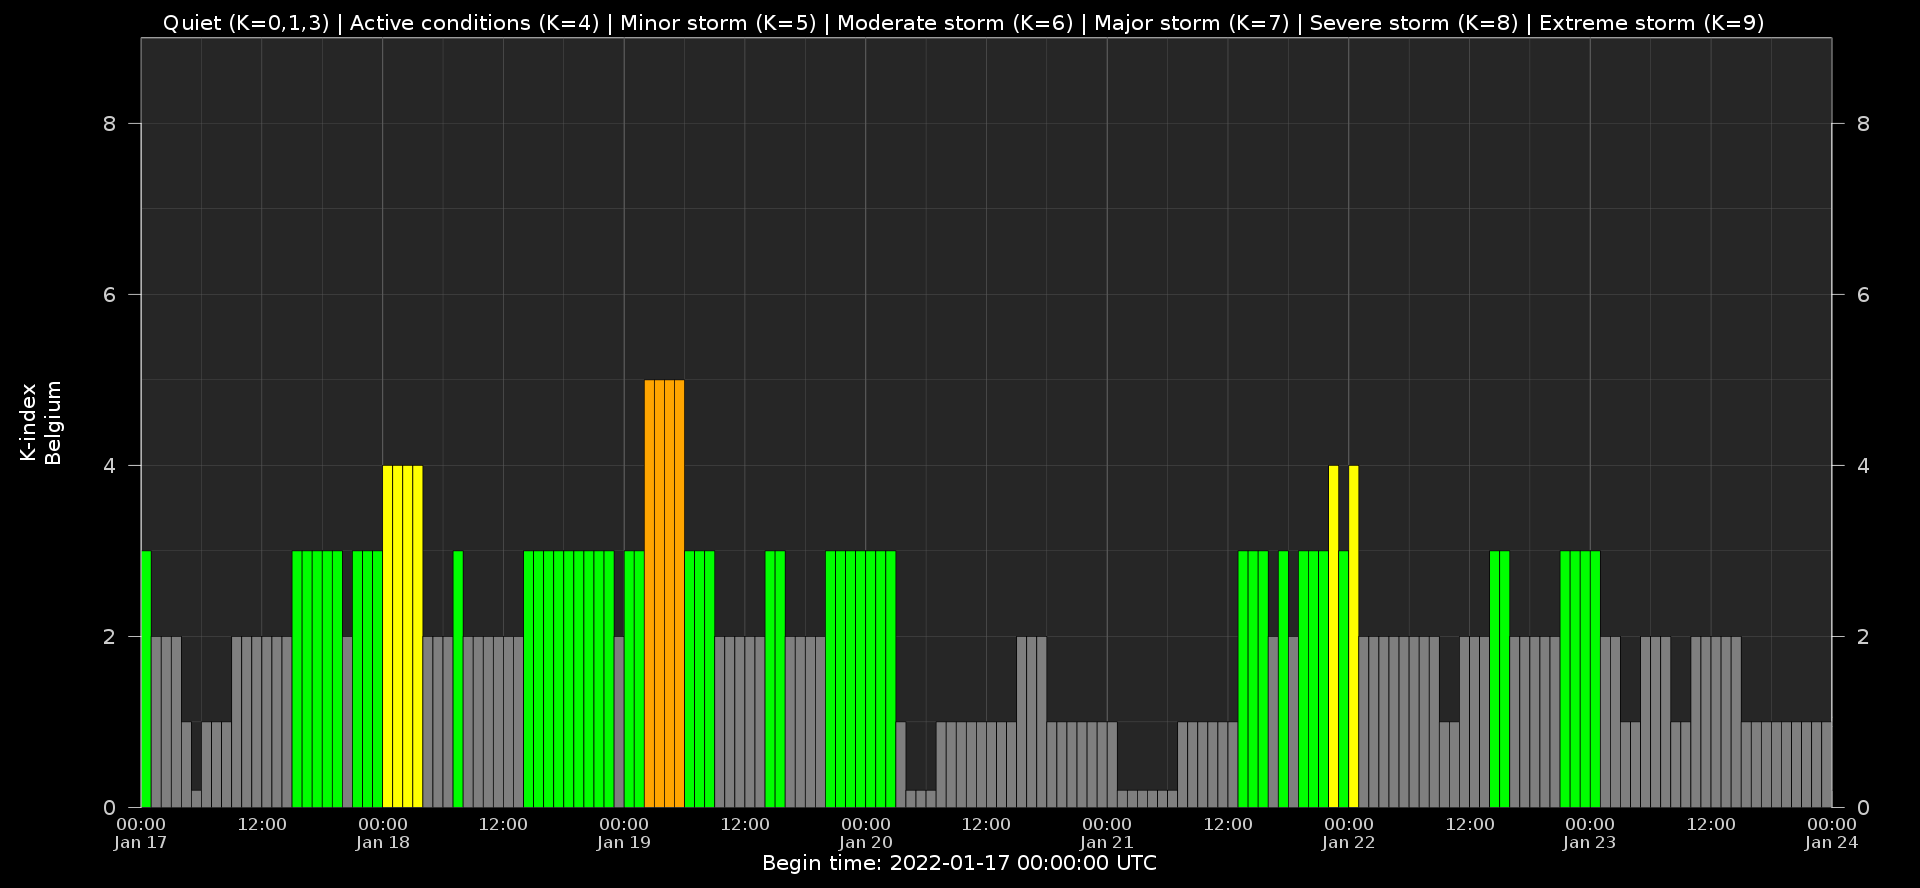
Local K-type magnetic activity index for Belgium based on data from Dourbes (DOU) and Manhay (MAB). Comparing the data from both measurement stations allows to reliably remove outliers from the magnetic data. At the same time the operational service availability is improved: whenever data from one observatory is not available, the single-station index obtained from the other can be used as a fallback system.
Both the two-station index and the single station indices are available here: http://ionosphere.meteo.be/geomagnetism/K_BEL/
The SIDC Space Weather Briefing
The Space Weather Briefing in pdf format presented by the forecaster on duty from Jan 16 to 23. It reflects in images and graphs what is written in the Solar and Geomagnetic Activity report: https://www.stce.be/briefings/20220124_SWbriefing.pdf

Review of ionospheric activity
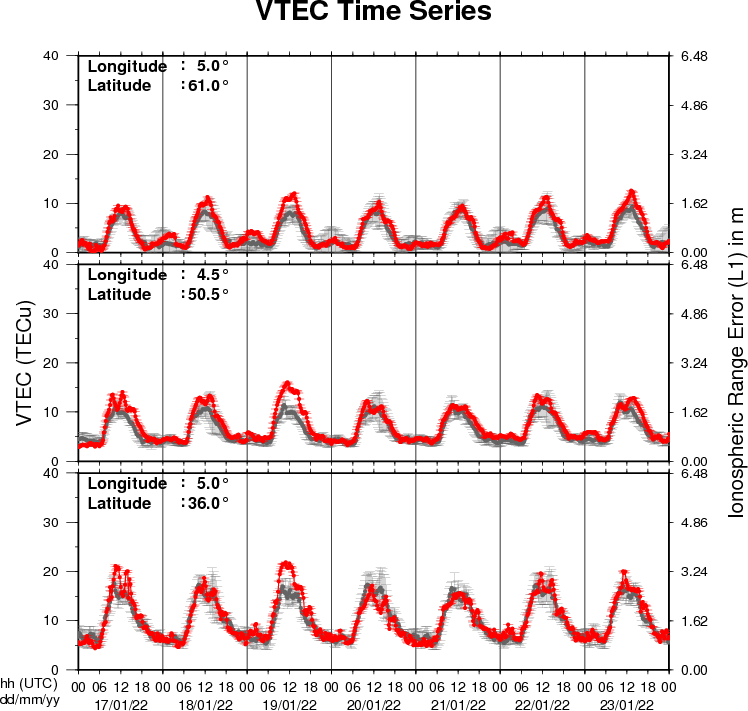
The figure shows the time evolution of the Vertical Total Electron Content (VTEC) (in red) during the last week at three locations:
a) in the northern part of Europe(N 61deg E 5deg)
b) above Brussels(N 50.5deg, E 4.5 deg)
c) in the southern part of Europe(N 36 deg, E 5deg)
This figure also shows (in grey) the normal ionospheric behaviour expected based on the median VTEC from the 15 previous days.
The VTEC is expressed in TECu (with TECu=10^16 electrons per square meter) and is directly related to the signal propagation delay due to the ionosphere (in figure: delay on GPS L1 frequency).
The Sun's radiation ionizes the Earth's upper atmosphere, the ionosphere, located from about 60km to 1000km above the Earth's surface.The ionization process in the ionosphere produces ions and free electrons. These electrons perturb the propagation of the GNSS (Global Navigation Satellite System) signals by inducing a so-called ionospheric delay.
See http://stce.be/newsletter/GNSS_final.pdf for some more explanations ; for detailed information, see http://gnss.be/ionosphere_tutorial.php
Action!
Check out our activity calendar: activities and encounters with the Sun-Space-Earth system and Space Weather as the main theme. We provide occasions to get submerged in our world through educational, informative and instructive activities.
If you want your event in our calendar, contact us: stce_coordination at stce.be
* February 14-18, online Space Weather Introductory Course by SWEC, Space Weather Education Center - registrations are open
* February 22, Public Lecture on Space Weather and Aviation (Dutch), Urania, Hove, Belgium
* February 26, Public Lecture on Space Weather, Satellites and Aviation (Dutch), UGent Volkssterrenwacht Armand Pien, Gent, Belgium
* March 14-16, onsite (!) Space Weather Introductory Course by SWEC, Space Weather Education Center - registrations are open
* April 26, Public Lecture on the Solar Corona in EUV (Dutch), Urania, Hove, Belgium
* April 28, Public Lecture on SDO/EUI, Astropolis, Oostende, Belgium
* August 25, Public Lecture on Space Weather and Aviation, Astropolis, Oostende, Belgium
* October 24-28, 18th European Space Weather Week, Zagreb, Croatia
Check: https://www.stce.be/calendar