- Table of Content
- 1.Another X-clas...
- 2.Review of sola...
- 3.Noticeable Sol...
- 4.PROBA2 Observa...
- 5.The Internatio...
- 6.Review of geom...
- 7.Geomagnetic Ob...
- 8.Review of iono...
- 9.Action!
2. Review of solar activity
3. Noticeable Solar Events (11 Apr 2022 - 17 Apr 2022)
4. PROBA2 Observations (11 Apr 2022 - 17 Apr 2022)
5. The International Sunspot Index by SILSO
6. Review of geomagnetic activity
7. Geomagnetic Observations in Belgium (11 Apr 2022 - 17 Apr 2022)
8. Review of ionospheric activity (11 Apr 2022 - 17 Apr 2022)
9. Action!
Another X-class flare!
After last week's high solar flare activity, which included an X-class flare on 17 April (see this STCE news item at https://www.stce.be/news/583/welcome.html ), solar flare production has continued at elevated levels. However, the source of these flares has gradually shifted from the impressive complex of sunspot regions NOAA 2993 and 2994 in the northeast solar quadrant towards a much tinier active region NOAA 2992 near the Sun's southwest limb. This can be seen in the annotated GOES x-ray curve underneath which covers the period from 14 April until noon 20 April. The flares produced by the NOAA 2993/94 complex are indicated in red, and by NOAA 2992 in green.

NOAA 2992 is certainly a far less prominent sunspot region than its big brothers NOAA 2993 and NOAA 2994. This can be seen in the SDO/HMI image underneath, taken late on 17 April when NOAA 2992 had started to produce its first M-class flares. Zooms of the 3 regions are inserted. Though NOAA 2992 was already near the solar limb, it could still be deduced from the available magnetograms that some mixed magnetic polarities were present. The last few white light images on 19 April seemed to indicate some renewed flux emergence near the trailing portion of the region, but little more could be said as the region rounded the solar limb just hours later.

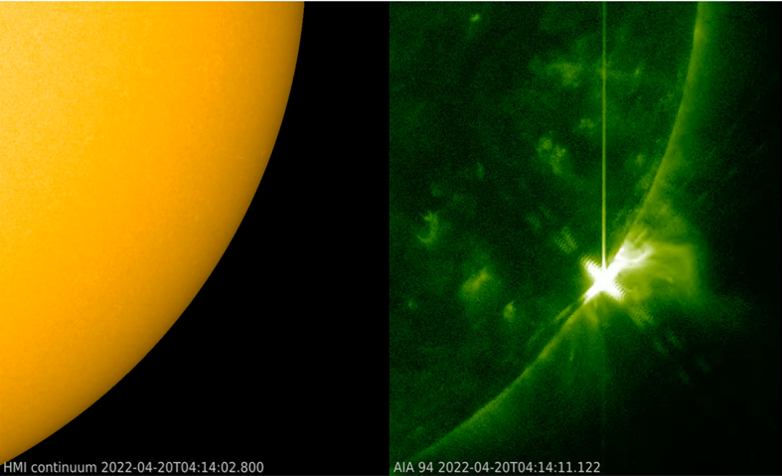
Then early on 20 April, NOAA 2992 produced an X2.2 flare peaking at 03:57UT. It was preceded by an M7.2 flare (with some contribution from flaring activity in NOAA 2994) which peaked at 01:36UT, and an M1.2 event peaking at 01:14UT. The X2.2 flare is the strongest flare so far this solar cycle. This is all the more impressive, as the source region had already rotated over the Sun's southwest limb, and so part of the flaring site was hidden by the limb. The images underneath are SDO/AIA 094 images (https://sdo.gsfc.nasa.gov/data/aiahmi/ ) showing the Sun in extreme ultraviolet at temperatures of several million degrees shortly after the flare's x-ray peak. First is a full Sun image, then a zoomed image (right) with a white light image (left) showing the absence of any sizeable sunspot. Clips are in the online version of this news item at https://www.stce.be/news/584/welcome.html
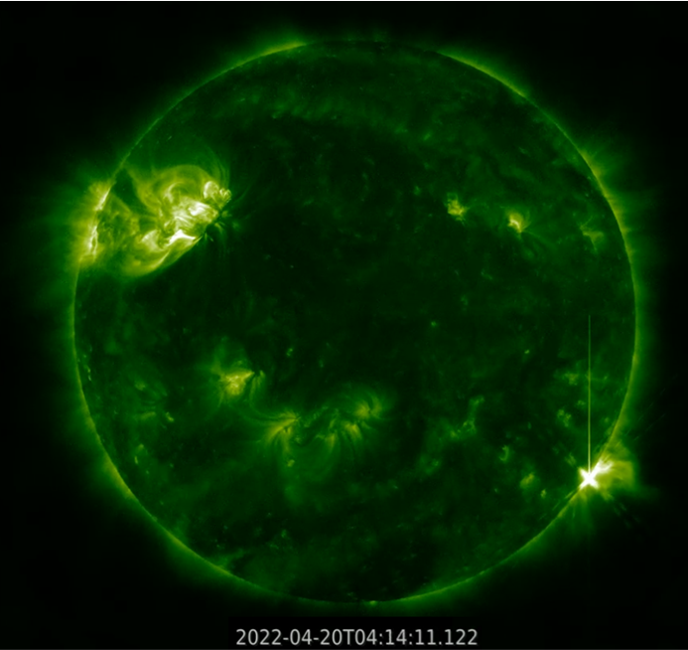
The flaring activity was associated with coronal waves (PROBA2/SWAP - https://proba2.sidc.be/ ) and Type II radio bursts, indicative of coronal mass ejections (CMEs - https://wwwbis.sidc.be/cactus/). However, these CMEs do not appear to be wide enough to have an earth-directed component. Over the next days, the behind-the-limb activity from NOAA 2992 is expected to dwindle down, but flares (M-class and an occasional X-class flare) from the NOAA 2993/94 complex remain certainly possible.

Review of solar activity
Flares
This week, 21 C-class flares, 4 M-class flares and 1 X-class flare were reported by GOES. The M-class and X-class flares were originating from the NOAA ARs 2993 and 2994, when these regions were rotating across the East solar limb on the visible side of the Sun. The GOES X 1.1 flare that was observed in the morning of April 17, peaked at 03:34 UT and was associated with the EIT wave and partial halo CME.
Coronal Mass Ejections
Several wide CMEs were observed this week, but only one was clearly Earth directed.
A full halo CME, first observed in the SOHO/LASCO C2 field of view at 05:48 UT on April 11, had a projected plane-of-the-sky speed of about 500 km/s. The CME was associated with the GOES C1.6 flare (peaking at 05:21 UT) which originated from the Catania sunspot group 71 (NOAA AR 2987). As the CME source region was at the center of the solar disc, the CME was expected to arrive to Earth.
A partial halo CME, with projected plane-of-the-sky speed of about 500 km/s and angular width of about 180 degrees, was observed in the evening of April 11. The CME was first time observed in the SOHO/LASCO C2 field of view at 21:12 UT and in the STEREO A/COR2 field of view at 20:23 UT. There were no clear on disc signatures of the CME observed on the visible side of the Sun, as seen from Earth or from the STEREO A. Considering the lack of the on disc signatures of the CME, the position of the STEREO A and the orientation of the CME, we concluded that this CME was a back side event and therefore Earth-directed.
A full halo CME with projected plane-of-the-sky speed of about 1000 km/s, was observed on April 13. The CME was first time observed in the SOHO/LASCO C2 filed of view at 13:25 UT and in the STEREO A/COR2 field of view at 13:23 UT. There were no clear on disc signatures of the CME observed on the visible side of the Sun, as seen from Earth or from the STEREO A. Similarly to the halo CME observed on April 11, this CME was a back side event.
The X 1.1 class flare of April 17 was associated with a fast partial halo CME with velocity of about 1000 km/s (as reported by CACTUS software) and an angular width of about 170 degrees. As the source region of the CME was at the East solar limb only the glancing blow from the CME-driven shock was expected at Earth.
Coronal Holes
Two positive polarity coronal holes were observed. The rather small, positive polarity equatorial coronal hole crossed central meridian at about 18h on April 12. The second coronal hole was elongated, had a positive polarity (possibly connected to the equatorial positive polarity coronal hole) and reached the central meridian at about 12 UT on April 14.
Noticeable Solar Events (11 Apr 2022 - 17 Apr 2022)
| DAY | BEGIN | MAX | END | LOC | XRAY | OP | 10CM | TYPE | Cat | NOAA |
| 15 | 1031 | 1101 | 1107 | M1.2 | VI/2 | 2993 | ||||
| 15 | 1347 | 1359 | 1411 | M1.9 | VII/2III/1 | 2993 | ||||
| 16 | 1449 | 1456 | 1509 | M1.0 | 2993 | |||||
| 17 | 0200 | 0211 | 0223 | M1.8 | 2993 | |||||
| 17 | 0200 | 0211 | 0223 | M1.9 | 2993 | |||||
| 17 | 0317 | 0334 | 0351 | X1.1 | III/2 | 2994 | ||||
| 17 | 1952 | 2002 | 2006 | S31W70 | M1.5 | SF | 42 | 76 | 2992 | |
| 17 | 2228 | 2234 | 2240 | S31W73 | M4.4 | SF | 110 | II/1 | 76 | 2992 |
| LOC: approximate heliographic location | TYPE: radio burst type |
| XRAY: X-ray flare class | Cat: Catania sunspot group number |
| OP: optical flare class | NOAA: NOAA active region number |
| 10CM: peak 10 cm radio flux |
PROBA2 Observations (11 Apr 2022 - 17 Apr 2022)
Solar Activity
Solar flare activity fluctuated from very low to high during the week.
In order to view the activity of this week in more detail, we suggest to go to the following website from which all the daily (normal and difference) movies can be accessed: https://proba2.oma.be/ssa
This page also lists the recorded flaring events.
A weekly overview movie (SWAP week 629) can be found here: https://proba2.sidc.be/swap/data/mpg/movies/weekly_movies/weekly_movie_2022_04_11.mp4.
Details about some of this week's events can be found further below.
If any of the linked movies are unavailable they can be found in the P2SC movie repository here: https://proba2.oma.be/swap/data/mpg/movies/
Sunday April 17

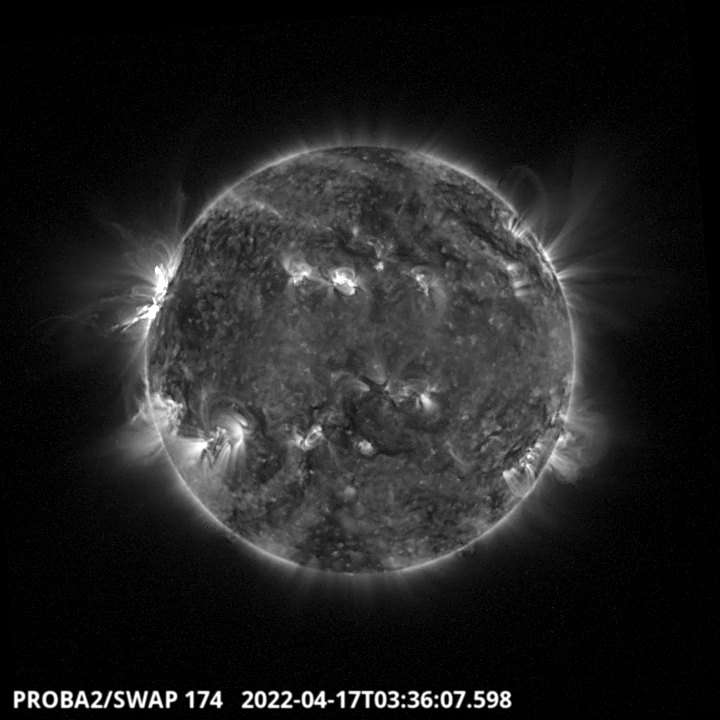
The largest flare of the week, an X1.1 flare, was observed by SWAP and LYRA. The flare is visible on the eastern limb on 2022-Apr-17, as shown in the SWAP image above taken at 03:36 UT.
Find a movie of the event here (SWAP movie): https://proba2.sidc.be/swap/movies/20220417_swap_movie.mp4.
The International Sunspot Index by SILSO
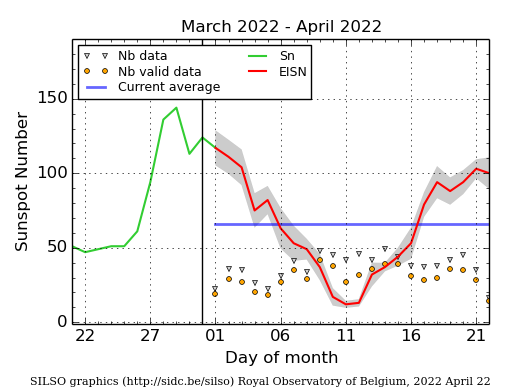
The daily Estimated International Sunspot Number (EISN, red curve with shaded error) derived by a simplified method from real-time data from the worldwide SILSO network. It extends the official Sunspot Number from the full processing of the preceding month (green line), a few days more than one solar rotation. The horizontal blue line shows the current monthly average. The yellow dots give the number of stations that provided valid data. Valid data are used to calculate the EISN. The triangle gives the number of stations providing data. When a triangle and a yellow dot coincide, it means that all the data is used to calculate the EISN of that day.
Review of geomagnetic activity
In situ solar wind
The solar wind speed was fluctuating between about 450 km/s and up to 630 km/s, as reported by DSCOVR. The interplanetary magnetic field magnitude was also strongly fluctuating, due to arrival of two CMEs and a fast solar wind, reaching values as high as 22 nT.
L1 in situ observations showed a sudden increase of the interplanetary magnetic field magnitude, the solar wind speed, density and temperature, at about 10:20 UT on April 12. The shock was followed by the ICME. There were two possible candidates as the origin of this ICME, the CME observed on April 07, and the CME observed on April 09. The observed solar wind velocity indicated that the CME most probably departed the Sun on April 09, and that it was associated with the large filament eruption from the southwest quadrant of the Sun.
On April 14 at about 07:20 UT, another ICME was in situ observed. This was the CME associated with the GOES C1.6 flare originating from the center of the solar disc active region. The CME was first observed in the SOHO/LASCO C2 filed of view at about 05:48 UT on April 11.
From the morning of April 16 until the end of the week, Earth was under the influence of a fast solar wind originating from the two positive polarity coronal holes. A maximum solar wind velocity of 630 km/s was observed by DSCOVR. SOHO/CELIAS reported a speed of 750 km/s.
Geomagnetic conditions
Geomagnetic conditions were mostly quiet to unsettled with the exception of April 14 and April 15 when the local station at Dourbes reported a K index of 4 and several intervals of K equal 5. NOAA reported three intervals of Kp equal 5 and one interval of Kp equal 6.
Geomagnetic Observations in Belgium (11 Apr 2022 - 17 Apr 2022)
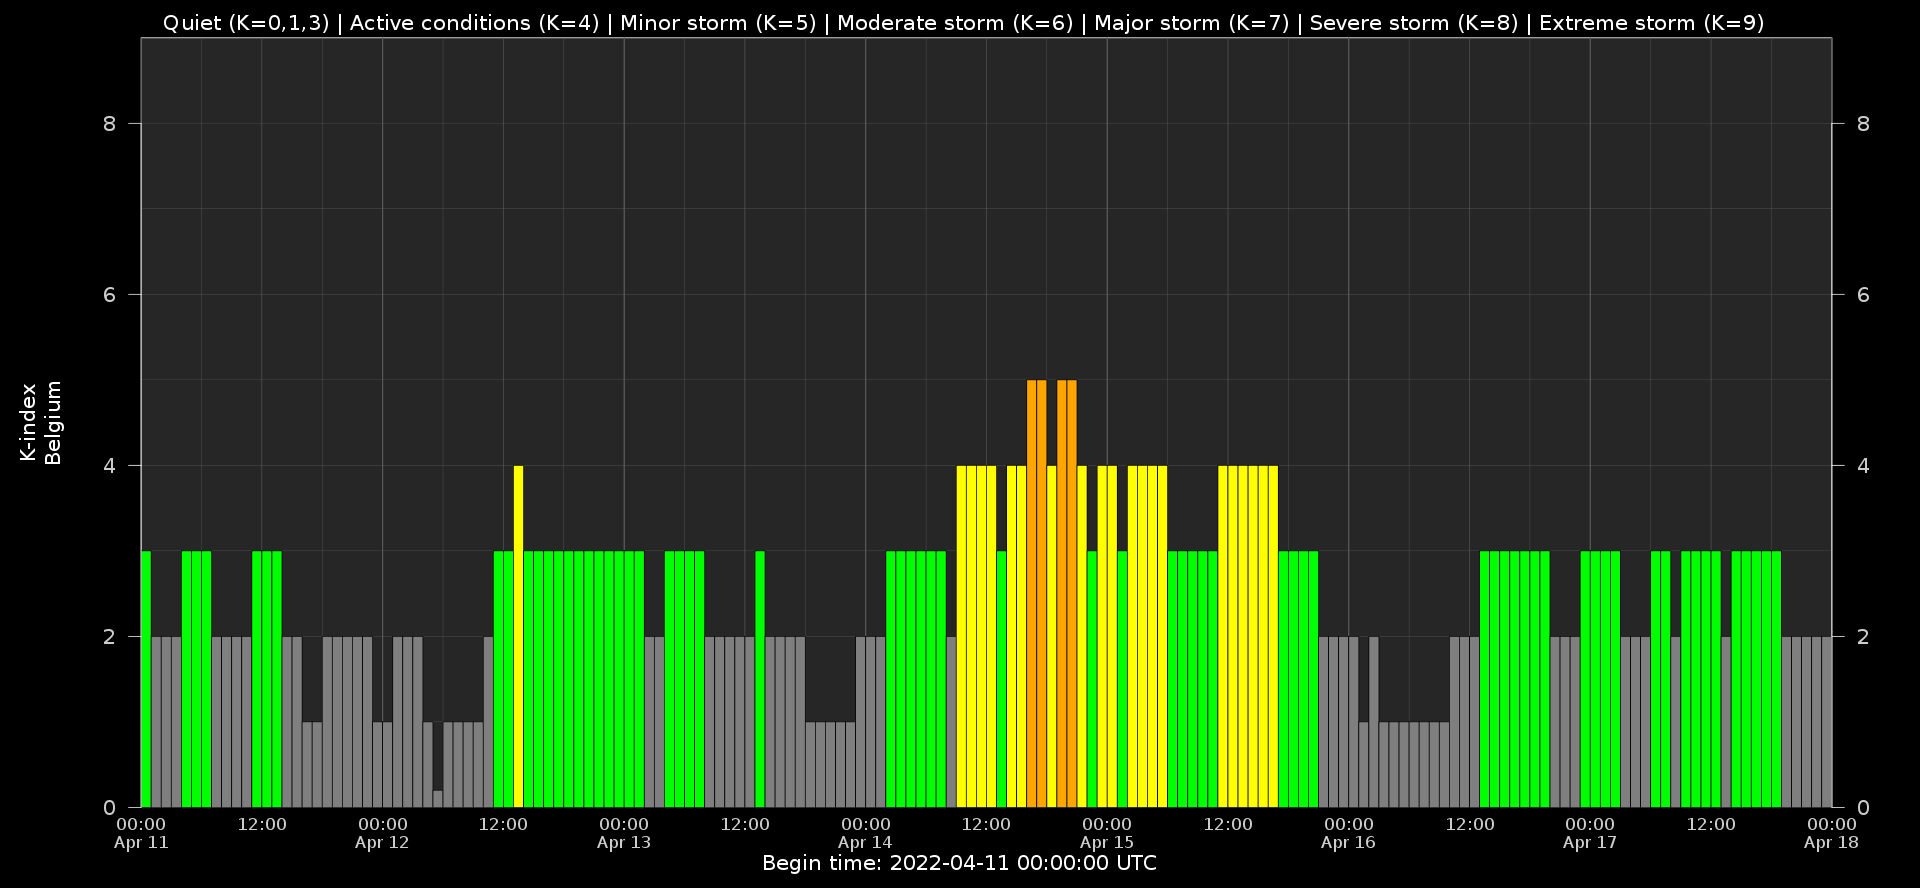
Local K-type magnetic activity index for Belgium based on data from Dourbes (DOU) and Manhay (MAB). Comparing the data from both measurement stations allows to reliably remove outliers from the magnetic data. At the same time the operational service availability is improved: whenever data from one observatory is not available, the single-station index obtained from the other can be used as a fallback system.
Both the two-station index and the single station indices are available here: http://ionosphere.meteo.be/geomagnetism/K_BEL/
Review of ionospheric activity (11 Apr 2022 - 17 Apr 2022)
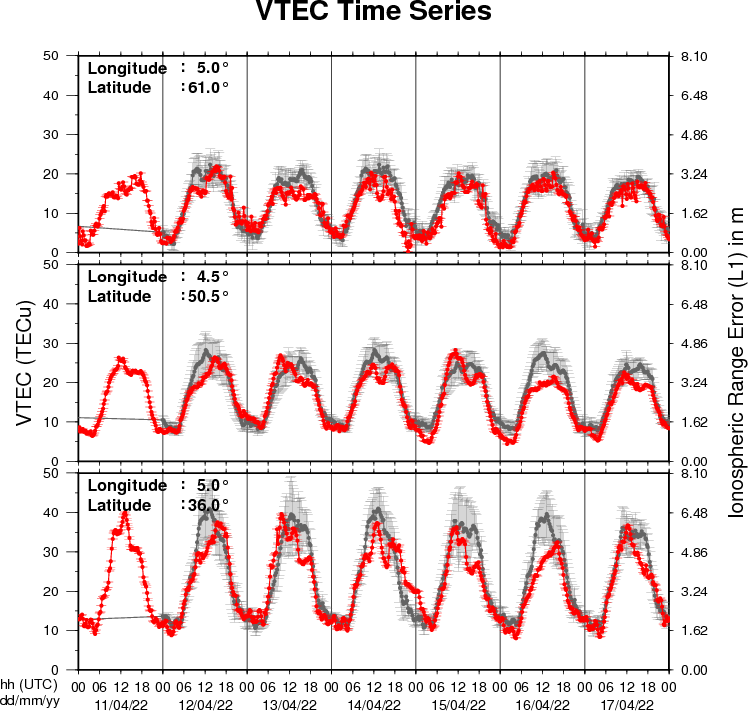
The figure shows the time evolution of the Vertical Total Electron Content (VTEC) (in red) during the last week at three locations:
a) in the northern part of Europe(N 61deg E 5deg)
b) above Brussels(N 50.5deg, E 4.5 deg)
c) in the southern part of Europe(N 36 deg, E 5deg)
This figure also shows (in grey) the normal ionospheric behaviour expected based on the median VTEC from the 15 previous days.
The VTEC is expressed in TECu (with TECu=10^16 electrons per square meter) and is directly related to the signal propagation delay due to the ionosphere (in figure: delay on GPS L1 frequency).
The Sun's radiation ionizes the Earth's upper atmosphere, the ionosphere, located from about 60km to 1000km above the Earth's surface.The ionization process in the ionosphere produces ions and free electrons. These electrons perturb the propagation of the GNSS (Global Navigation Satellite System) signals by inducing a so-called ionospheric delay.
See http://stce.be/newsletter/GNSS_final.pdf for some more explanations ; for detailed information, see http://gnss.be/ionosphere_tutorial.php
Action!
Check out our activity calendar: activities and encounters with the Sun-Space-Earth system and Space Weather as the main theme. We provide occasions to get submerged in our world through educational, informative and instructive activities.
If you want your event in our calendar, contact us: stce_coordination at stce.be
* April 5-24, SUN exhibit at the AfricaMuseum, Tervuren, belgium
* April 22, Workshop PromOptica - Electromagnetic Radiation Sensors, Space Pole, Brussels, Belgium
* April 26, Public Lecture on the Solar Corona in EUV (Dutch), Urania, Hove, Belgium
* April 27-29, STCE at the Symposium on Space Educational Activities, Barcelona, Spain
* April 28, Public Lecture on SolO/EUI, Astropolis, Oostende, Belgium
* June 13-15, Space Weather Introductory Course - onsite, by the STCE, Brussels, Belgium, registration is open.
* July 3, Public Lecture on STCE's mission to the Sun, Cosmodrome, Genk, Belgium
* August 25, Public Lecture on Space Weather and Aviation, Astropolis, Oostende, Belgium
* October 24-28, 18th European Space Weather Week, Zagreb, Croatia
* November 21-23, Space Weather Introductory Course - onsite, by the STCE, Brussels, Belgium, registration is open.
* December 5, 6, 8, 9, Space Weather Introductory Course - online, by the STCE, zoom - registration is open.
Check: https://www.stce.be/calendar