- Table of Content
- 1.Four flavors o...
- 2.Review of sola...
- 3.Review of geom...
- 4.PROBA2 Observa...
- 5.The Internatio...
- 6.Noticeable Sol...
- 7.Geomagnetic Ob...
- 8.The SIDC space...
- 9.Action!
2. Review of solar activity
3. Review of geomagnetic activity
4. PROBA2 Observations (4 Jul 2022 - 10 Jul 2022)
5. The International Sunspot Number by SILSO
6. Noticeable Solar Events (4 Jul 2022 - 10 Jul 2022)
7. Geomagnetic Observations at Dourbes (4 Jul 2022 - 10 Jul 2022)
8. The SIDC space weather briefing
9. Action!
Four flavors of a solar eruption
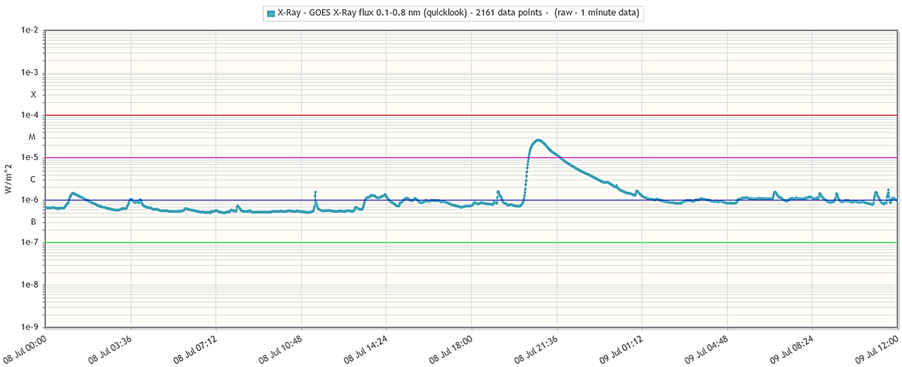
NOAA 3053 rounded the Sun's northeast limb on 4 July and produced an M2.5 flare late on 8 July. This was a long duration event (LDE) that started at 20:07UTC, peaked at 20:49UTC, and ended at 21:28UTC, as recorded by GOES (https://www.swpc.noaa.gov/products/goes-x-ray-flux ). Using the ROB's STAFF tool (http://www.staff.oma.be/ ), a graph with the evolution of the GOES soft x-ray flux was created for the period from 08 July at midnight until the next day at noon. The eruptive event clearly stands out. LDEs are usually associated with a coronal mass ejection (CME). Such was the case here, but the bulk of the CME was directed away from the Earth.
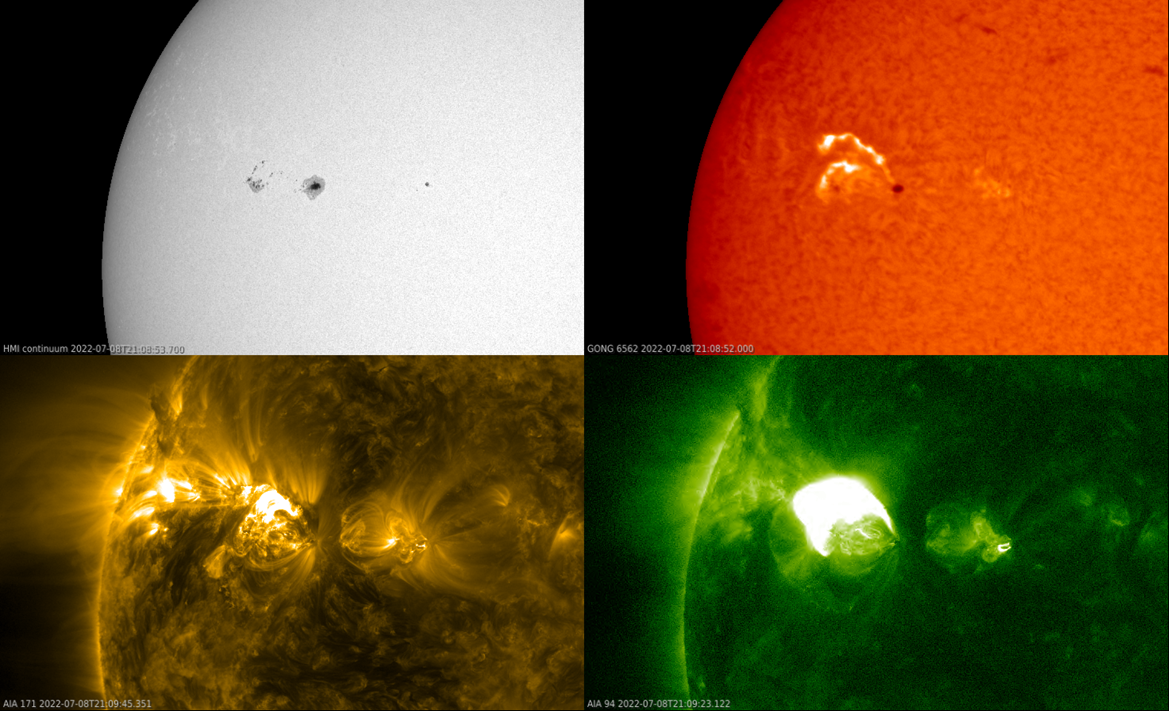
Using Space Weather HelioViewer (SWHV - http://swhv.oma.be/user_manual/), a mosaic was created showing the eruption at various wavelengths and running from 18:30 till 01:30UTC. This can be seen in the imagery underneath (taken around 21:09UTC), of which an animation is available in the online version of this article at https://www.stce.be/news/599/welcome.html In the upper left is a white light image (SDO/HMI - http://sdo.gsfc.nasa.gov/data/aiahmi/ ), showing the source region as a relatively open group with a well-sized asymmetric leading sunspot and a smaller but more complex trailing portion. This M2.5 solar flare was not visible in white light, an honor that is (usually) only reserved for the strongest flares. H-alpha images (upper right) show that the flare took place slightly north of this region around a filament. Solar filaments are clouds of charged particles ("plasma") above the solar surface squeezed between magnetic regions of opposite polarity. These magnetic fields may become unstable causing the filament to fully/partially erupt, with the possibility for the filament to reform after the eruption. H-alpha images show the Sun in the red portion of the visible spectrum near 656.3 nm, offering a glimpse of the chromosphere, a thin layer between the Sun's photosphere ("solar surface") and the corona, its hot outer atmosphere. Two parallel ribbons can be seen forming on each side where the filament was located, a tell-tale sign a flare has taken place. The H-alpha images were taken from the GONG network (https://gong.nso.edu/ ), a series of 6 similar observing stations distributed at regular intervals around the globe. This explains the somewhat "bumpy" images in the animation. The two lower images show the Sun in extreme ultraviolet and were taken by SDO/AIA. The lower left image was made using the AIA 171 filter, showing the Sun at a temperature near 700.000 degrees. It shows the development of the post-flare coronal loops, with the animation also showing the ejection of some material (CME). The lower right imagery is from the AIA 094 filter, showing the Sun at a temperature of several million degrees, and thus showing the hottest portions of the solar flare. Note the colors are not real but artificially added to distinguish between the various wavelengths.
Review of solar activity
Solar flaring activity was low, except on 8 and 10 July when it reached moderate levels. An M2 from NOAA Active Region (AR) 3053 at 8 July 20:49 UT and an M1 from NOAA AR 3056 at 23:43 10 July, was measured. Among the C-class events, the most notable was a C8.5 emitted on 9 July 13:48 UT from NOAA plage region 3047.
Two Coronal Mass Ejections (CME) were estimated to be geo-effective. The first one was associated with the C9.8 flare on 5 July 04:07 UT. The second was associated with the M2.5 flare on 8 Jul 20:49 UT.
A group of two Coronal Holes (CH) with positive polarity crossed the solar central meridian on 9 July.
The greater than 10 MeV proton flux was at nominal levels over the past week. There was a sudden increase of the proton flux on 9 July 16:00 UT, caused by the C8.5 flare from NOAA plage region 3047 at 13:48 UT. This increase, however, did not exceed the 10 pfu limit. The greater than 2 MeV electron flux remained below the 1000 pfu alert threshold.
Review of geomagnetic activity
Two short-lived disruptions were registered by Solar Wind (SW) measurement instruments. The first one arrived on 4 July. It was possibly a High Speed Stream (HSS) originating from the Coronal Hole (CH) that crossed the central meridian on 2 July, but it had an uncharacteristically low speed (peak at 500 km/s). The second disturbance in the SW was caused by a Coronal Mass Ejection (CME) that arrived on 7 July. Although it was short-lived (it lasted 1.5 days) and relatively tenuous (80 particles/cm3), the first part of the passing structure had a strong negative North-South (Bz) component (-20 nT).
The geomagnetic conditions were affected by both the SW disturbances. The HSS induced a minor storm on the planetary level. The arrival of the CME on 7 July, triggered a minor storm both globally and locally (Kp and K Dourbes 5).
PROBA2 Observations (4 Jul 2022 - 10 Jul 2022)
Solar Activity
Solar flare activity fluctuated from low to moderate during the week.
In order to view the activity of this week in more detail, we suggest to go to the following website from which all the daily (normal and difference) movies can be accessed: https://proba2.oma.be/ssa
This page also lists the recorded flaring events.
A weekly overview movie (SWAP week 641) can be found here: https://proba2.sidc.be/swap/data/mpg/movies/weekly_movies/weekly_movie_2022_07_04.mp4.
Details about some of this week's events can be found further below.
If any of the linked movies are unavailable they can be found in the P2SC movie repository here: https://proba2.oma.be/swap/data/mpg/movies/.
Friday July 08
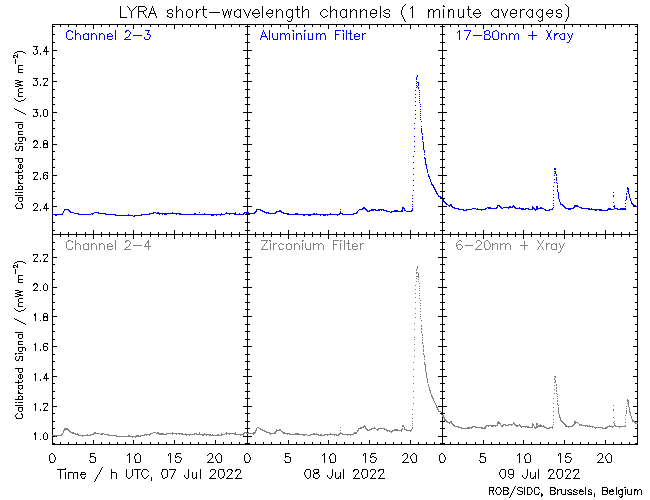
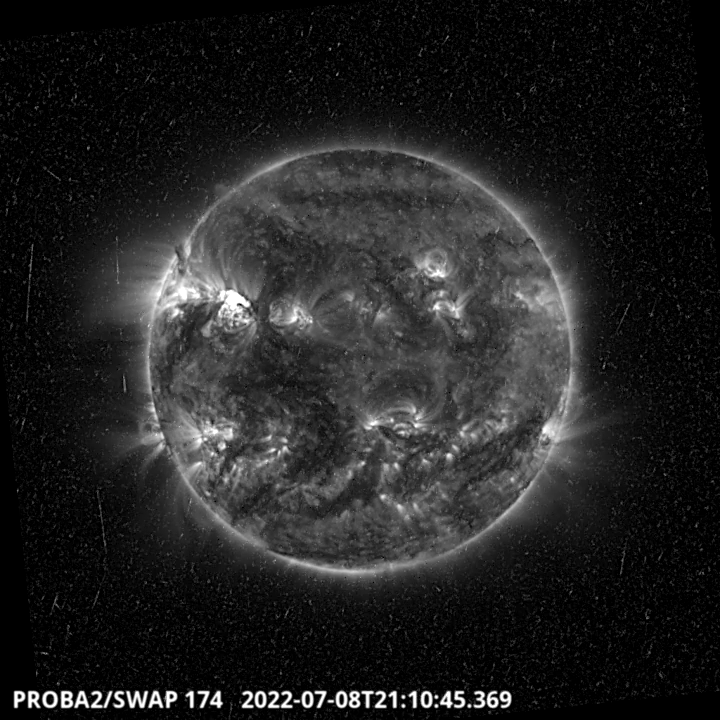
The largest flare of the week, an M2.5 flare, was observed by SWAP and LYRA. The flare was associated with NOAA AR3053 and is visible in the north-eastern quadrant on 2022-Jul-08, as shown in the SWAP image above taken at 21:10 UT. The energetic particles interacting with the detector can also be seen in the SWAP figure.
Find a SWAP movie of the event here: https://proba2.sidc.be/swap/movies/20220708_swap_movie.mp4.
The International Sunspot Number by SILSO
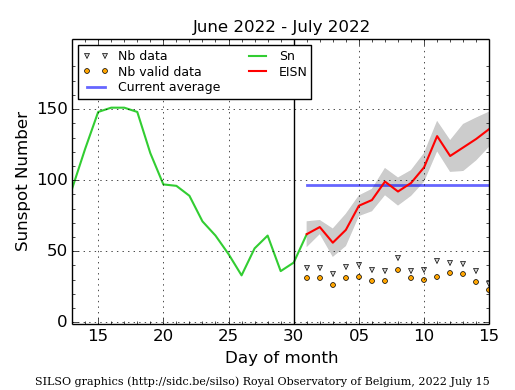
The daily Estimated International Sunspot Number (EISN, red curve with shaded error) derived by a simplified method from real-time data from the worldwide SILSO network. It extends the official Sunspot Number from the full processing of the preceding month (green line), a few days more than one solar rotation. The horizontal blue line shows the current monthly average. The yellow dots give the number of stations that provided valid data. Valid data are used to calculate the EISN. The triangle gives the number of stations providing data. When a triangle and a yellow dot coincide, it means that all the data is used to calculate the EISN of that day.
Noticeable Solar Events (4 Jul 2022 - 10 Jul 2022)
| DAY | BEGIN | MAX | END | LOC | XRAY | OP | 10CM | TYPE | Cat | NOAA |
| 08 | 2007 | 2049 | 2128 | M2.5 | 230 | III/2 | 72 | 3053 | ||
| 10 | 2330 | 2343 | 2352 | M1.3 | 3056 |
| LOC: approximate heliographic location | TYPE: radio burst type |
| XRAY: X-ray flare class | Cat: Catania sunspot group number |
| OP: optical flare class | NOAA: NOAA active region number |
| 10CM: peak 10 cm radio flux |
Geomagnetic Observations at Dourbes (4 Jul 2022 - 10 Jul 2022)

The SIDC space weather briefing
The Space Weather Briefing presented by the SIDC (https://www.sidc.be) forecaster on duty from July 3 to 10.
It reflects in images and graphs what is written in the Solar and Geomagnetic Activity report: https://www.stce.be/briefings/20220711_SWbriefing.pdf
Action!
Check out our activity calendar: activities and encounters with the Sun-Space-Earth system and Space Weather as the main theme. We provide occasions to get submerged in our world through educational, informative and instructive activities.
If you want your event in our calendar, contact us: stce_coordination at stce.be
* August 25, Public Lecture on Space Weather and Aviation, Astropolis, Oostende, Belgium
* September 24-25 Space Pole Open Days, Brussels, Belgium
* October 24-28, 18th European Space Weather Week, Zagreb, Croatia
* November 21-23, Space Weather Introductory Course - onsite, by the STCE, Brussels, Belgium
* December 5, 6, 8, 9, Space Weather Introductory Course - online, by the STCE, zoom
Check: https://www.stce.be/calendar