- Table of Content
- 1.SWx and AI
- 2.Review of sola...
- 3.Review of geom...
- 4.The Internatio...
- 5.PROBA2 Observa...
- 6.Noticeable Sol...
- 7.Geomagnetic Ob...
- 8.The SIDC Space...
- 9.What to do and...
2. Review of solar activity
3. Review of geomagnetic activity
4. The International Sunspot Index by SILSOal
5. PROBA2 Observations (12 Dec 2022 - 18 Dec 2022)
6. Noticeable Solar Events (12 Dec 2022 - 18 Dec 2022)
7. Geomagnetic Observations in Belgium (12 Dec 2022 - 18 Dec 2022)
8. The SIDC Space Weather Briefing
9. What to do and where to go
SWx and AI
This arty picture is the result that Sander vd Groenendaal got when he released AI on the words 'Space Weather', 'Aurora', 'Coronal Mass Ejection', '4K', 'realistic'.
Happy Holidays!
Review of solar activity
flares
Solar flaring activity was at low levels for most of the week, increasing to moderate levels from December 14 to 16. On these days a total of 29 M-class flares were detected. The majority of the flaring activity originated from Catania group 17 (NOAA AR 3165) which showed a complex magnetic field topology (beta-delta) and as this region rotated of the West solar limb on Saturday 17 December, the solar flaring activity decreased. The strongest flare of the week was an M6.3-class flare, which peaked at 14:42UTC on Dec 14, observed on the South-Western limb and associated with Catania group 17 (AR 3165). During the week, there where thirteen other active regions observed on the visible side of the Sun. These regions had simple configurations of the photospheric magnetic field and they sourced mostly C-class flares and some low M-class flares.
Solar Wind Disturbances: Coronal Mass Ejections
No Earth directed CMEs were detected in the available coronagraph imagery.
Solar Wind Disturbances: Coronal Holes
The negative polarity coronal hole in the southern hemisphere crossed the central meridian on Dec 14. Furthermore, an equatorial coronal hole with positive polarity crossed the central meridian on Dec 17.
Energetic particles near Earth
The greater than 10 MeV proton flux was at background levels. The greater than 2 MeV electron flux was also at background levels. The 24h electron fluence was at background levels.
Review of geomagnetic activity
Solar Wind at L1
In the beginning of the week the solar wind parameters reflected the waning influence of a high-speed stream. The solar wind speed was gradually decreasing from values of about 480 km/s to values of about 300-350 km/s. During the rest of the week the Earth was inside the slow solar wind. The interplanetary magnetic field was about 4-7nT during the whole week.
Geomagnetic conditions
Geomagnetic conditions were at quiet to unsettled levels on Dec 11, as a result of the influence of the high speed stream that arrived the week before. During the rest of the week, the geomagnetic conditions were at quiet levels.
The International Sunspot Index by SILSOal
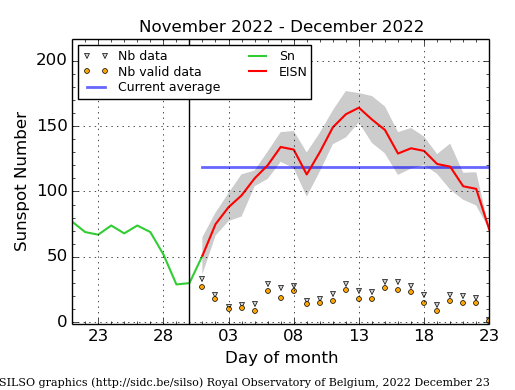
The daily Estimated International Sunspot Number (EISN, red curve with shaded error) derived by a simplified method from real-time data from the worldwide SILSO network. It extends the official Sunspot Number from the full processing of the preceding month (green line), a few days more than one solar rotation. The horizontal blue line shows the current monthly average. The yellow dots give the number of stations that provided valid data. Valid data are used to calculate the EISN. The triangle gives the number of stations providing data. When a triangle and a yellow dot coincide, it means that all the data is used to calculate the EISN of that day.
PROBA2 Observations (12 Dec 2022 - 18 Dec 2022)
Solar Activity
Solar flare activity fluctuated from low to moderate during the week.
In order to view the activity of this week in more detail, we suggest to go to the following website from which all the daily (normal and difference) movies can be accessed: https://proba2.oma.be/ssa
This page also lists the recorded flaring events.
A weekly overview movie can be found here (SWAP week 664). https://proba2.sidc.be/swap/data/mpg/movies/weekly_movies/weekly_movie_2022_12_12.mp4
Details about some of this week's events can be found further below.
If any of the linked movies are unavailable they can be found in the P2SC movie repository here https://proba2.sidc.be/swap/data/mpg/movies/
Wednesday Dec 14
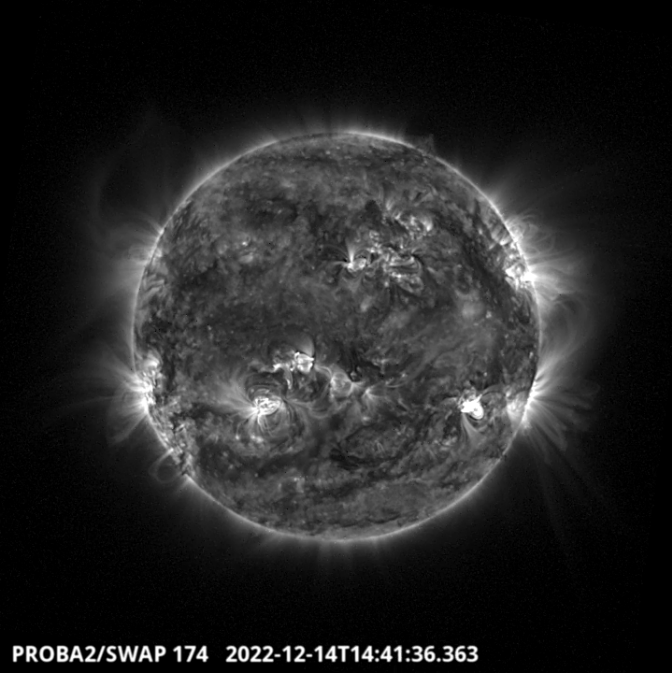
Numerous M flares have been observed on Dec 14 and the next two days. The largest flare of this series is a M6.3 produced by the NOAA active region 3165 on the South Western Hemisphere around 14:42 UT - SWAP image. Find a movie of the events here (SWAP movie) https://proba2.sidc.be/swap/data/mpg/movies/20221214_swap_movie.mp4
Noticeable Solar Events (12 Dec 2022 - 18 Dec 2022)
| DAY | BEGIN | MAX | END | LOC | XRAY | OP | 10CM | TYPE | Cat | NOAA |
| 14 | 0730 | 0740 | 0747 | M2.4 | I/1 | 3165 | ||||
| 14 | 0824 | 0831 | 0837 | M1.1 | F | I/2I/2 7 | 3153 | |||
| 14 | 0920 | 0927 | 0935 | M1.3 | 3165 | |||||
| 14 | 1145 | 1159 | 1217 | M1.1 | 3165 | |||||
| 14 | 1224 | 1231 | 1238 | M4.1 | II/1 | 3165 | ||||
| 14 | 1431 | 1442 | 1449 | M6.3 | B | 3165 | ||||
| 14 | 1454 | 1459 | 1504 | M3.2 | 3165 | |||||
| 14 | 1703 | 1712 | 1723 | M2.2 | 3165 | |||||
| 14 | 2052 | 2058 | 2102 | M2.2 | F | 3165 | ||||
| 14 | 2133 | 2139 | 2145 | M1.3 | F | 3165 | ||||
| 14 | 2145 | 2153 | 2157 | M1.9 | F | 3165 | ||||
| 14 | 2157 | 2206 | 2217 | M4.5 | F | 3165 | ||||
| 15 | 0124 | 0137 | 0149 | M1.6 | F | 17 | 3165 | |||
| 15 | 0655 | 0707 | 0722 | M2.3 | 17 | 3165 | ||||
| 15 | 0754 | 0758 | 0802 | M1.0 | TM/2 | 17 | 3165 | |||
| 15 | 1023 | 1030 | 1037 | M1.6 | 17 | 3165 | ||||
| 15 | 1558 | 1610 | 1619 | M1.0 | ||||||
| 15 | 1635 | 1644 | 1647 | M1.1 | 17 | 3165 | ||||
| 15 | 1647 | 1656 | 1712 | M2.0 | 17 | 3165 | ||||
| 15 | 2220 | 2240 | 2257 | M5.7 | 17 | 3165 | ||||
| 16 | 0130 | 0201 | 0230 | M3.5 | II/1 | 17 | 3165 | |||
| 16 | 0630 | 0642 | 0654 | M1.2 | F | TM/2 | 17 | 3165 | ||
| 16 | 0726 | 0738 | 0747 | M1.6 | ||||||
| 16 | 0855 | 0905 | 0911 | S20W39 | M1.5 | SF | 17 | 3165 | ||
| 16 | 0933 | 0943 | 0950 | S22W1 | M1.1 | SF | 21 | 3163 | ||
| 16 | 1002 | 1019 | 1034 | M4.0 | ||||||
| 16 | 1424 | 1440 | 1504 | M2.4 | 17 | 3165 | ||||
| 16 | 1534 | 1540 | 1545 | M1.2 | 17 | 3165 | ||||
| 17 | 1940 | 1953 | 2001 | N19E72 | M1.0 | 1N | III/2 | 3169 |
| LOC: approximate heliographic location | TYPE: radio burst type |
| XRAY: X-ray flare class | Cat: Catania sunspot group number |
| OP: optical flare class | NOAA: NOAA active region number |
| 10CM: peak 10 cm radio flux |
Geomagnetic Observations in Belgium (12 Dec 2022 - 18 Dec 2022)
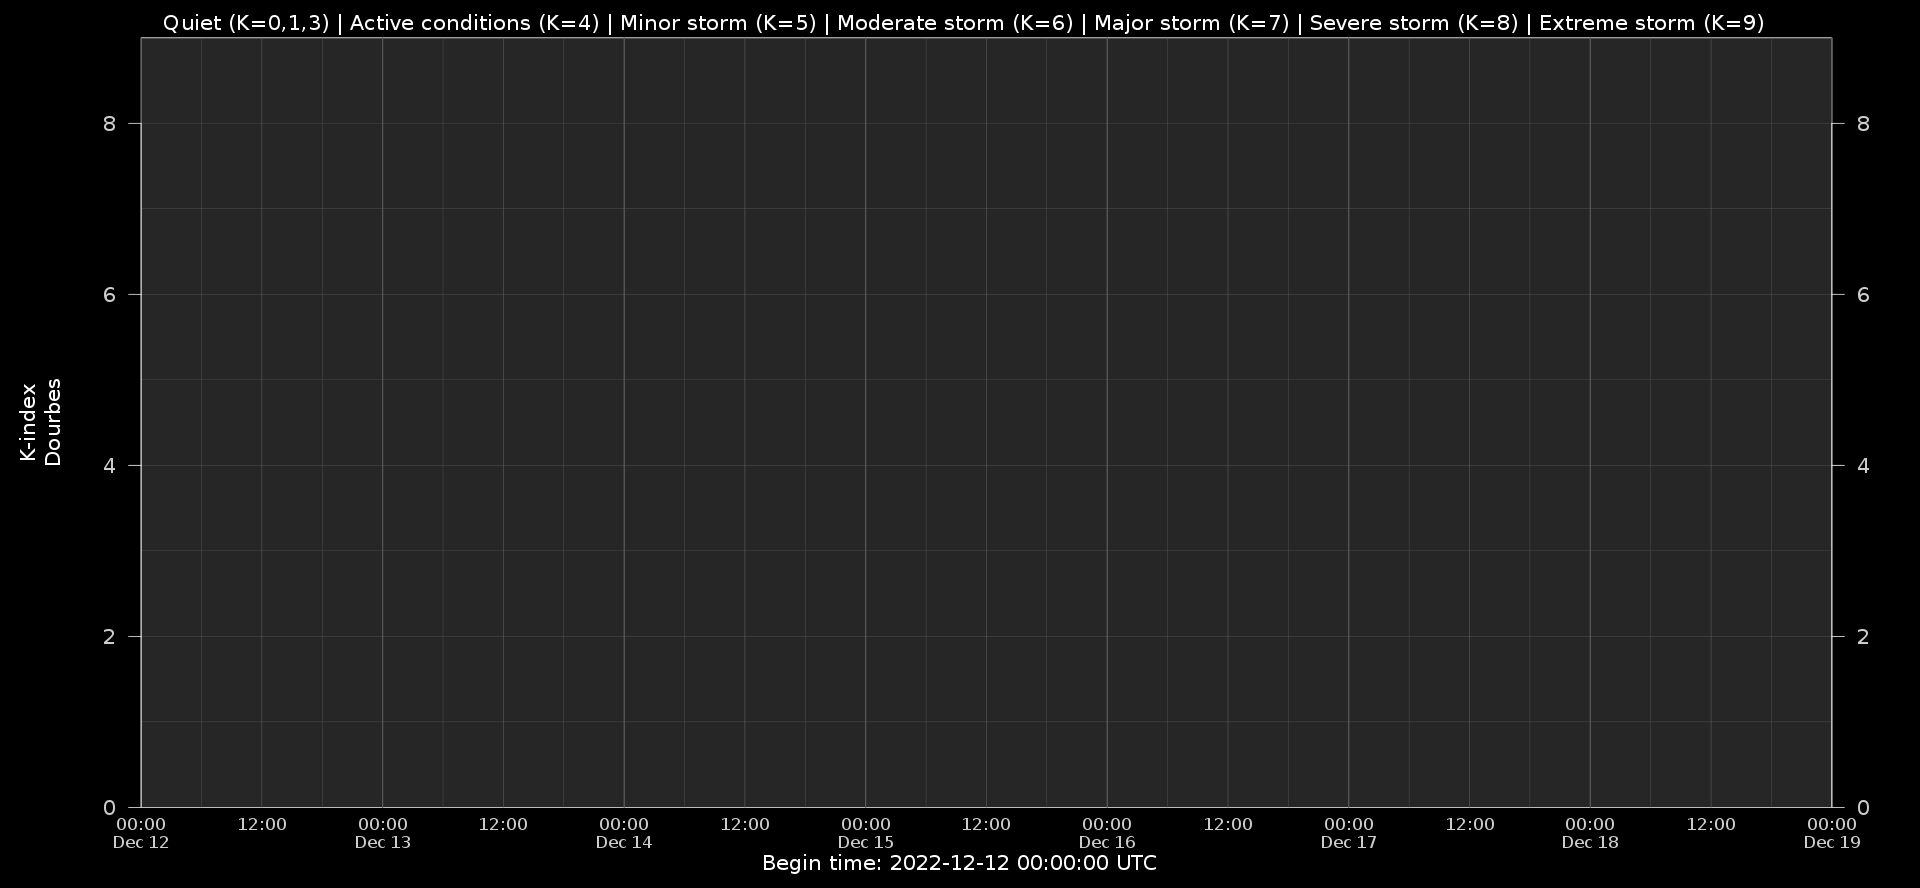
Local K-type magnetic activity index for Belgium based on data from Dourbes (DOU) and Manhay (MAB). Comparing the data from both measurement stations allows to reliably remove outliers from the magnetic data. At the same time the operational service availability is improved: whenever data from one observatory is not available, the single-station index obtained from the other can be used as a fallback system.
Both the two-station index and the single station indices are available here: http://ionosphere.meteo.be/geomagnetism/K_BEL/
The SIDC Space Weather Briefing
The Space Weather Briefing presented by the forecaster on duty from Dec 11 to 17. It reflects in images and graphs what is written in the Solar and Geomagnetic Activity report: https://www.stce.be/briefings/20221219_SWbriefing.pdf
If you need to access the movies, contact us: stce_coordination at stce.be
What to do and where to go
Check out our activity calendar: activities and encounters with the Sun-Space-Earth system and Space Weather as the main theme. We provide occasions to get submerged in our world through educational, informative and instructive activities.
If you want your event in our calendar, contact us: stce_coordination at stce.be
* January 27, POSTPONED Seminar: Opportunities of Wikipedia and related applications for science, BIRA-IASB
* January 30, 31, February 2, 3, Space Weather Introductory Course - online, by the STCE, zoom
* March 27-29, Space Weather Introductory Course - onsite, by the STCE, Brussels, Belgium
* May 22-24, Space Weather Introductory Course - onsite, by the STCE, Brussels, Belgium
Check: https://www.stce.be/calendar