- Table of Content
- 1.One active reg...
- 2.PROBA2 Observa...
- 3.The Internatio...
- 4.Noticeable Sol...
- 5.Geomagnetic Ob...
- 6.Review of iono...
- 7.Review of sola...
- 8.Review of geom...
- 9.The SIDC Space...
- 10.Calendar
2. PROBA2 Observations (20 Feb 2023 - 26 Feb 2023)
3. The International Sunspot Index by SILSO
4. Noticeable Solar Events (20 Feb 2023 - 26 Feb 2023)
5. Geomagnetic Observations in Belgium (20 Feb 2023 - 26 Feb 2023)
6. Review of ionospheric activity (20 Feb 2023 - 26 Feb 2023)
7. Review of solar activity
8. Review of geomagnetic activity
9. The SIDC Space Weather Briefing
10. Calendar
One active region, 2 M-class flares
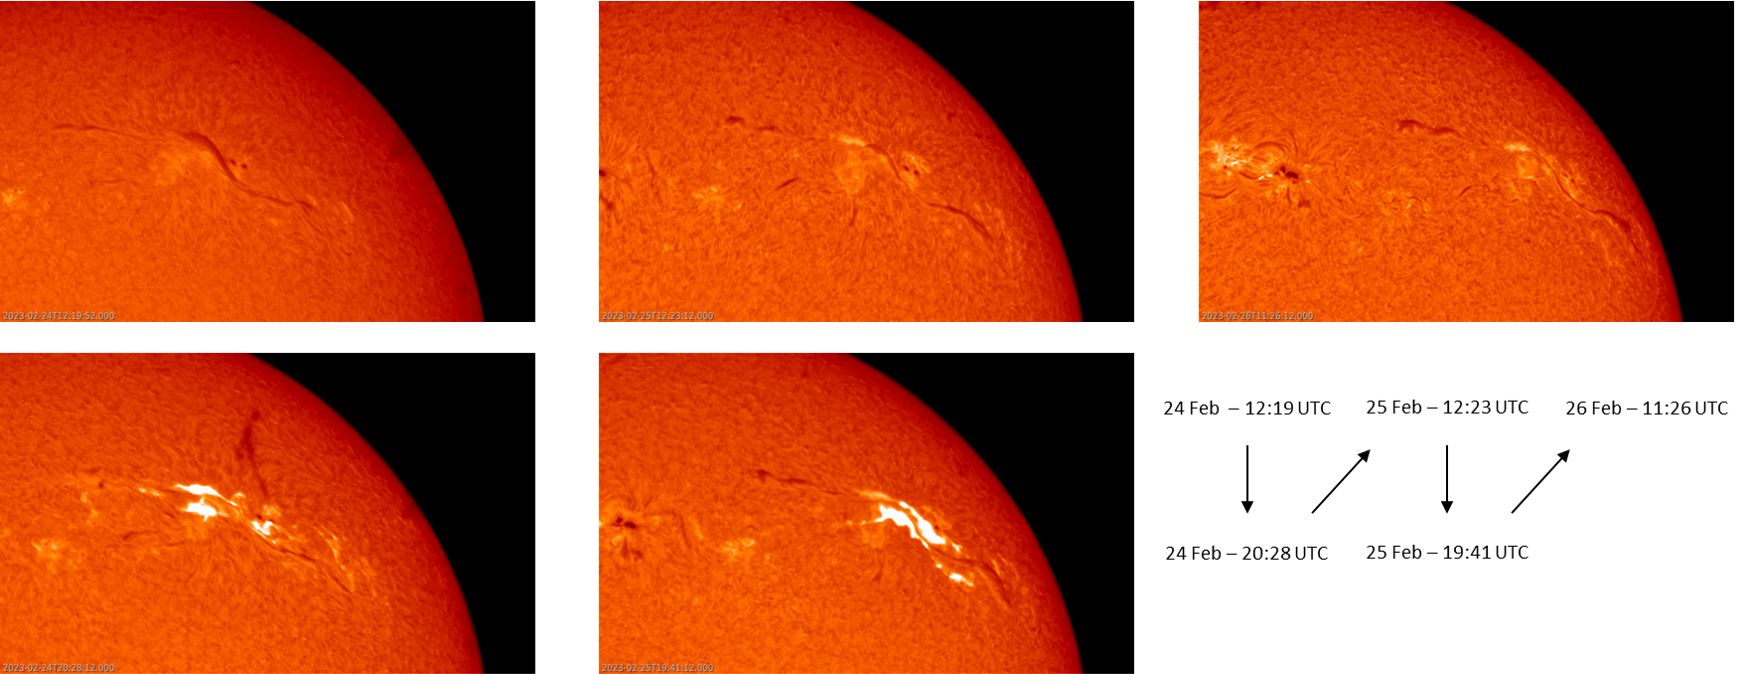
Sunspot group NOAA 13229, source of an X-class event on 17 February (see last week's STCE newsitem at https://www.stce.be/news/630/welcome.html ), was decaying when it produced an M3.7 and an M6.3 flare (GOES soft x-ray - https://www.swpc.noaa.gov/products/goes-x-ray-flux ) on respectively 24 and 25 February. The imagery underneath was obtained with the H-alpha network from GONG (https://gong.nso.edu/ ) showing the presence of a long filament with the middle portion intersecting active region (AR) 13229 north to south. Only a few sunspots were remaining, the two largest can be seen to the west (right) of the filament. The H-alpha compilation shows the area around noon on 24, 25 and 26 February (top row) and during the eruption 6 to 8 hours later on the first 2 days (bottom row). In both events, it is clear that it is always the middle portion of the filament that erupts, but also that it re-establishes itself each time after the eruption. The optical class for the flares was respectively 2B and 3N, meaning that in H-alpha the M6 flare ribbons had a larger area (as is evident in the imagery), but also a bit less intense (N is for "Normal" intensity, and B is for "Bright" - see the STCE SWx classification page at https://www.stce.be/educational/classification#optical ) than the flare ribbons associated with the M3 flare. Clips and more imagery are available in the online version of this newsitem at https://www.stce.be/news/631/welcome.html
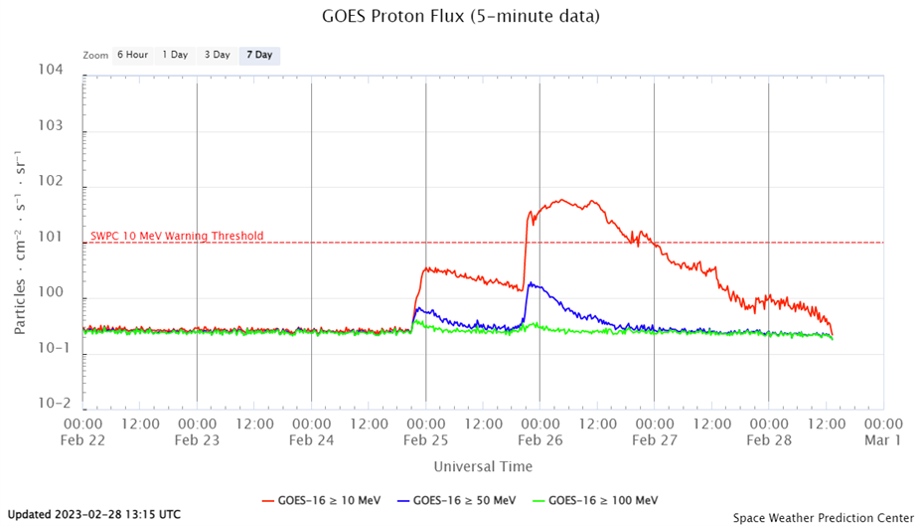
The M3 flare was associated with a mild enhancement of the greater than 10 MeV proton flux, reaching 3 pfu on 25 February at 00:45 UTC. The M6 flare was associated with a genuine proton event, starting on 25 February at 21:10 UTC and reaching a peak of 58 pfu on 26 February at 04:40 UTC (see the graph underneath). This was the first proton event of 2023, and the strongest so far this solar cycle. These protons get deflected by the Earth's magnetic field towards the poles, where they can degrade High Frequency (HF) communications, also known as Polar Cap Absorption (PCA). For the 26 February proton event, PECASUS (https://pecasus.eu/ ) issued HF COM advisories to the international civil aviation (ICAO - https://www.icao.int ). The flux of the more energetic protons (100 MeV or more) barely showed an increase and remained at background levels. As a result, no ground level enhancement (GLE) was observed. Note that a weaker proton event (29 pfu) on 29 October 2021 was associated with a significant increase in the 100 MeV proton flux, thus resulting in a weak GLE, the only one so far in SC25 (see the STCE newsflash at https://www.stce.be/news/558/welcome.html).
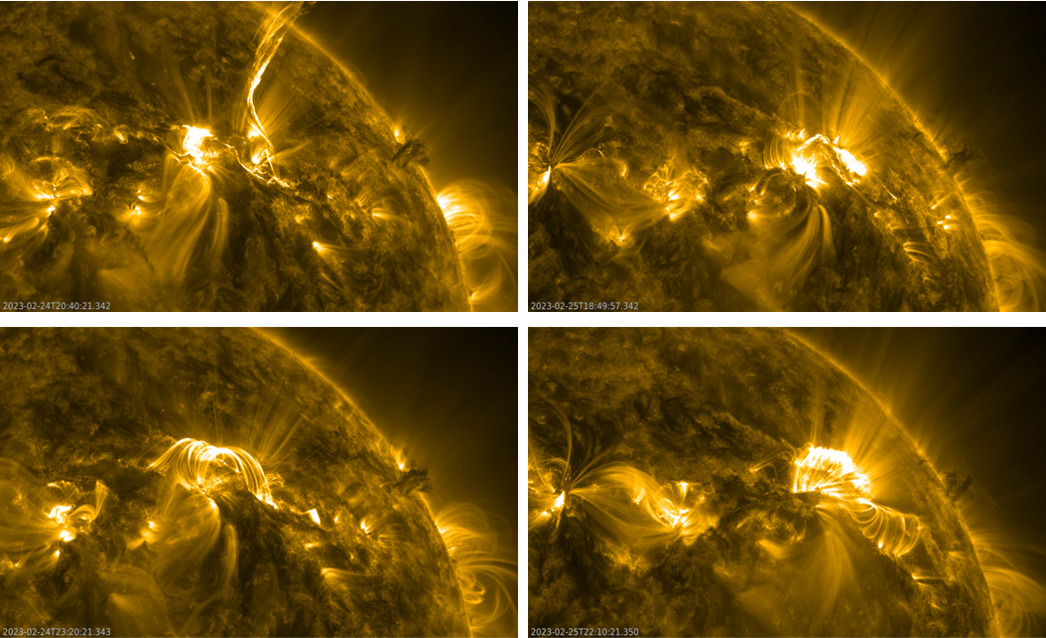
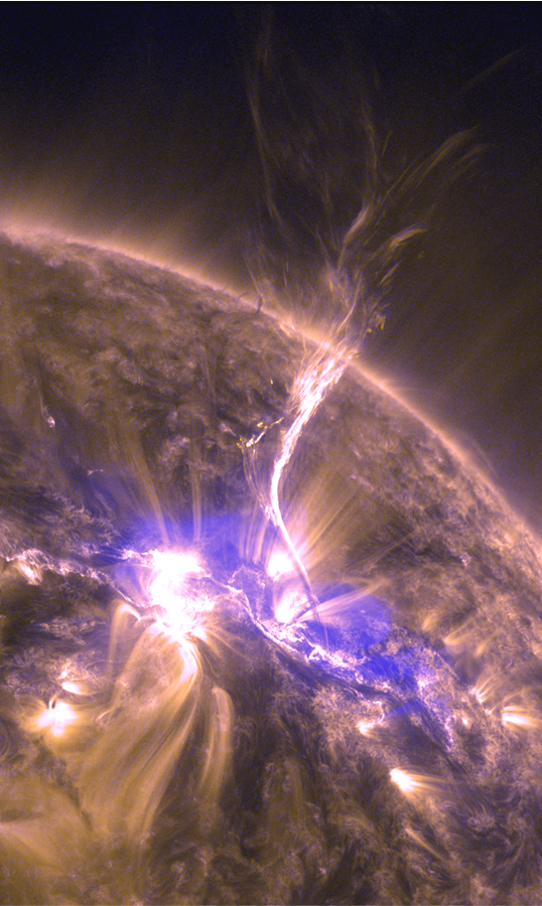
Both flares peaked in the evening, resp. at 20:30 UTC and 19:44 UTC, and were also long duration events (LDE) lasting resp. 86 and 107 minutes. HF communications may have been disturbed mainly over the Pacific, Central-America, and the western portion of South-America. In extreme ultraviolet (EUV) SDO/AIA 171 imagery underneath (http://sdo.gsfc.nasa.gov/data/aiahmi/ ), showing the solar atmosphere at temperatures around 700.000 degrees, the filament can clearly be seen ejected resp. towards the north and the west (upper row), with the arcade (series of post-eruption coronal loops) clearly much longer following the M6 flare (lower row). In the online version, the main clip spans 48 hours at a cadence of 10 minutes, with 2 smaller clips focusing on the eruption having a 1 minute cadence. From these images, it is clear that the first eruption is visually more impressive than the second one. Imagery of that first M-class eruption is underneath and combines AIA171 (yellowish) with AIA131 imagery, the latter allowing a better contrast between the cold (dark purple) and hot (sky blue) areas of the eruption.
Due to the timing of the flares, the daily solar radio flux as measured in Penticton (BC, Canada - https://www.spaceweather.gc.ca/forecast-prevision/solar-solaire/solarflux/sx-5-flux-en.php ) at 20 UTC was affected, in particular on 26 February when it reached a value of 279 sfu (https://www.stce.be/educational/acronym#S ), which was well above its usual daily values around 150-160 sfu. Both events were thus also Tenflares, being resp. 230 and 500 sfu above the pre-event values of the 10.7cm radio flux. Enhanced radio emissions were also observed at other wavelengths including GNSS. Radio observations of the two flaring events indicated they were both associated with Type II radio bursts (https://www.stce.be/educational/classification#radio ), thus indicating the eruptions were associated with a coronal mass ejection (CME). Coronagraphic observations by SOHO/LASCO (https://soho.nascom.nasa.gov/ ) indicated two fast halo CMEs with an earth-directed component. The LASCO C2 imagery underneath shows both CMEs, with an earlier CME directed to the northeast believed to be a farside event. Analysis of STEREO-A time-distance plots (https://stereo-ssc.nascom.nasa.gov/beacon/secchi_jplot.shtml ) gave projected (plane-of-the-sky) speeds of resp. 950 and 1150 km/s.
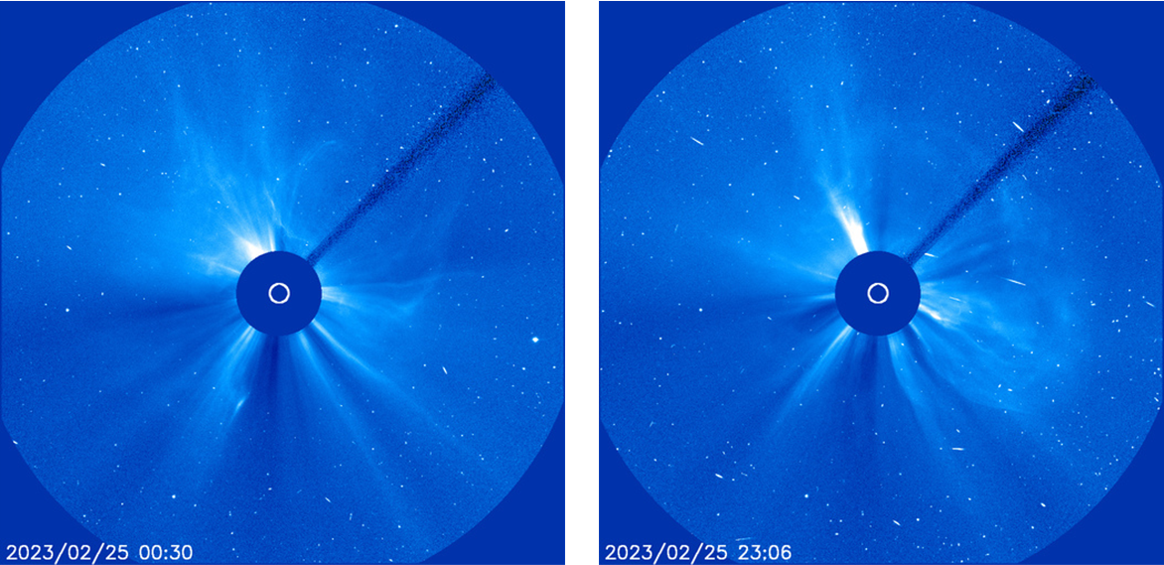
Space weather forecasters at the SIDC (https://www.sidc.be/ ) predicted the arrival of the CMEs resp. for late on 26 February and the evening of 27 February. These proved to be fairly accurate predictions. A shock in the solar wind speed from the first CME was observed on 26 February at 18:43 UTC with solar wind speed jumping from around 470 km/s to around 540 km/s. The arrival of the second CME was a bit less clear in part due to data problems with DSCOVR (https://www.swpc.noaa.gov/products/real-time-solar-wind ). The current consensus is that the second CME most likely arrived around 10:20 UTC on 27 February (marked again by an uptick in the magnetic field strength to 20 nT - see annotated image), and was quickly followed by the high speed stream of the coronal hole. Solar wind speed reached values near 840 km/s, the highest so far this solar cycle. It has been since the September 2017 solar activity that a passing CME was involved in such elevated near-Earth solar wind speeds.
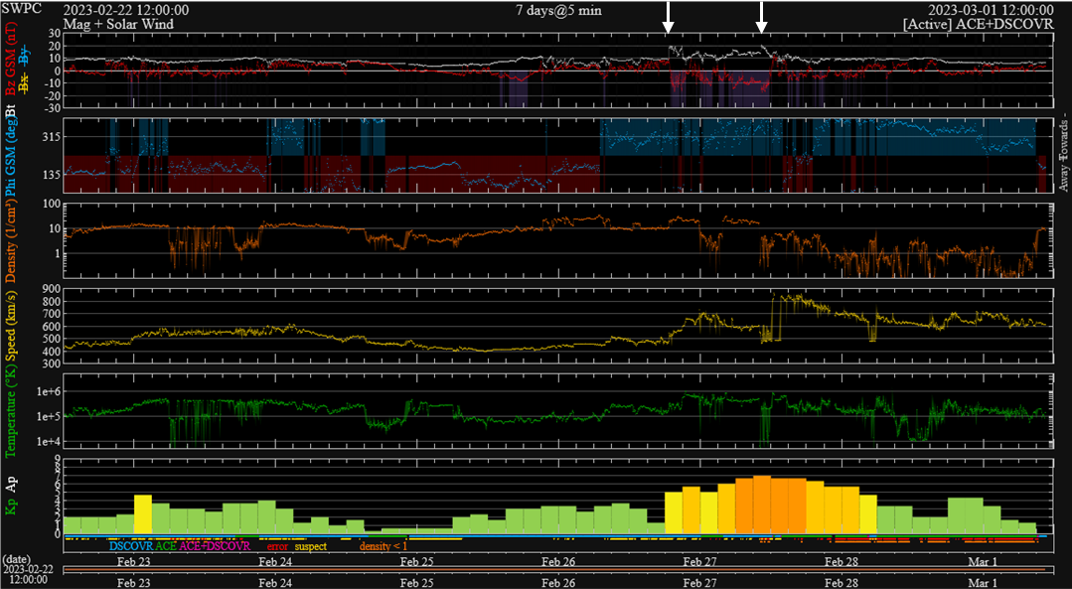
This one-two punch by the passing CMEs resulted in a strong geomagnetic storm with the preliminary planetary K index (Kp - https://www.swpc.noaa.gov/products/planetary-k-index ) reaching 7 (see the graph above) and the Disturbance storm-time index -138 nT (Dst - https://wdc.kugi.kyoto-u.ac.jp/dst_realtime/ ). Dst-wise, this is the strongest geomagnetic storm of the current solar cycle so far, dethroning the 4 November 2021 storm when Dst reached -105 nT. Compared to storms from the entire previous solar cycle, it would still rank quite high - See this STCE newsitem at https://www.stce.be/news/437/welcome.html for an overview of the strongest geomagnetic storms during SC24. An obvious result from all this geomagnetic activity were the polar lights, photographed as far south as Colorado and Missouri (USA), France, Belgium, Saxony (Germany), Slovakia and New Zealand - See the aurora page at https://www.spaceweather.com/ Many observers lauded the vivid red colours of these polar lights.
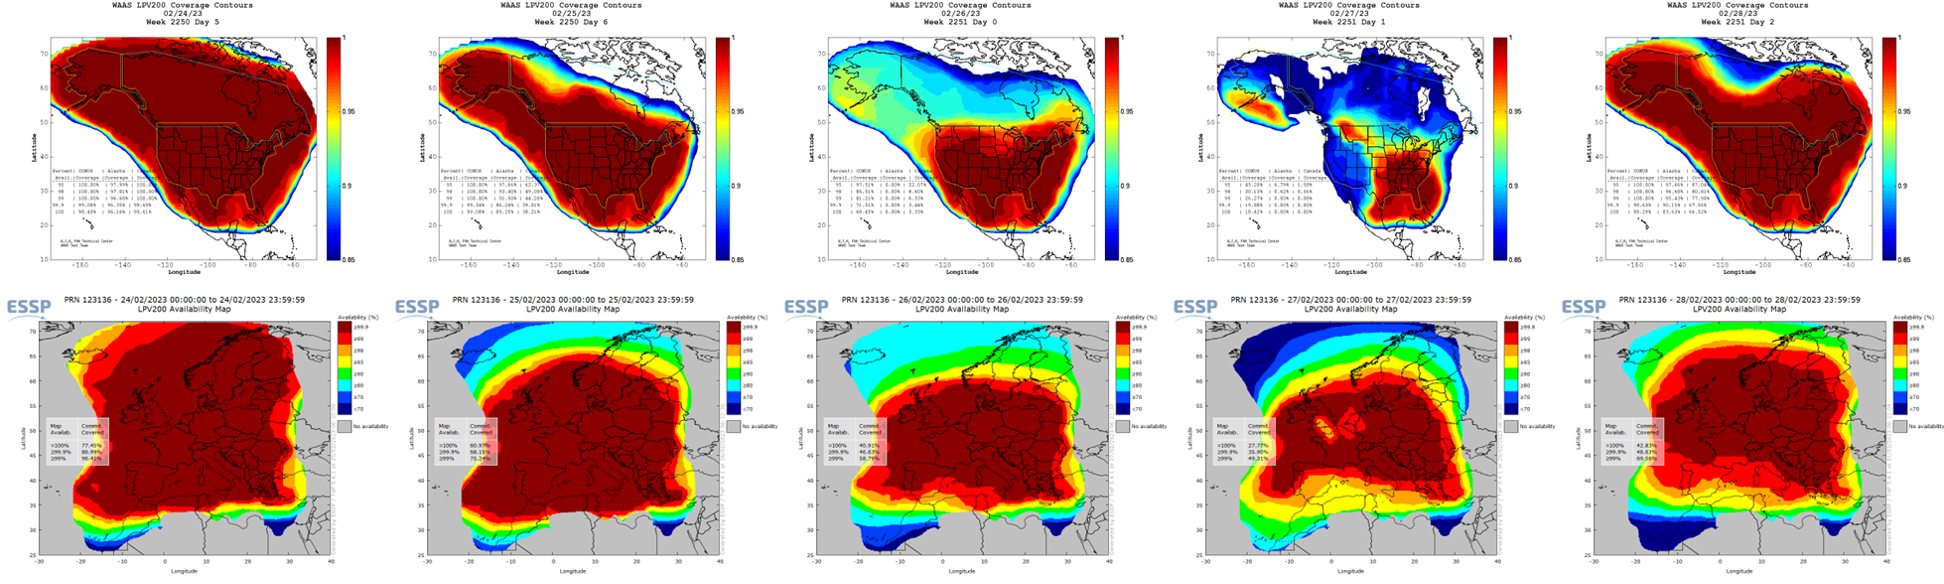
The GOES-18 satellite (https://www.swpc.noaa.gov/products/goes-magnetometer ) was briefly exposed to the solar wind during its dayside passage late on 26 February, as the strong first CME pushed the magnetopause, i.e. the border where the Earth's magnetic field strength equals that of the solar wind, just inside the geostationary orbit. There also seems to have been a small drag effect on the orbit of the International Space Station, which apparently has lost about 200 meters in altitude on 27 February. Note that in this case it concerned only a marginal effect, certainly when compared to e.g. the Bastille Day storm in July 2000 when the space station lost more than 10 km in a single day! More important was the ionosphere that got quite disturbed due to the geomagnetic storm. As a result, some GNSS-based applications for the civil aviation did not reach their typical availability, as can be gauged from the maps underneath for the USA/Canada (WAAS - https://www.nstb.tc.faa.gov/index.htm ) and Europe (EGNOS - https://egnos-user-support.essp-sas.eu/ ), covering the period 24-28 February. Reb/brown colours mean good availability, blue means significantly degraded availability. Clearly the systems were underperforming on 26 and especially 27 February. During the geomagnetically disturbed days, PECASUS (https://pecasus.eu/ ) issued advisories to the international civil aviation (ICAO - https://www.icao.int ) for degraded HF communications as well as for GNSS disturbances.
PROBA2 Observations (20 Feb 2023 - 26 Feb 2023)
Solar Activity
Solar flare activity fluctuated from low to moderate during the week.
In order to view the activity of this week in more detail, we suggest to go to the following website from which all the daily (normal and difference) movies can be accessed: https://proba2.oma.be/ssa
This page also lists the recorded flaring events.
A weekly overview movie (SWAP week 674) can be found here: https://proba2.sidc.be/swap/data/mpg/movies/weekly_movies/weekly_movie_2023_02_20.mp4.
Details about some of this week's events can be found further below.
If any of the linked movies are unavailable they can be found in the P2SC movie repository here: https://proba2.oma.be/swap/data/mpg/movies/.
Saturday February 25
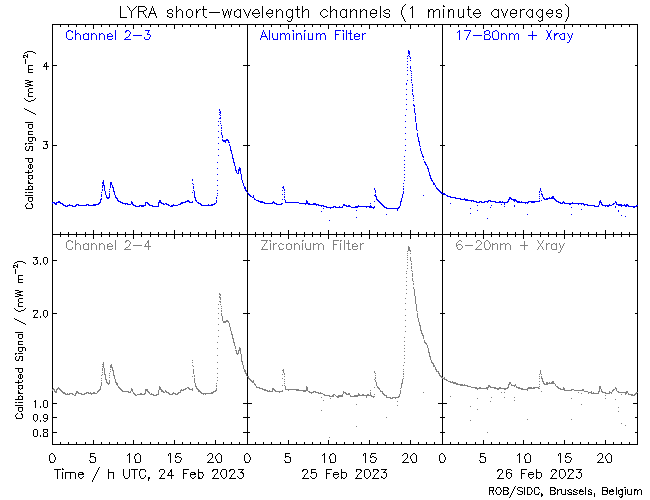
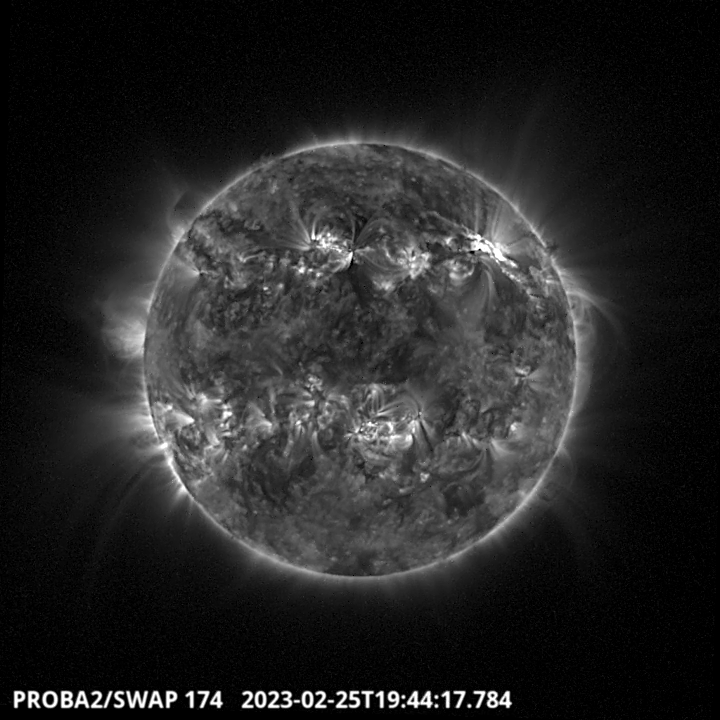
The largest flare of the week, an M6.3 flare, was observed by LYRA (top panel) and SWAP (bottom panel). The flare occurred on 2023-Feb-25 (peak at 19:44 UT) on the north-western hemisphere, and it was associated with NOAA AR3229.
Find a SWAP movie of the event here: https://proba2.sidc.be/swap/movies/20230225_swap_movie.mp4.
The International Sunspot Index by SILSO
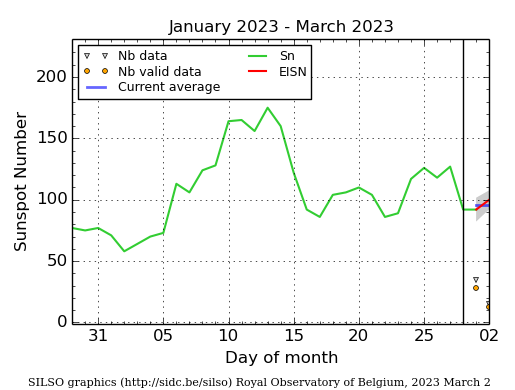
The daily Estimated International Sunspot Number (EISN, red curve with shaded error) derived by a simplified method from real-time data from the worldwide SILSO network. It extends the official Sunspot Number from the full processing of the preceding month (green line), a few days more than one solar rotation. The horizontal blue line shows the current monthly average. The yellow dots give the number of stations that provided valid data. Valid data are used to calculate the EISN. The triangle gives the number of stations providing data. When a triangle and a yellow dot coincide, it means that all the data is used to calculate the EISN of that day.
Noticeable Solar Events (20 Feb 2023 - 26 Feb 2023)
| DAY | BEGIN | MAX | END | LOC | XRAY | OP | 10CM | TYPE | Cat | NOAA |
| 20 | 1447 | 1458 | 1503 | N25E75 | M4.4 | SF | III/1 | 3234 | ||
| 21 | 1114 | 1123 | 1131 | N14W70 | M4.7 | SF | VI/2 | 94 | 3234 | |
| 21 | 1957 | 2017 | 2030 | M5.0 | 32 | III/2II/2 | 94 | 3234 | ||
| 22 | 0451 | 0512 | 0540 | M1.4 | 120 | 94 | 3234 | |||
| 22 | 1336 | 1350 | 1358 | N27E57 | M2.6 | SF | 94 | 3234 | ||
| 23 | 0611 | 0614 | 0618 | M1.5 | 3235 | |||||
| 23 | 0832 | 0848 | 0851 | M1.0 | VI/1 | 94 | 3234 | |||
| 24 | 1711 | 1715 | 1720 | M1.1 | III/1 | 96 | 3235 | |||
| 24 | 2003 | 2030 | 2129 | N28W28 | M3.7 | 2B | IV/2 | 89 | 3229 | |
| 25 | 1534 | 1540 | 1546 | M1.0 | 97 | 3236 | ||||
| 25 | 1840 | 1944 | 2027 | N26W43 | M6.3 | 3N | VI/1 | 89 | 3229 |
| LOC: approximate heliographic location | TYPE: radio burst type |
| XRAY: X-ray flare class | Cat: Catania sunspot group number |
| OP: optical flare class | NOAA: NOAA active region number |
| 10CM: peak 10 cm radio flux |
Geomagnetic Observations in Belgium (20 Feb 2023 - 26 Feb 2023)
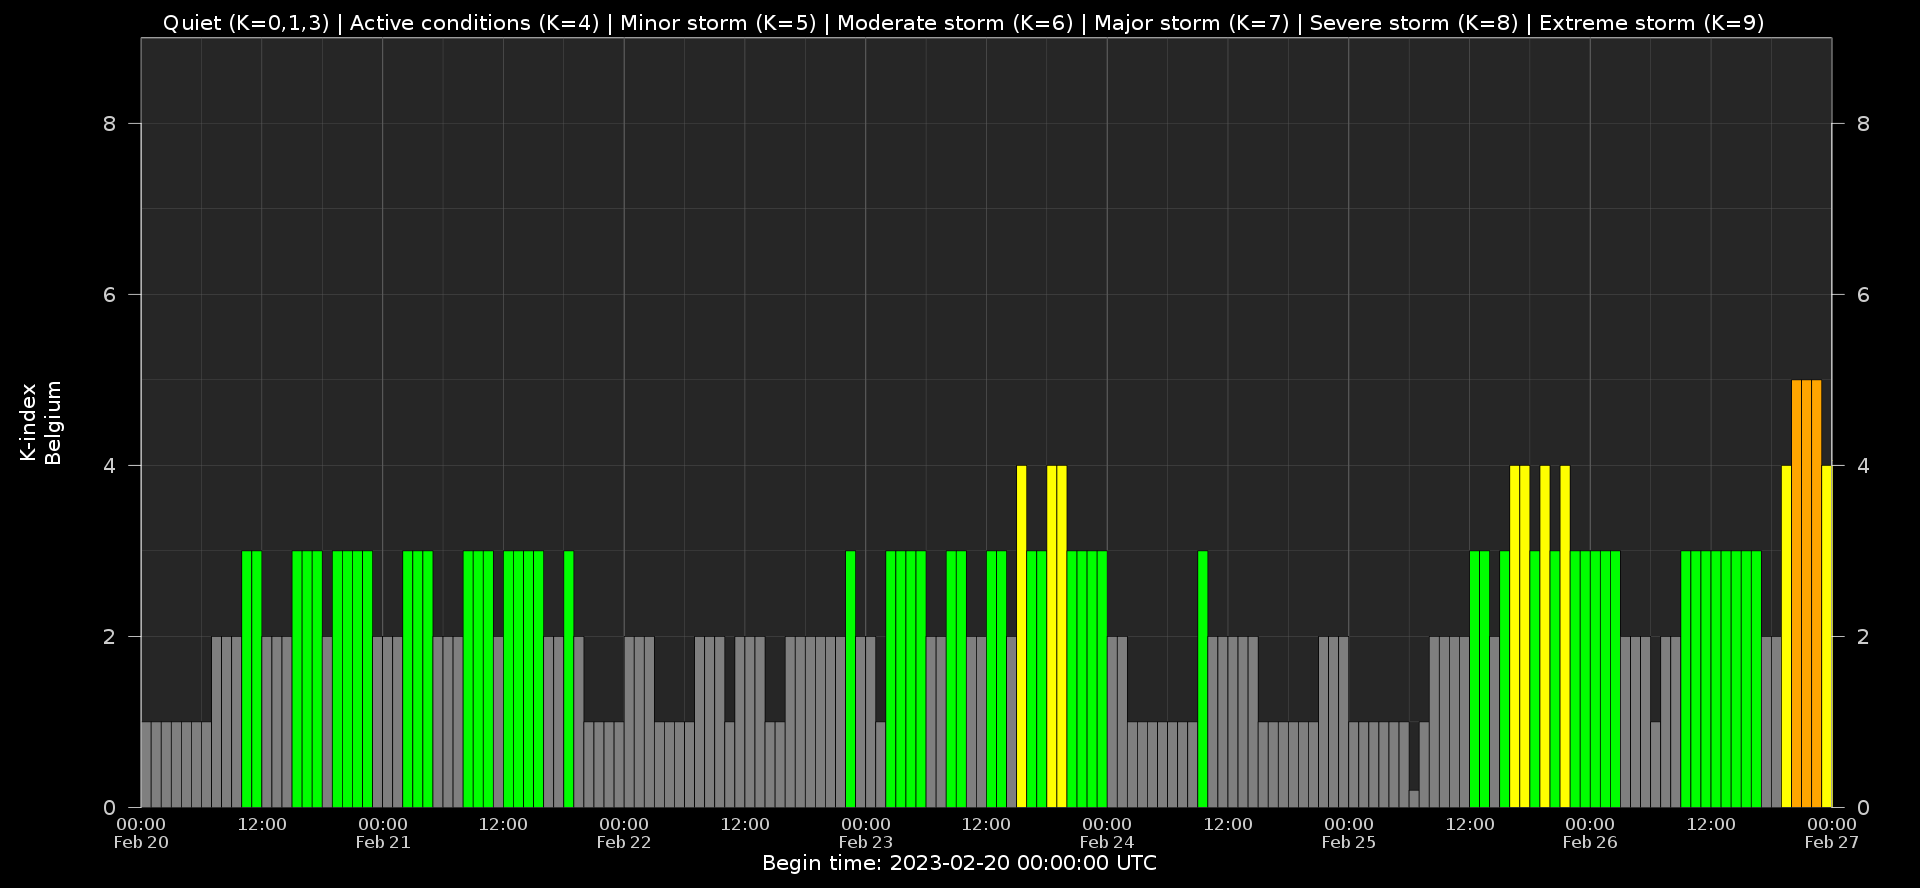
Local K-type magnetic activity index for Belgium based on data from Dourbes (DOU) and Manhay (MAB). Comparing the data from both measurement stations allows to reliably remove outliers from the magnetic data. At the same time the operational service availability is improved: whenever data from one observatory is not available, the single-station index obtained from the other can be used as a fallback system.
Both the two-station index and the single station indices are available here: http://ionosphere.meteo.be/geomagnetism/K_BEL/
Review of ionospheric activity (20 Feb 2023 - 26 Feb 2023)
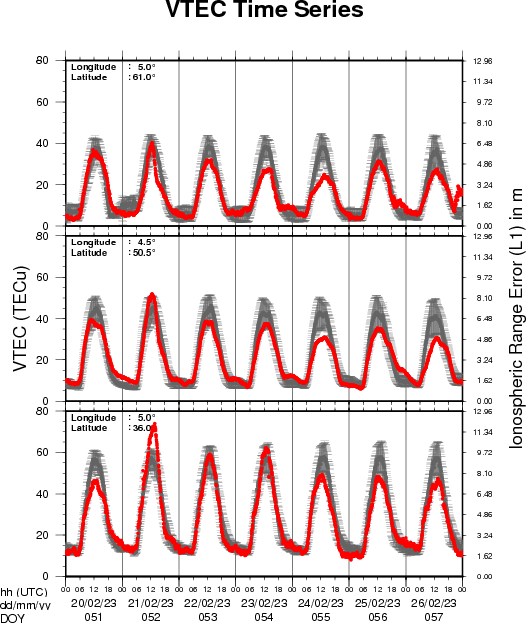
The figure shows the time evolution of the Vertical Total Electron Content (VTEC) (in red) during the last week at three locations:
a) in the northern part of Europe(N 61deg E 5deg)
b) above Brussels(N 50.5deg, E 4.5 deg)
c) in the southern part of Europe(N 36 deg, E 5deg)
This figure also shows (in grey) the normal ionospheric behaviour expected based on the median VTEC from the 15 previous days.
The VTEC is expressed in TECu (with TECu=10^16 electrons per square meter) and is directly related to the signal propagation delay due to the ionosphere (in figure: delay on GPS L1 frequency).
The Sun's radiation ionizes the Earth's upper atmosphere, the ionosphere, located from about 60km to 1000km above the Earth's surface.The ionization process in the ionosphere produces ions and free electrons. These electrons perturb the propagation of the GNSS (Global Navigation Satellite System) signals by inducing a so-called ionospheric delay.
See http://stce.be/newsletter/GNSS_final.pdf for some more explanations ; for detailed information, see http://gnss.be/ionosphere_tutorial.php
Review of solar activity
Flares
Solar activity reached high levels. The beginning of the week was dominated by NOAA active region 3234 which produced M flares on the majority of the days. It started flaring when still at the eastern limb and continued to produce M flares as it was transiting the eastern hemisphere. Meanwhile, at the start of the week NOAA active region 3226 (responsible for the X flare the week before) rotated off the disc without much notice and NOAA active region 3229, the most complex region on disc with beta-delta configuration of its photospheric field, rotated from the eastern to the western hemisphere, but was relatively inactive without any large flares. It was only in the second part of the week that NOAA active region 3229 first seemed to decay, but then produced an M3.7 flare on February 24 and an M6.3 flare on February 25. Several additional regions formed on disc but were of lesser importance.
Coronal Mass Ejections (CMEs)
Both M flares from NOAA active region 3229 were associated with filament eruptions and (partial) halo CME's.
The CME associated to the M3 flare was first visible in the C2 field of view starting 20:36UTC, February 24. The CME was mainly directed towards the northwest but has a full halo extent. Given the location of the source and the halo extent it was expected that the CME had an Earth directed component with modelling runs indicating an arrival late February 26.
Associated to the M6.3 flare, SoHO/LASCO coronagraph images show an asymmetric halo CME towards the west-northwest appearing in the C2 field of view at 19:36UTC February 25. The projected speed was around 1000km/s. Given the source location on disc and the halo extent in coronagraph images the CME was estimated to have an Earth directed component and model runs indicate an estimated arrival around 18:00UTC February 27. A number of other partial halo CMEs were observed in the week but were judged to be back sided or sufficiently off the Sun-Earth line.
Energetic particles in Geosynchronous orbit
The greater than 10 MeV proton flux was at nominal levels at the start of the week and got enhanced after the M3.7 flare though remaining below the 10 pfu event threshold. The 10 MeV proton flux then became further enhanced after the M6.3 flare, crossing the 10pfu event threshold around 21:10UTC February 25, remaining above the threshold for around 24 hours.
The greater than 2 MeV electron flux was below the 1000 pfu threshold throughout the week. The 24h electron fluence was at normal levels throughout the week.
Review of geomagnetic activity
Solar wind conditions
Solar wind was near the slow speed regime throughout the first part of the week. A shock was observed at 9:52UTC February 20 with the solar wind speed jumping from 370 km/s to 410 km/s and the total magnetic field jumping from 6nT to 14nT. This shock was most likely associated to the halo CME from 20:38UTC, February 17 following the X2 flare that peaked at 20:16UTC. As expected, not more than a glancing blow was observed with Solar wind parameters becoming only mildly perturbed.
On February 23-24 we saw the passage of a high speed stream reaching speeds just of up to 600 km/s. This may be associated to the positive polarity equatorial coronal hole reported earlier though this does not fit very well timing wise.
Then by late on February 26 we saw again an increase in Solar wind speed and at 18:43UTC a shock with solar wind speed jumping from 479km/s to 547km/s and the magnitude of the interplanetary field jumping from 9 to 19nT. This was marking the expected arrival of the CME that left the Sun on February 24. Solar wind speed increased to over 700 km/s.
Geomagnetic conditions
Geomagnetic conditions reached just active conditions both with the glancing blow of the February 17 CME (local K Belgium 3, NOAA Kp 4+) and with the high speed stream (local K Belgium 4, NOAA Kp 5-).
At the end of the week minor geomagnetic storm levels (local K Belgium 5, NOAA Kp 6-) were reached with the arrival of the February 24 CME.
The SIDC Space Weather Briefing
The Space Weather Briefing presented by the forecaster on duty from Feb 19 to 26. It reflects in images and graphs what is written in the Solar and Geomagnetic Activity report: https://www.stce.be/briefings/20230227_SWbriefing.pdf
If you need to access the movies, contact us: stce_coordination at stce.be
Calendar
Check out our activity calendar: activities and encounters with the Sun-Space-Earth system and Space Weather as the main theme. We provide occasions to get submerged in our world through educational, informative and instructive activities.
If you want your event in our calendar, contact us: stce_coordination at stce.be
* March 14, PITHIA-NRF High Profile Meeting, Brussels, Belgium
* March 15, PITHIA-NRF Innovation Day, Brussels, Belgium
* March 16, PITHIA-NRF Training for Partners, Brussels, Belgium
* March 17, PITHIA-NRF Workshop for Optimization of Observational Strategies, Brussels, Belgium
* March 17, STCE seminar: The European Space Weather and Space Climate association (E-SWAN) and the future benefit for its community, Nicolet@spacepole and Teams, Brussels, Belgium
* March 27-29, STCE Space Weather Introductory Course, Brussels, Belgium - FULL
* April 21, BIRA-IASB seminar: High resolution modelling of atmospheric composition over Antwerp, Belgium, Nicolet@spacepole and Teams, Brussels, Belgium
* April 28, STCE seminar: Space Weather Tools in Support of Space Radiation Operations, Nicolet@spacepole and Teams, Brussels, Belgium
* May 22-24, STCE Space Weather Introductory Course, Brussels, Belgium - FULL
* May 25, STCE seminar: Comparative study of a constant-alpha force-free field and its approximations in an ideal toroid, Meridian room@spacepole and zoom, Brussels, Belgium
* May 29 - June 1, PITHIA-NRF Training School, Rome, Italy
Check: https://www.stce.be/calendar