- Table of Content
- 1.No holidays fo...
- 2.Review of Spac...
- 3.International ...
- 4.Noticeable Sol...
- 5.PROBA2 Observa...
- 6.Geomagnetic Ob...
- 7.Review of Iono...
- 8.The SIDC Space...
- 9.Upcoming Activ...
2. Review of Space Weather
3. International Sunspot Number by SILSO
4. Noticeable Solar Events
5. PROBA2 Observations (24 Jul 2023 - 30 Jul 2023)
6. Geomagnetic Observations in Belgium
7. Review of Ionospheric Activity
8. The SIDC Space Weather Briefing
9. Upcoming Activities
No holidays for the Sun!...
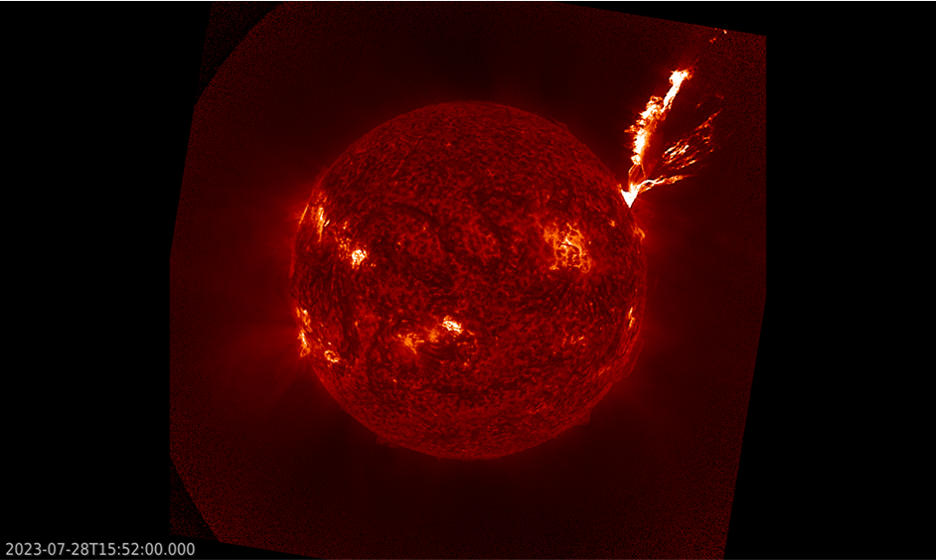
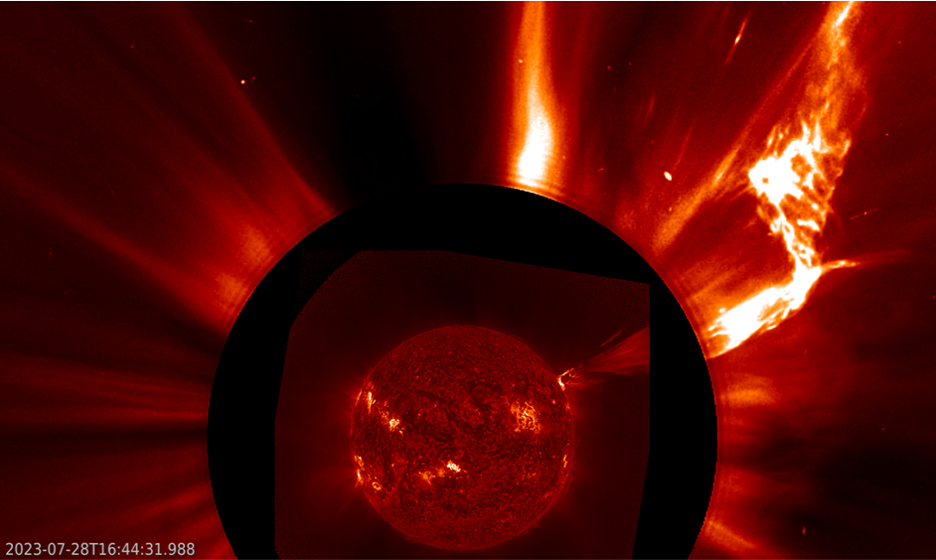
NOAA 3376 was a decaying sunspot group when new magnetic flux started to emerge from 24 July onwards. This resulted in numerous M-class flares before it rounded the northwest solar limb on 27 July. Interestingly, it produced its most impressive eruption a day later while it was well behind the solar limb. The M4.1 flare peaked at 15:58 UTC (GOES - https://www.swpc.noaa.gov/products/goes-x-ray-flux ). The wide-field SUVI 304 image (GOES - https://www.swpc.noaa.gov/products/goes-solar-ultraviolet-imager-suvi ) underneath shows the eruption in all its -extreme ultraviolet- glory. The next image combines the aftermath of the eruption in EUV with white light coronagraphic imagery from SOHO/LASCO C2 (https://soho.nascom.nasa.gov/ ) displaying the related coronal mass ejection (CME). The CACTus tool (https://www.sidc.be/cactus/ ) reported a plane-of-the-sky speed for this CME near 500 km/s. Clips are available in the online version of this newsitem at https://www.stce.be/news/658/welcome.html
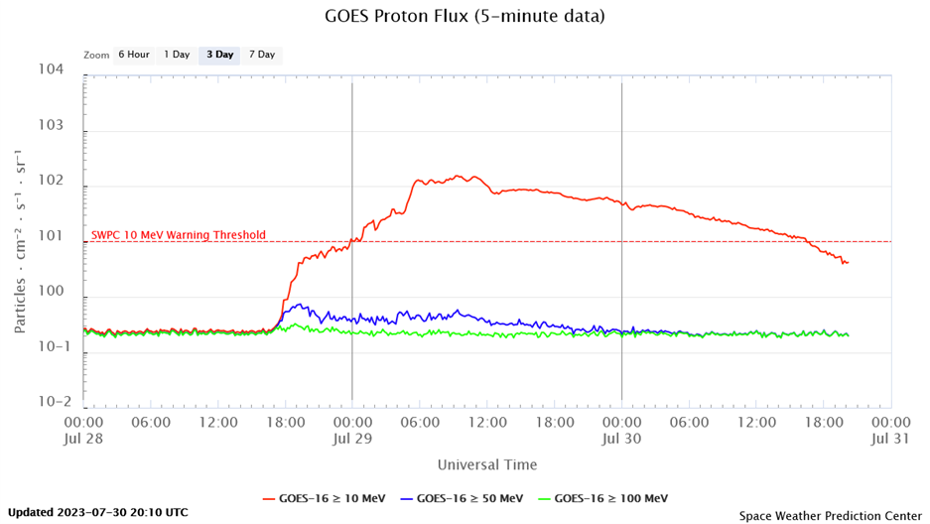
The eruption was also associated with a moderate solar radiation storm. The greater than 10 MeV proton flux reached a maximum of 154 pfu on 29 July at 09:20 UTC, as shown in the plot underneath (GOES - https://www.swpc.noaa.gov/products/goes-proton-flux ). This is the second moderate radiation event of Solar Cycle 25, the first (and stronger) one being produced just 2 weeks ago (see this STCE newsitem at https://www.stce.be/news/655/welcome.html ). Some degradation of High Frequency (HF) communication over the polar caps might have occurred, and so an advisory was sent to civil aviation (PECASUS - https://pecasus.eu/ ). As the fluxes of higher energetic protons remained very closely to background levels, no radiation advisory for civil aviation had to be issued.
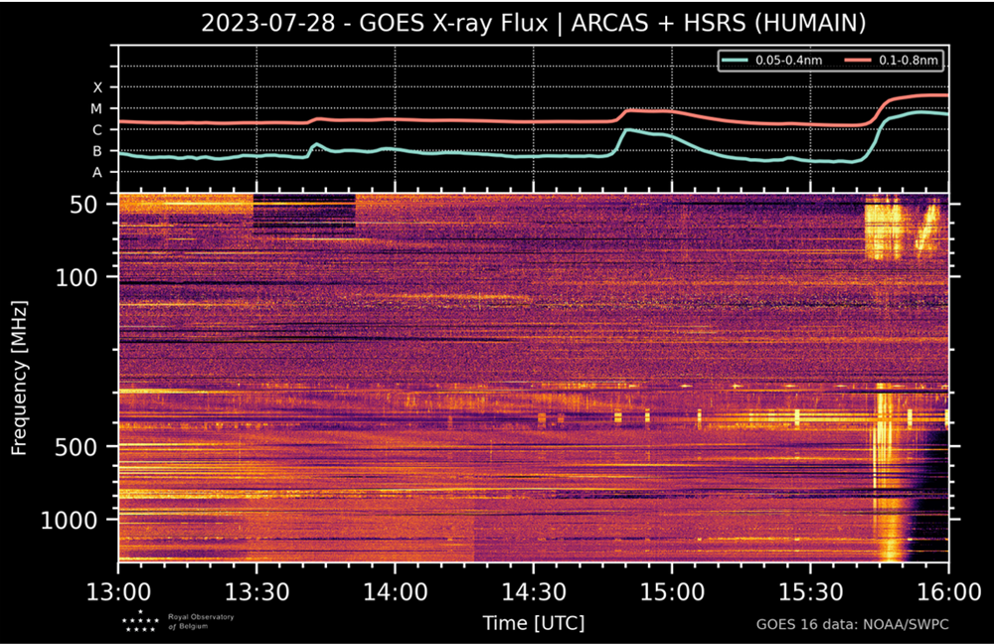
Associated with the eruption was Type V and Type II radio emission as reported by NOAA/SWPC (https://www.swpc.noaa.gov/products/solar-and-geophysical-event-reports ). Type II radio emission is produced by electrons accelerated by CME-driven shocks in the corona. Type V radio emission is the longer–duration low–frequency component that looks to be "attached" to (and possibly emerging from) the decay phase of the Type III burst ahead of it, and thus seems to be related to electron beams propagating along open magnetic field lines. More information and examples are at the STCE SWx Classification page - https://www.stce.be/educational/classification ). The Humain Radioastronomy Station (https://www.sidc.be/humain/home ), which will have its Open Doors on 9-10 September (https://www.stce.be/content/open-doors-radio-astronomy-station-humain ), was able to record the radio bursts between 15:40 and 16:00 UTC as can be seen to the right in the spectrogram underneath. The horizontal axis represents time increasing from left to the right and the vertical axis represents frequency (in MHz) decreasing upward to represent the decreasing density with increasing altitude in the solar atmosphere. The evolution of the solar soft-x-ray flux is displayed on top of the spectrogram.
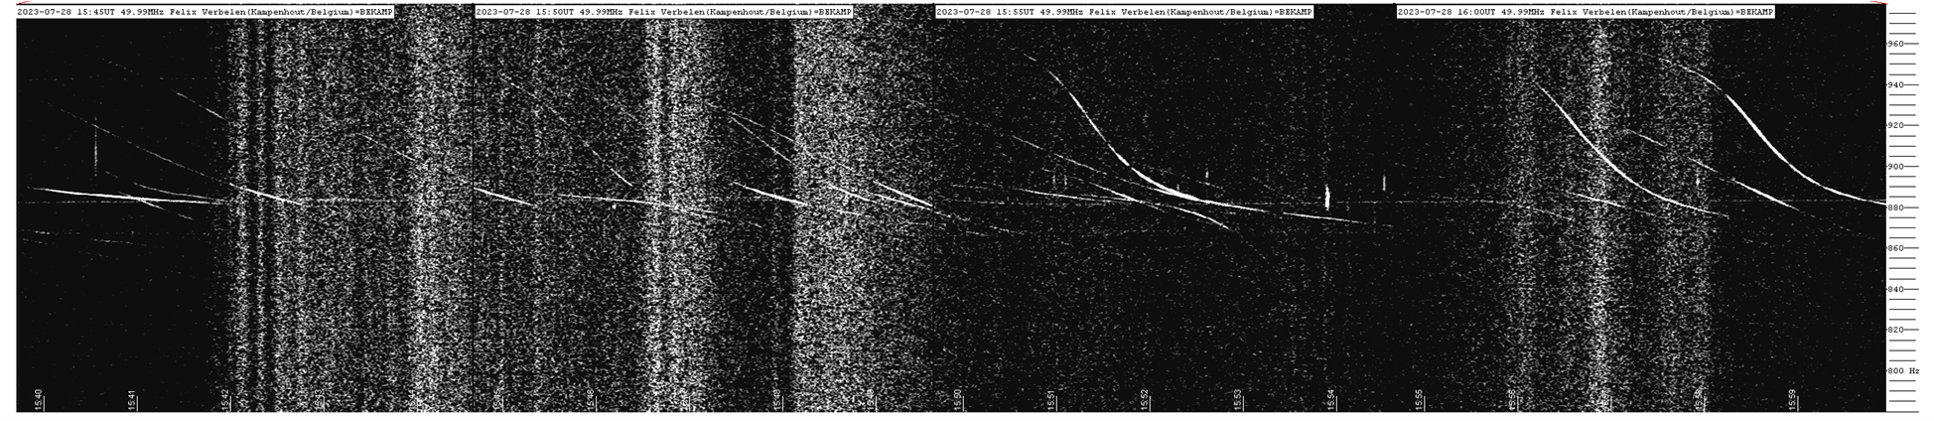
Radio meteor observers from the BRAMS network (https://brams.aeronomie.be/ ) use the signal from a dedicated beacon that was installed in September 2010 at the Geophysical Center of Dourbes (South of Belgium - http://dourbes.meteo.be/en/ ), and which is emitting at a frequency near 50 MHz. The receiver, many kilometers away, scans a narrow frequency range of about 200 Hz centered around this beacon frequency. Meteors will (usually) show up as short, thin vertical lines in this radio spectrogram, the reversed-s shaped lines are from passing airplanes. More info and an example can be found in this STCE newsitem at https://www.stce.be/news/512/welcome.html The radio spectrogram underneath covers the timeframe from 15:40 to 16:00 UTC on 28 July and is courtesy Felix Verbelen from the radio astronomy group of the Belgian Astronomical Association (https://www.vvs.be/werkgroepen/werkgroep-radioastronomie ). The noise that is evident in this spectrogram is -in this case- mostly due to the Type V and Type II radio bursts associated with the M4 flare and which can also be seen in the Humain radio spectrogram (upper right corner). Radio noise at this frequency is a nuisance to radio meteor observers, as it masks the faint signatures of the meteors.
Review of Space Weather
Solar Active Regions (ARs) and flares
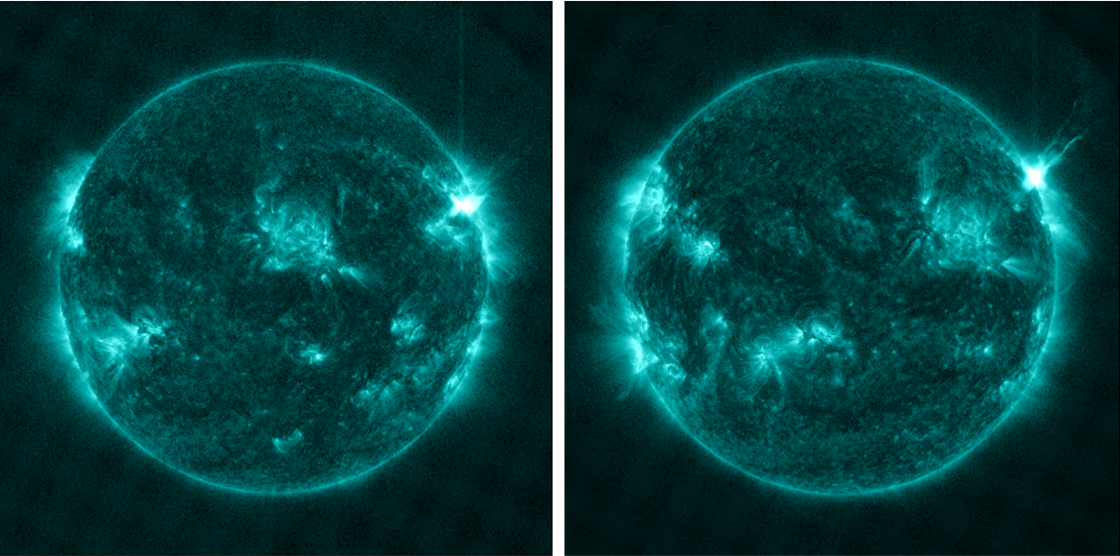
With 10 M-class flares, solar flaring activity was at moderate levels during the past week. NOAA Active Region (AR) 3376 (magnetic type Beta, Catania group 86) produced most of the M-class events, including the two strongest ones on 26 and 28 July (resp. M4.6 and M4.1). The other M-class flaring sources were NOAA AR 3380 (magnetic type Beta, Catania group 95, 2 M-class events), NOAA AR 3388 (magnetic type Beta, Catania group 2), and NOAA AR 3390 (magnetic type Beta, Catania group 8). The SDO/AIA 131 images underneath give a view on the two M4 flares on 26 (left) and 28 (right) July at the time of their peak in soft x-rays.
Coronal mass ejections
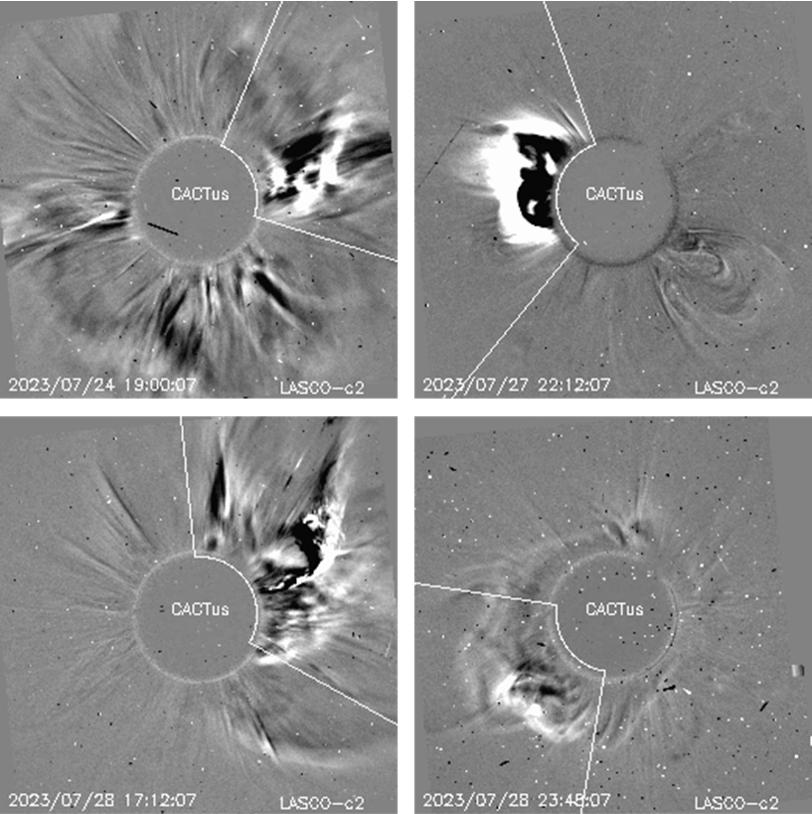
Two front-sided, partial halo Coronal Mass Ejections (CME) were detected during the past week. They were both recorded on 27 July, the first on the west solar limb was judged to have a small chance of arrival. However the second, related to a long filament eruption, was estimated to likely arrive at L1 on 1 August. Other important CMEs from last week include the farside CMEs from 24, a partial halo CME related to the M4.1 solar flare on 28 July just beyond the northwest limb, and a faint halo CME late on 28 July that was associated with a filament eruption near disk centre, thus suggesting a possible earth-directed component. The SOHO/LASCO C2 difference images (the previous image subtracted from the current image) underneath show the CMEs from 24, 27, and 28 July mentioned before.
Coronal Holes
A small, southern, coronal hole (CH) with positive magnetic polarity crossed the solar central meridian on 24 July.
Proton flux levels
Following the violent farside eruption on 24 July, the greater than 10 MeV proton flux became enhanced on 24 and 25 July, but -with 7 pfu- remained well below the 10 pfu alert threshold.
Associated with the M4.1 eruption on 28 July, the greater than 10 MeV proton flux started to rise again and passed the 10 pfu alert threshold on 29 July at 00:20 UTC. The proton flux reached a peak of 154 pfu at 09:20 UTC on 29 July, staying above 100 pfu for only about 6 hours. The proton event ended when it descended below the 10 pfu threshold on 30 July at 16:30 UTC.
Throughout the week, the greater than 100 MeV proton flux was mostly unaffected and remained at or close to nominal levels.
The evolution of the greater than 10 MeV and 100 MeV proton flux is shown in the plot underneath, covering the period from 23 July until 3 August.

Electron fluxes at GEO
The greater than 2 MeV electron flux remained below the 1000 pfu alert threshold during the past week, with a momentary increase above this level on 29 July at 14:45 UTC. This threshold crossing was part of the increased levels of electron flux observed from 27 July to 30 July.
The 24h electron fluence was at nominal levels during the past week.
Solar wind
Solar wind parameters reflected a slow solar wind regime from the beginning of the past week until the arrival of the expected glancing blow from a CME on 25 July. The solar wind speed then increased from 400 to a maximum of 560 km/s, while the total interplanetary magnetic field (Bt) increased from 5 nT to a maximum of 16 nT. The North-South component of the magnetic field (Bz) varied between -13 and 10 nT. In the wake of this glancing blow followed the wind stream associated with the positive polarity coronal hole. Solar wind (SW) speed increased marginally to values around 510 km/s and lasting only for a few hours. The total interplanetary magnetic field (Bt) dropped to below 10 nT and remained at that level for the rest of the week.
The interplanetary magnetic field was mostly oriented towards the Sun (negative phi angle) until the second half of 26 July when it changed its direction to away from the Sun (positive phi angle), remaining so until the end of the week.
Geomagnetism
Geomagnetic conditions were globally and locally at quiet to unsettled levels for most of the period. Intervals of minor geomagnetic storming were recorded globally (NOAA Kp 5-) for two 3-hours periods on 25 July during 21:00-24:00 and on 26 July during 03:00-06:00 UTC. Intervals with active geomagnetic conditions were also observed on 26 July. K_BEL registered only active conditions: late on 25 July, and early on 26 July and around noon (12h UTC) the same day.
International Sunspot Number by SILSO
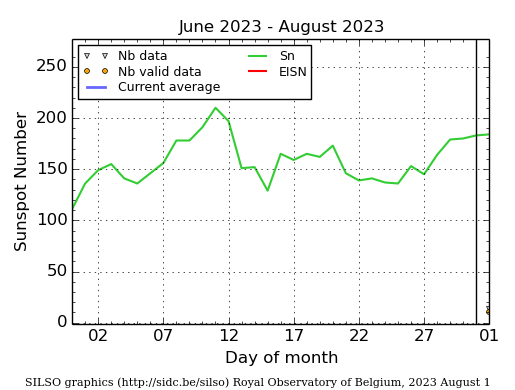
The daily Estimated International Sunspot Number (EISN, red curve with shaded error) derived by a simplified method from real-time data from the worldwide SILSO network. It extends the official Sunspot Number from the full processing of the preceding month (green line), a few days more than one solar rotation. The horizontal blue line shows the current monthly average. The yellow dots give the number of stations that provided valid data. Valid data are used to calculate the EISN. The triangle gives the number of stations providing data. When a triangle and a yellow dot coincide, it means that all the data is used to calculate the EISN of that day.
Noticeable Solar Events
| DAY | BEGIN | MAX | END | LOC | XRAY | OP | 10CM | TYPE | Cat | NOAA |
| 25 | 0136 | 0203 | 0224 | N25W49 | M1.5 | 2N | VI/2 | 86 | 3376 | |
| 25 | 2108 | 2116 | 2124 | N19W61 | M1.6 | SF | III/1 | 95 | 3380 | |
| 26 | 0421 | 0428 | 0433 | M1.2 | 86 | 3376 | ||||
| 26 | 1017 | 1037 | 1048 | M4.6 | CTM/1 | 86 | 3376 | |||
| 26 | 1550 | 1559 | 1607 | N19W73 | M2.0 | 1B | 86 | 3376 | ||
| 27 | 0944 | 0951 | 0958 | N21W88 | M1.9 | SF | CTM/1 | 86 | 3376 | |
| 27 | 2204 | 2234 | 2305 | S21E68 | M1.7 | SF | VI/1 | 3388 | ||
| 28 | 1539 | 1558 | 1613 | M4.1 | V/3II/2 | 3376 | ||||
| 29 | 1611 | 1624 | 1637 | S11W8 | M1.4 | 1N | 100 | CTM/2 | 95 | 3380 |
| 30 | 0801 | 0814 | 0818 | S16E55 | M1.8 | 1F | 120 | 3390 | ||
| 30 | 0818 | 0822 | 0826 | M1.8 | 3390 |
| LOC: approximate heliographic location | TYPE: radio burst type |
| XRAY: X-ray flare class | Cat: Catania sunspot group number |
| OP: optical flare class | NOAA: NOAA active region number |
| 10CM: peak 10 cm radio flux |
PROBA2 Observations (24 Jul 2023 - 30 Jul 2023)
Solar Activity
Solar flare activity fluctuated from low to moderate during the week.
In order to view the activity of this week in more detail, we suggest to go to the following website from which all the daily (normal and difference) movies can be accessed: https://proba2.oma.be/ssa
This page also lists the recorded flaring events.
A weekly overview movie can be found here (SWAP week 696). https://proba2.sidc.be/swap/data/mpg/movies/weekly_movies/weekly_movie_2023_07_24.mp4
Details about some of this week's events can be found further below.
If any of the linked movies are unavailable they can be found in the P2SC movie repository here https://proba2.sidc.be/swap/data/mpg/movies/
Wednesday Jul 26

The largest flare of the week, a M4.6 flare, was produced by the active region NOAA 3376 around
10:36 UT (SWAP image above). It was located at the North West part of the solar disk. Find a SWAP movie of the event here. https://proba2.sidc.be/swap/data/mpg/movies/20230726_swap_movie.mp4
Geomagnetic Observations in Belgium
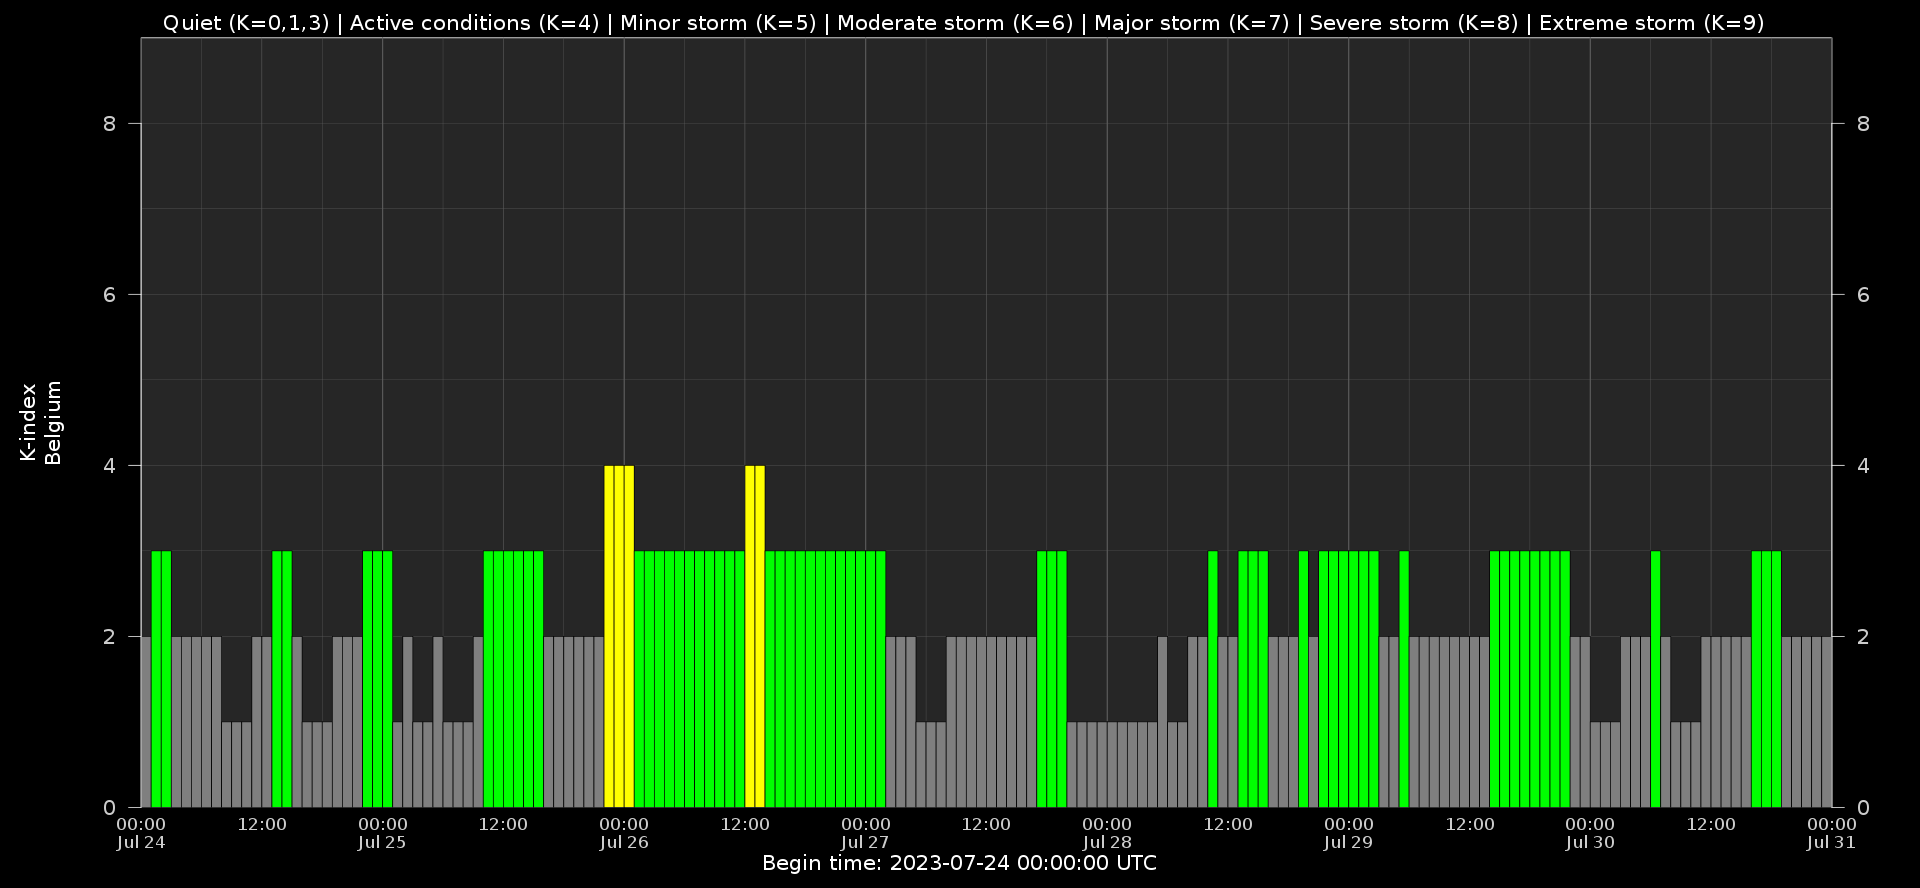
Local K-type magnetic activity index for Belgium based on data from Dourbes (DOU) and Manhay (MAB). Comparing the data from both measurement stations allows to reliably remove outliers from the magnetic data. At the same time the operational service availability is improved: whenever data from one observatory is not available, the single-station index obtained from the other can be used as a fallback system.
Both the two-station index and the single station indices are available here: http://ionosphere.meteo.be/geomagnetism/K_BEL/
Review of Ionospheric Activity
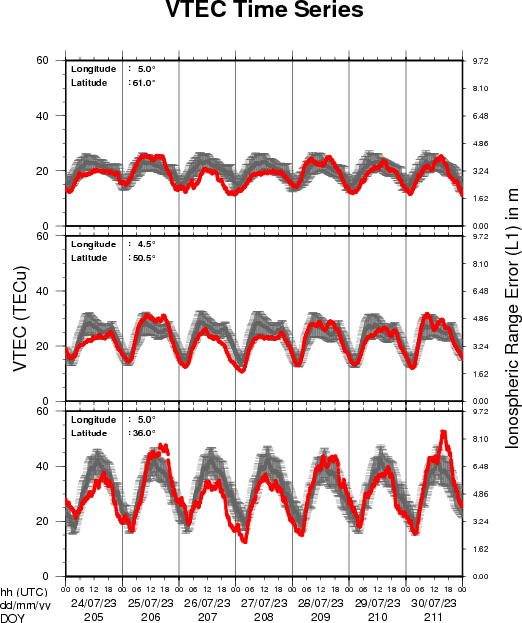
The figure shows the time evolution of the Vertical Total Electron Content (VTEC) (in red) during the last week at three locations:
a) in the northern part of Europe(N 61deg E 5deg)
b) above Brussels(N 50.5deg, E 4.5 deg)
c) in the southern part of Europe(N 36 deg, E 5deg)
This figure also shows (in grey) the normal ionospheric behaviour expected based on the median VTEC from the 15 previous days.
The VTEC is expressed in TECu (with TECu=10^16 electrons per square meter) and is directly related to the signal propagation delay due to the ionosphere (in figure: delay on GPS L1 frequency).
The Sun's radiation ionizes the Earth's upper atmosphere, the ionosphere, located from about 60km to 1000km above the Earth's surface.The ionization process in the ionosphere produces ions and free electrons. These electrons perturb the propagation of the GNSS (Global Navigation Satellite System) signals by inducing a so-called ionospheric delay.
See http://stce.be/newsletter/GNSS_final.pdf for some more explanations ; for detailed information, see http://gnss.be/ionosphere_tutorial.php
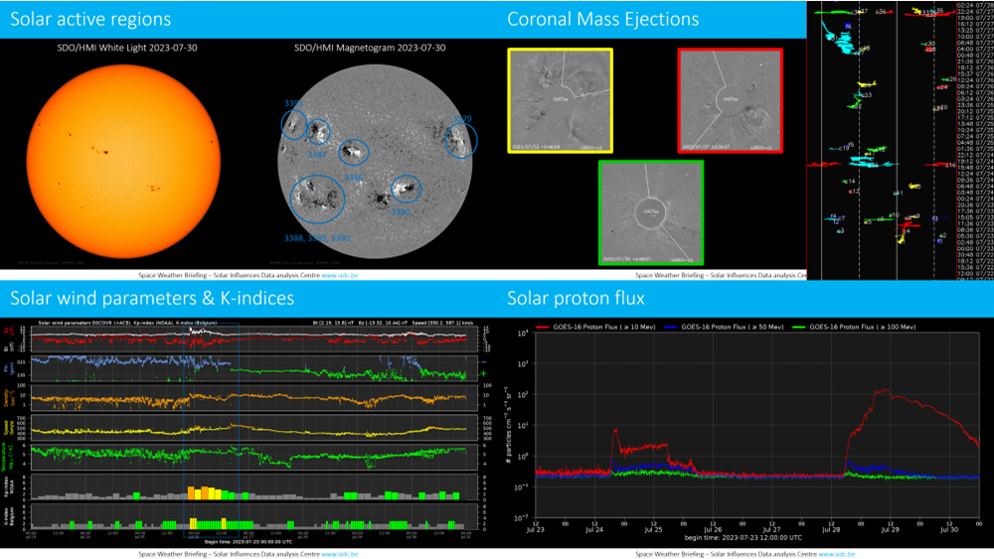
The SIDC Space Weather Briefing
The Space Weather Briefing presented by the forecaster on duty from 24 to 30 July. It reflects in images and graphs what is written in the Review of Space Weather: https://www.stce.be/briefings/20230731_SWbriefing.pdf
If you need to access the movies, contact us: stce_coordination at stce.be
Upcoming Activities
Check out our activity calendar: activities and encounters with the Sun-Space-Earth system and Space Weather as the main theme. We provide occasions to get submerged in our world through educational, informative and instructive activities.
If you want your event in our calendar, contact us: stce_coordination at stce.be
* Aug 21, Lecture: The Sun, VVS Summerschool, Leuven, Belgium
* Sep 9-10, Open Doors at the Humain Radioastronomy Station, Humain, Belgium
* Sep 18-20, STCE Space Weather Introductory Course, Brussels, Belgium - Registrations are open
* Sep 26, post-Space Weather Introductory Course, by JMG, Woensdrecht, The Netherlands - registration is included in the Sep SWIC
* Nov 18-19, e-SWAN Space Weather School: data, models and services, by the STCE, Toulouse, France
* Dec 4-6, STCE course: Space Weather impacts on ionospheric wave propagation - focus on GNSS and HF, Brussels, Belgium - Registrations are open
* Jan 22-24, 2024, STCE Space Weather Introductory Course, Brussels, Belgium - Registrations are open
* Jan 25, 2024, post-Space Weather Introductory Course, by JMG and MeteoWing, place TBD - registration is included in the Jan SWIC
Check: https://www.stce.be/calendar