- Table of Content
- 1.Next STCE News...
- 2.STCE's Summer ...
- 3.Review of Spac...
- 4.International ...
- 5.Noticeable Sol...
- 6.PROBA2 Observa...
- 7.Geomagnetic Ob...
- 8.Review of Iono...
- 9.The SIDC Space...
- 10.Upcoming Activ...
2. STCE's Summer Games
3. Review of Space Weather
4. International Sunspot Number by SILSO
5. Noticeable Solar Events
6. PROBA2 Observations (31 Jul 2023 - 6 Aug 2023)
7. Geomagnetic Observations in Belgium
8. Review of Ionospheric Activity
9. The SIDC Space Weather Briefing
10. Upcoming Activities
Next STCE Newsletter
We are taking a short break during the week of 15 August (national holiday). The next STCE Newsletter will normally be issued around 24 August.
We wish you very pleasant summer holidays!

STCE's Summer Games
The Sun has been quite active over the last few weeks (see e.g. this STCE newsflash at https://www.stce.be/news/659/welcome.html ), and is not expected to go quiet just yet. Nonetheless, just for those few brief dips in solar activity that may happen over the next weeks, here are five fun puzzles to keep you busy for a while. All puzzles are related to space weather (SWx), and the solutions can be found in the related online version at https://www.stce.be/news/660/welcome.html
Good sources for more information on the words and acronyms used in these puzzles are the websites of the Royal Belgian Institute for Space Aeronomy (BIRA-IASB - https://www.aeronomie.be/en ), the website of the Geophysical Centre of the Royal Meteorological Institute (RMI) in Dourbes (http://ionosphere.meteo.be/geomagnetism/ ), the ROB/GNSS website (http://gnss.be/ ), the ROB/SIDC webpages (https://www.sidc.be/ ), and the STCE space weather support pages at https://www.stce.be/educational/acronym (SWx acronyms) and https://www.stce.be/educational/classification (SWx classifications).
Enjoy!
Find the errors
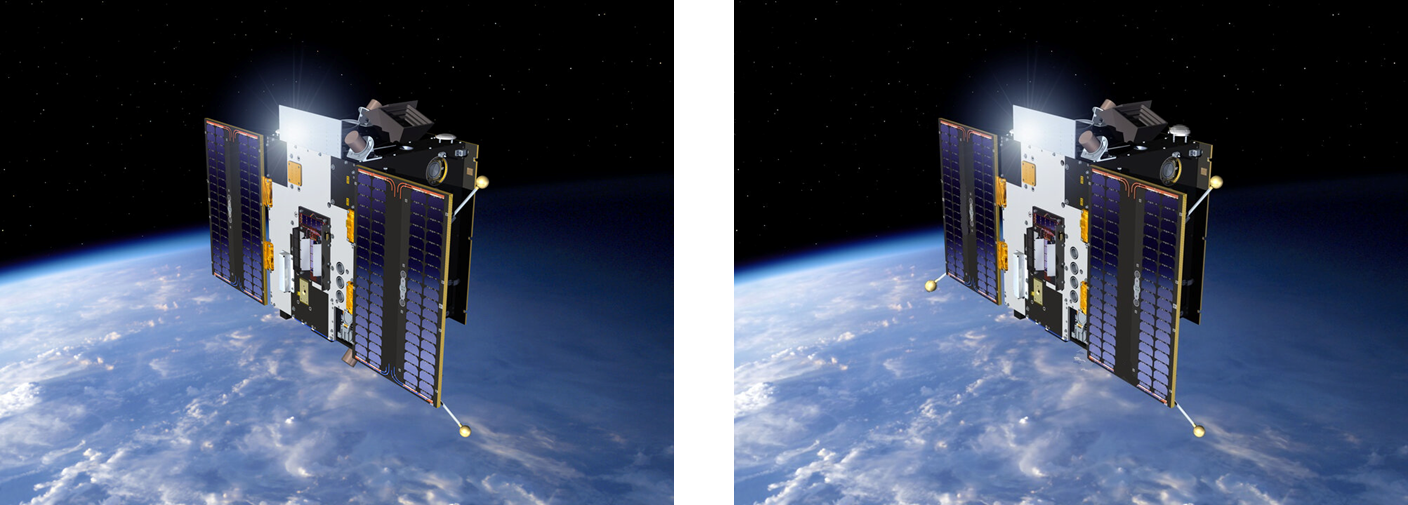
STCE engineers have designed a twin for PROBA2. Unfortunately, in all their enthusiasm, they have made some "unwanted modifications". Can you spot the 8 differences?
What's his/her profession?
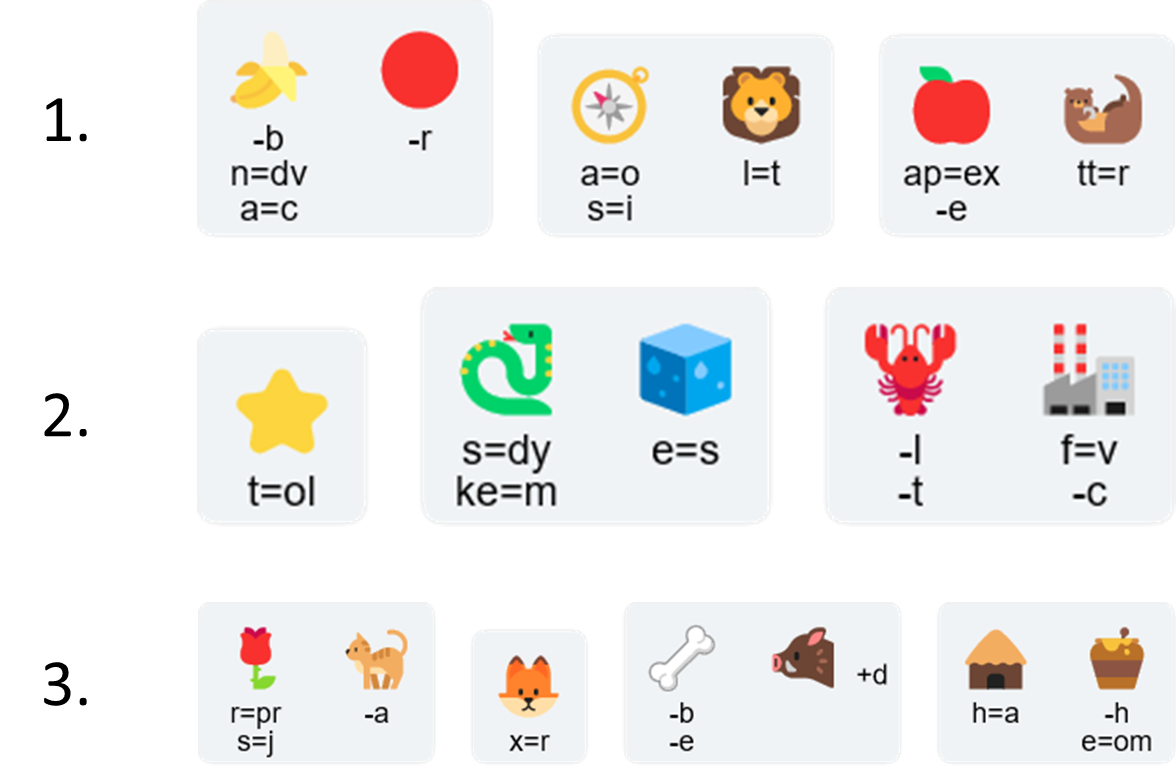
You wouldn't say, but the name of each of these persons contains a profession closely related to the space weather domain. Can you figure them out?

SWx mix-up
While on holidays, a solar physicist slipped on a wet tile near the swimming pool. As a result, the contents of the suitcase got mixed up. Can you find which instruments are in this bag? They all are acronyms of instruments on board of operational space weather or solar satellites, and each contains 5 letters.

SWx Rebuses
Which 3 operational space weather satellites (full names) are described by these rebuses? This puzzle was created with the Rebus Club online tool at https://rebus.club/en
Word Search
This puzzle is a word search puzzle that has a hidden message in it. The theme is "Space weather impacts on satellites". First find all the words in the list. Words can go in any direction and share letters as well as cross over each other. Once you have found all the words, copy the unused letters starting in the top left corner into the blanks to reveal the hidden message (2 words, 22 letters). This puzzle was created with the Discovery Education online tool at https://puzzlemaker.discoveryeducation.com/
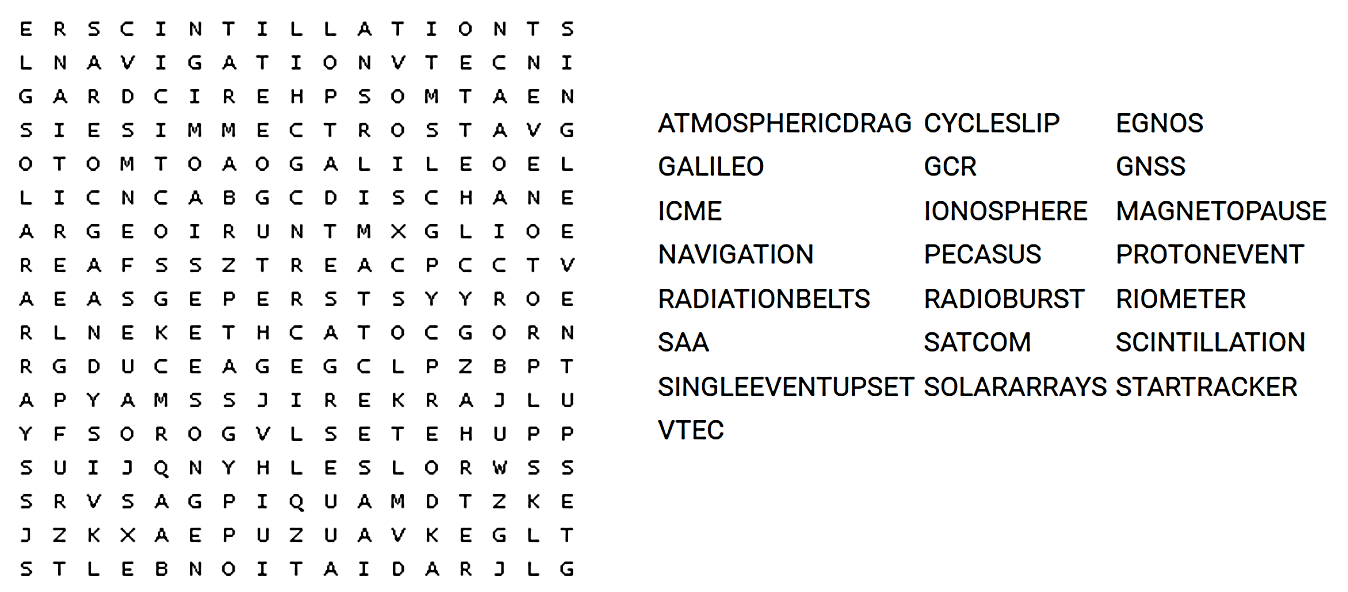
Hidden message: _ _ _ _ _ _ _ _ _ _ _ _ _ _ _ _ _ _ _ _ _ _
Review of Space Weather
Solar Active Regions (ARs) and flares
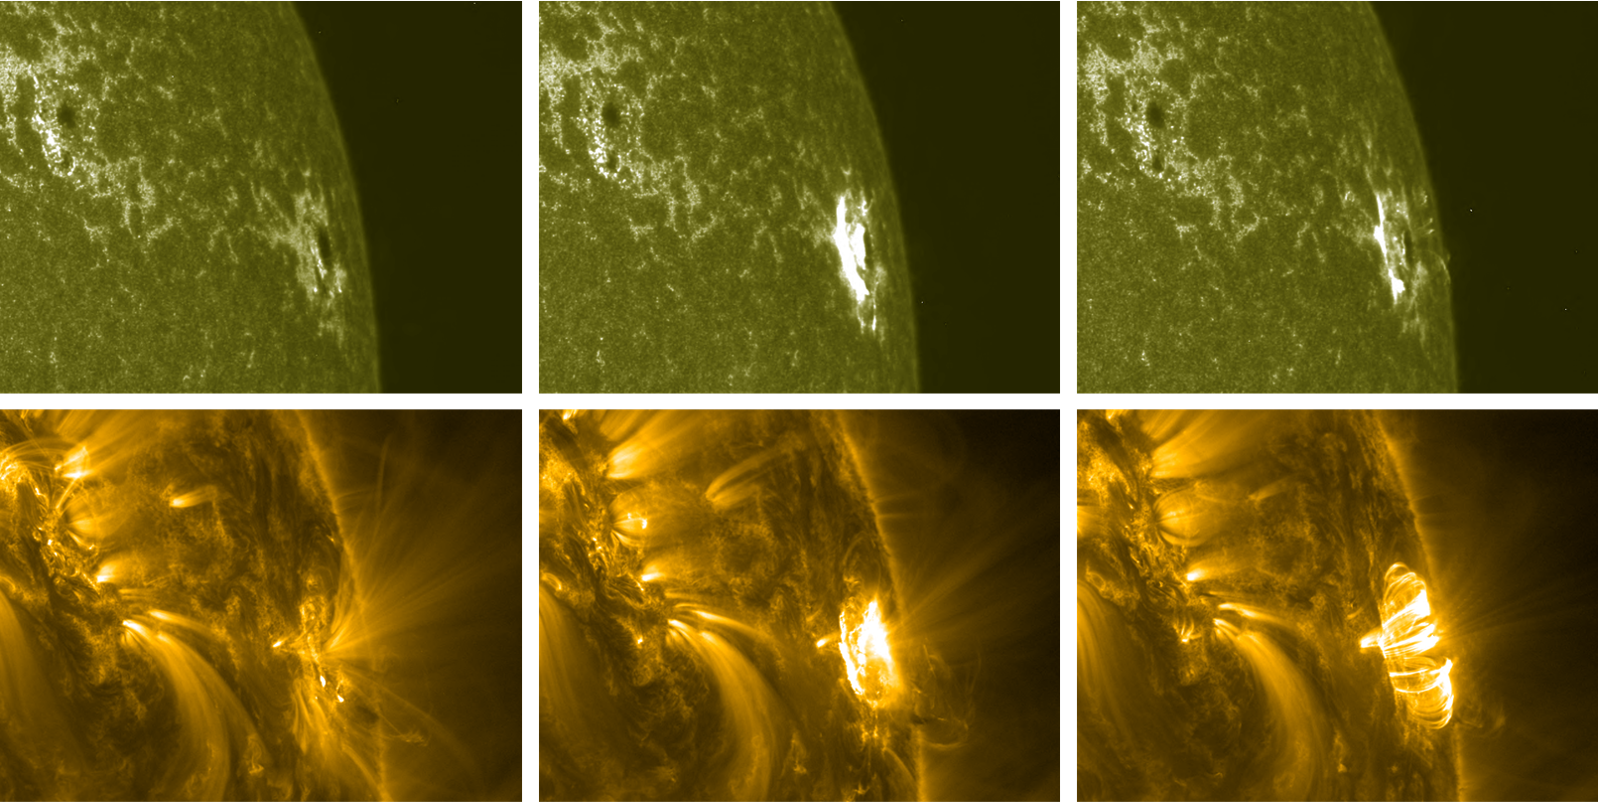
The solar flaring activity over the past week was at high levels with one X-class and 18 M-class flares. There were 14 numbered active regions on the visible solar disk. NOAA Active Regions (ARs) 3380 and 3386 were the sources of the majority of the flaring activity over the past week. NOAA AR 3386 produced the largest event, an X1.6 flare which peaked at 22:21 UTC on 5 August. This event was associated with a Type II radio burst, a proton event, and a wide coronal mass ejection (CME) first observed on 22:36 UTC the same day. The very active NOAA AR 3380 produced 14 M-class flares, and numerous C-class flares.
The extreme ultraviolet images underneath show the blast site an hour before, during , and an hour after the peak of the X1.6 flare. The top row is from SDO/AIA 1600 (temperatures near 10.000 degrees), the bottom row is from SDO/AIA 171 (near 700.000 degrees).
Coronal mass ejections
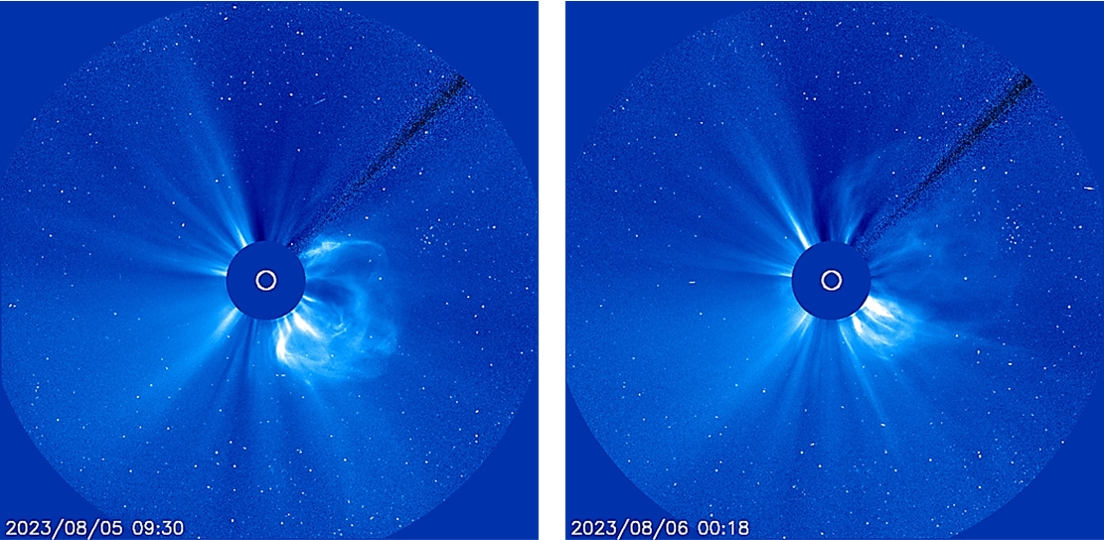
Multiple coronal mass ejections (CMEs) were observed throughout the week, among them, two partial halo CMEs with Earth-directed components. A partial halo CME observed in LASCO/C2 coronagraph imagery at 09:12 UTC on 2 August was associated with a filament eruption near the central meridian. The CME's speed was estimated to be 700 km/s and was expected to impact the Earth with a glancing blow on 5 August around 12:00 UTC but impacted the Earth several hours earlier, with a shock observed at 02:09 UTC on 5 August. Another partial halo CME was observed in LASCO/C2 coronagraph observations at 07:12 UTC on 5 August. This partial halo CME was associated with a GOES M1.6 flare from NOAA AR 3386, the filament eruption below the same active region, and a Type II radio burst. This CME's speed was estimated to be 1000 km/s which will potentially impact the Earth with a glancing blow around noon on 8 August.
The SOHO/LASCO C3 images underneath show the CMEs associated with resp. the M1.6 and X1.6 flare from 5 August.
Coronal holes
A negative polarity equatorial coronal hole crossed the central meridian on 1 August, but the corresponding high speed stream did not arrive to the Earth.
Proton flux levels
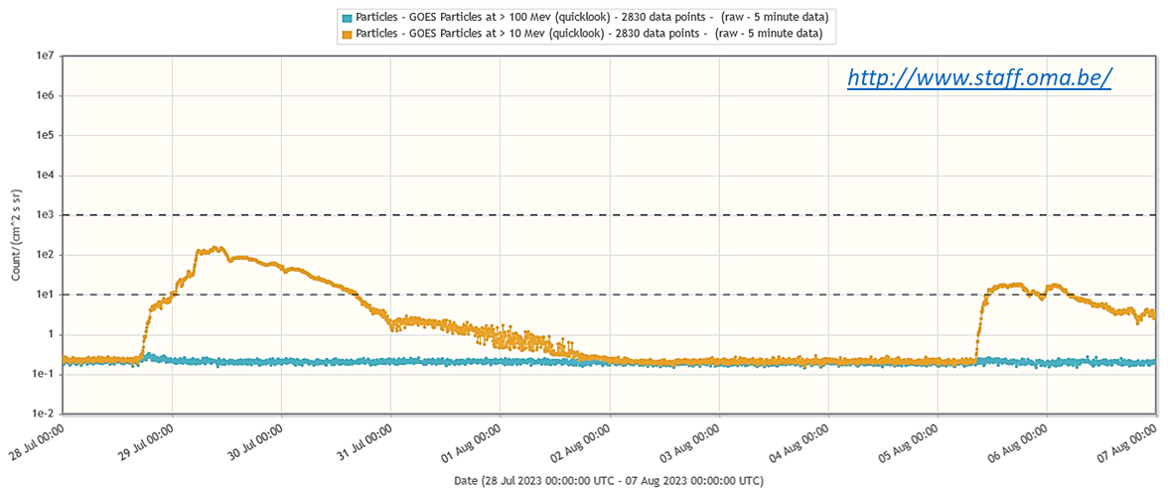
The week started with elevated proton levels following a moderate proton event on 28 July, which gradually decreased to background levels late on 1 August. The greater than 10 MeV proton flux started to increase around 8:30 UTC on 5 August, following the long duration M1.6 flare from NOAA AR 3386 which peaked at 7:18 UTC. The proton flux crossed the 10 pfu threshold at 11:15 UTC on 5 August, reaching a maximum of 18 pfu at 17:45 UTC. Dropping briefly below the 10 pfu alert threshold around 22:30 UTC on 5 August, it again started to increase following the X1.6 flare produced by NOAA AR 3386 which peaked at 22:21 UTC. The proton flux crossed the threshold at 23:45 UTC, and reached a maximum of 17 pfu at 01:40 UTC on 6 August. The proton flux then gradually decreased below the threshold (04:55 UTC) but was still enhanced by the end of the period with values around 3 pfu.
The graph underneath covers the period from 28 July till 6 August, and shows the moderate and two minor proton events as discussed above. Note the greater than 100 MeV proton flux was at background levels during the entire period.
Electron fluxes at GEO
During the last week, the greater than 2 MeV electron flux remained below the 1000 pfu threshold in general, except for a brief period on 1 August.
Solar wind
The solar wind speed was slightly elevated at the start of the week and returned to a slow solar wind regime on 31 July. The solar wind parameters showed mild enhancements on 1 and 2 August due to the arrival of a possible coronal mass ejection (CME) which was observed on 28 July. The solar wind speed ranged between 370 km/s and 430 km/s, while the North-South component (Bz) ranged between -8 and +10 nT, and the strength of the interplanetary magnetic field ranged from 3 nT to 12 nT. The solar wind near Earth was strongly enhanced during 4 and 5 August. While the solar wind speed remained mainly in a slow regime ranging from 350 km/s to 480 km/s, the North-South component (Bz) was fluctuating between a strong -21 and +14 nT. The interplanetary magnetic field was disturbed with values ranging from 6 to 24 nT. The source of these disturbed solar wind parameters was most likely the arrival of CME that was observed on 2 August.
Geomagnetism
The geomagnetic activity throughout the week ranged from quiet to major storm conditions. Global geomagnetic conditions (Kp) reached major storm levels following the ICME arrival on 5 August. An active period was globally measured on 2 August, also most likely the result of the passage of an ICME. K_BEL reached only minor storming conditions on 5 August, with brief episodes of active conditions on 1 and 2 August.
International Sunspot Number by SILSO
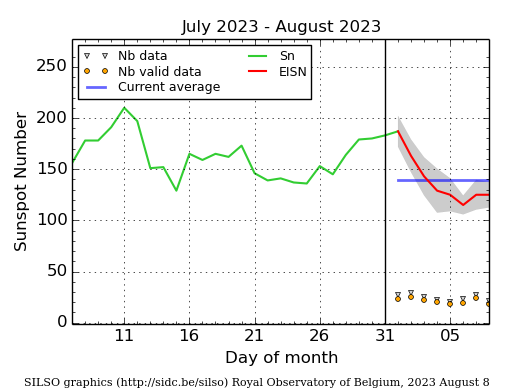
The daily Estimated International Sunspot Number (EISN, red curve with shaded error) derived by a simplified method from real-time data from the worldwide SILSO network. It extends the official Sunspot Number from the full processing of the preceding month (green line), a few days more than one solar rotation. The horizontal blue line shows the current monthly average. The yellow dots give the number of stations that provided valid data. Valid data are used to calculate the EISN. The triangle gives the number of stations providing data. When a triangle and a yellow dot coincide, it means that all the data is used to calculate the EISN of that day.
Noticeable Solar Events
| DAY | BEGIN | MAX | END | LOC | XRAY | OP | 10CM | TYPE | Cat | NOAA |
| 31 | 0842 | 0900 | 0913 | S20E44 | M1.6 | 2F | 8 | 3390 | ||
| 01 | 0138 | 0156 | 0158 | S8W39 | M1.0 | SF | 95 | 3380 | ||
| 01 | 0158 | 0203 | 0207 | M1.2 | 95 | 3380 | ||||
| 01 | 0427 | 0447 | 0507 | S10W41 | M2.2 | 1N | 95 | 3380 | ||
| 01 | 0530 | 0537 | 0543 | M1.3 | 95 | 3380 | ||||
| 01 | 0628 | 0657 | 0719 | M3.6 | III/1 | 95 | 3380 | |||
| 01 | 0903 | 0909 | 0916 | N19E66 | M1.5 | SF | 95 | 3380 | ||
| 01 | 1403 | 1409 | 1427 | S10W45 | M1.4 | 1N | 95 | 3380 | ||
| 01 | 2139 | 2151 | 2158 | M1.0 | 3880 | |||||
| 02 | 0803 | 0812 | 0821 | N11W22 | M1.3 | 1F | II/2VI/2IV/2 | 95 | 3380 | |
| 02 | 1044 | 1050 | 1054 | S10W61 | M1.2 | 1F | CTM/1 | 95 | 3380 | |
| 02 | 1446 | 1452 | 1456 | S11W58 | M1.7 | SF | 95 | 3380 | ||
| 02 | 1613 | 1622 | 1626 | M1.3 | 95 | 3380 | ||||
| 02 | 1909 | 1914 | 1921 | M1.1 | 95 | 3380 | ||||
| 03 | 1147 | 1155 | 1159 | S13W75 | M2.0 | SF | III/1 | 95 | 3380 | |
| 04 | 0338 | 0424 | 0511 | N11W43 | M1.9 | 1N | 140 | III/2CTM/1 | 1 | 3386 |
| 05 | 0616 | 0718 | 0906 | M1.6 | N | I/2 5 | 1 | 3386 | ||
| 05 | 0923 | 0936 | 0950 | M2.1 | TM/1 | 95 | 3380 | |||
| 05 | 2145 | 2221 | 2244 | X1.6 | N | I/1 7 | 1 | 3386 | ||
| 06 | 1820 | 1840 | 1854 | M5.5 | N | 1 | 3386 |
| LOC: approximate heliographic location | TYPE: radio burst type |
| XRAY: X-ray flare class | Cat: Catania sunspot group number |
| OP: optical flare class | NOAA: NOAA active region number |
| 10CM: peak 10 cm radio flux |
PROBA2 Observations (31 Jul 2023 - 6 Aug 2023)
Solar Activity
Solar flare activity fluctuated from moderate to high during the week.
In order to view the activity of this week in more detail, we suggest to go to the following website from which all the daily (normal and difference) movies can be accessed: https://proba2.oma.be/ssa
This page also lists the recorded flaring events.
A weekly overview movie (SWAP week 697) can be found here: https://proba2.sidc.be/swap/data/mpg/movies/weekly_movies/weekly_movie_2023_07_31.mp4.
Details about some of this week's events can be found further below.
If any of the linked movies are unavailable they can be found in the P2SC movie repository here: https://proba2.oma.be/swap/data/mpg/movies/.
Saturday August 05
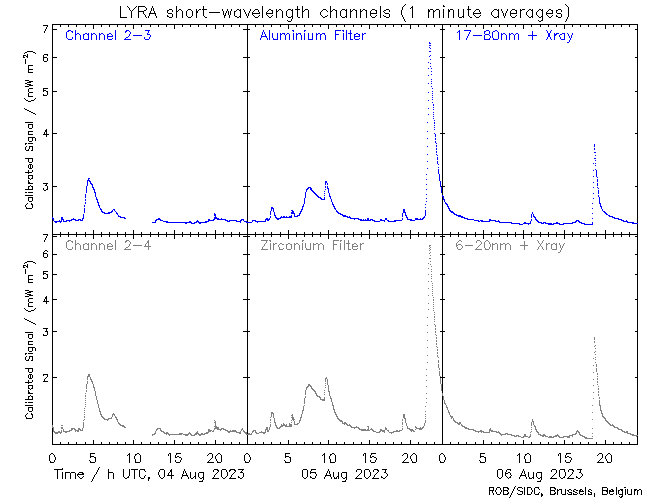
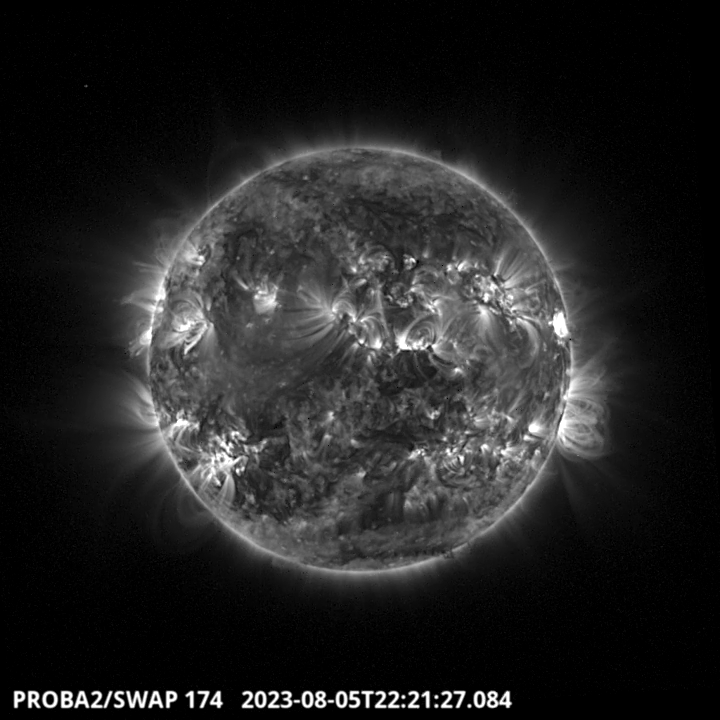
The largest flare of this active week, an X1.6, was observed by LYRA (top panel) and SWAP (bottom panel). The flare peaked on 2023-Aug-05 at 22:21 UT. It occurred close to the equator at the western solar limb, and it originated from NOAA AR3386.
Find a SWAP movie of the event here: https://proba2.sidc.be/swap/movies/20230805_swap_movie.mp4.
Geomagnetic Observations in Belgium
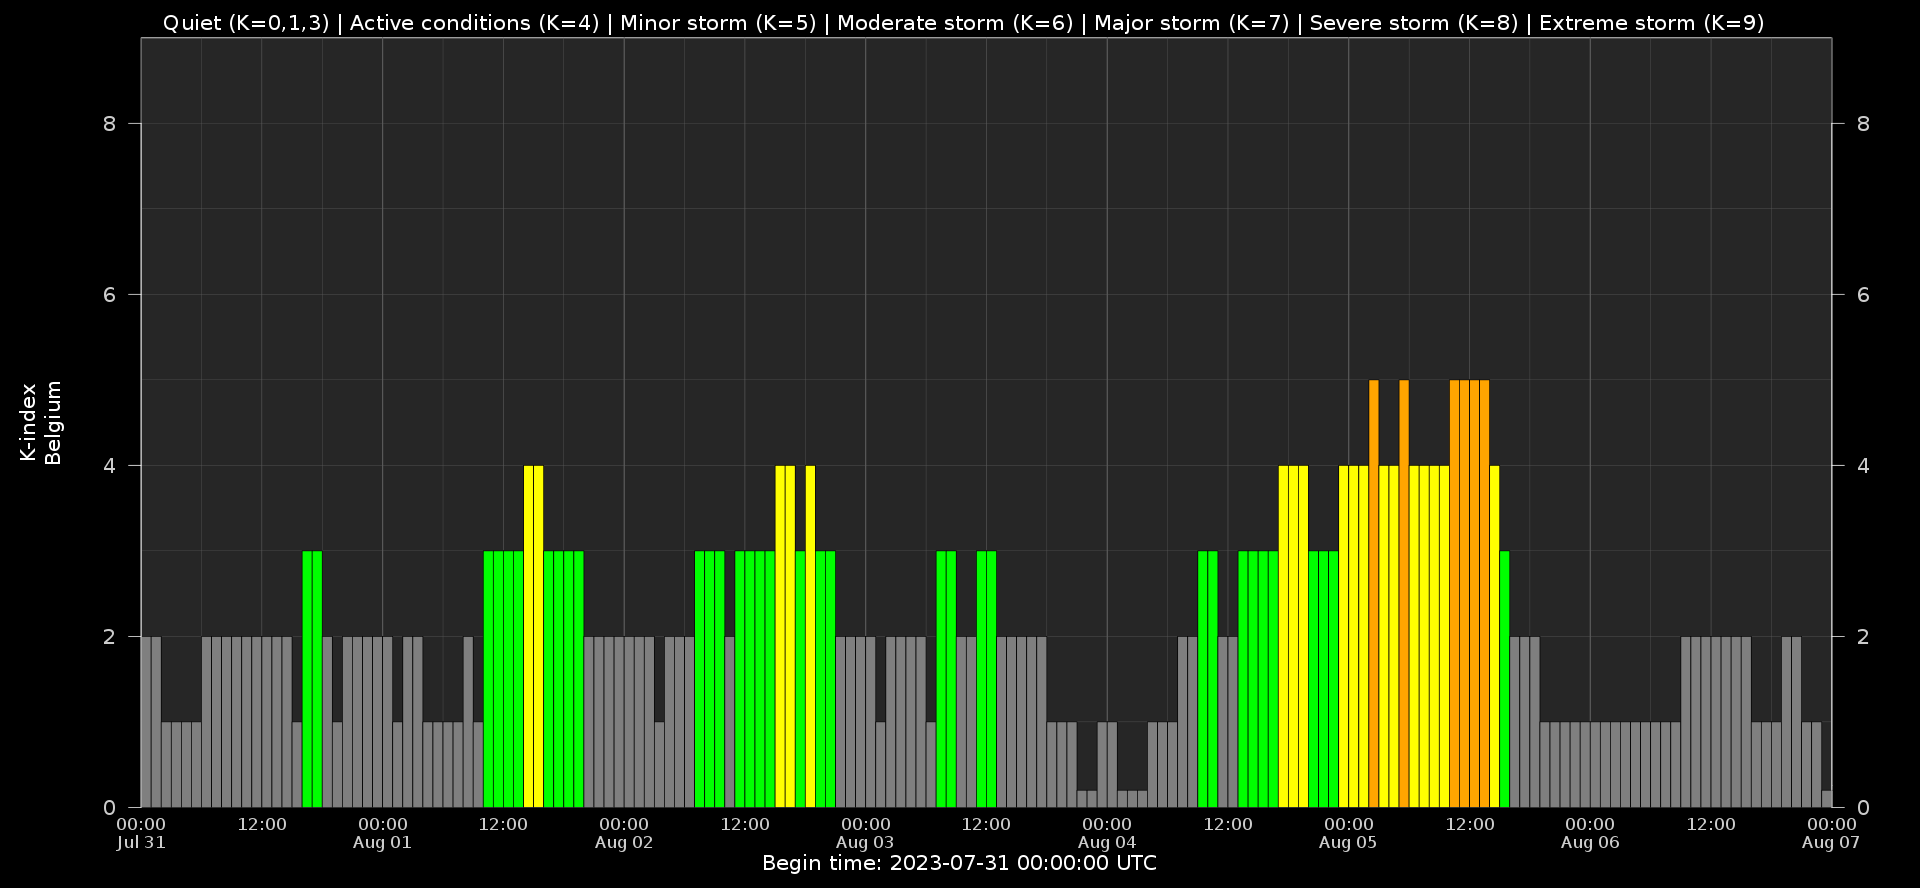
Local K-type magnetic activity index for Belgium based on data from Dourbes (DOU) and Manhay (MAB). Comparing the data from both measurement stations allows to reliably remove outliers from the magnetic data. At the same time the operational service availability is improved: whenever data from one observatory is not available, the single-station index obtained from the other can be used as a fallback system.
Both the two-station index and the single station indices are available here: http://ionosphere.meteo.be/geomagnetism/K_BEL/
Review of Ionospheric Activity
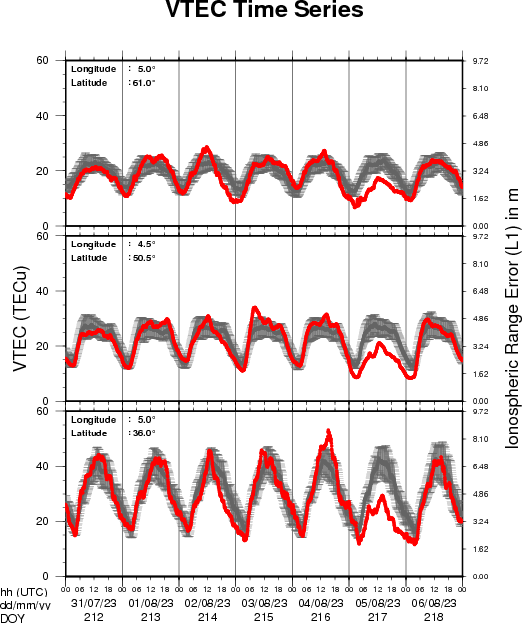
The figure shows the time evolution of the Vertical Total Electron Content (VTEC) (in red) during the last week at three locations:
a) in the northern part of Europe(N 61deg E 5deg)
b) above Brussels(N 50.5deg, E 4.5 deg)
c) in the southern part of Europe(N 36 deg, E 5deg)
This figure also shows (in grey) the normal ionospheric behaviour expected based on the median VTEC from the 15 previous days.
The VTEC is expressed in TECu (with TECu=10^16 electrons per square meter) and is directly related to the signal propagation delay due to the ionosphere (in figure: delay on GPS L1 frequency).
The Sun's radiation ionizes the Earth's upper atmosphere, the ionosphere, located from about 60km to 1000km above the Earth's surface.The ionization process in the ionosphere produces ions and free electrons. These electrons perturb the propagation of the GNSS (Global Navigation Satellite System) signals by inducing a so-called ionospheric delay.
See http://stce.be/newsletter/GNSS_final.pdf for some more explanations ; for detailed information, see http://gnss.be/ionosphere_tutorial.php
The SIDC Space Weather Briefing
The Space Weather Briefing presented by the forecaster on duty from 30 July to 6 August. It reflects in images and graphs what is written in the Review of Space Weather: https://www.stce.be/briefings/20230807_SWbriefing.pdf
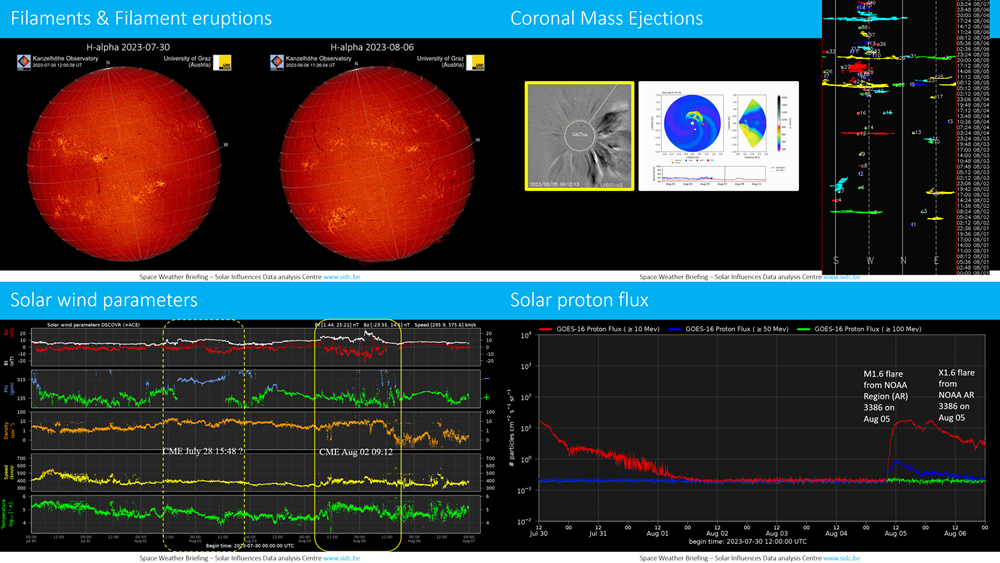
If you need to access the movies, contact us: stce_coordination at stce.be
Upcoming Activities
Check out our activity calendar: activities and encounters with the Sun-Space-Earth system and Space Weather as the main theme. We provide occasions to get submerged in our world through educational, informative and instructive activities.
If you want your event in our calendar, contact us: stce_coordination at stce.be
* Aug 21, Lecture: The Sun, VVS Summerschool, Leuven, Belgium
* Sep 9-10, Open Doors at the Humain Radioastronomy Station, Humain, Belgium
* Sep 18-20, STCE Space Weather Introductory Course, Brussels, Belgium - Registrations are open
* Sep 26, post-Space Weather Introductory Course, by JMG, Woensdrecht, The Netherlands - registration is included in the Sep SWIC
* Nov 18-19, e-SWAN Space Weather School: data, models and services, by the STCE, Toulouse, France
* Dec 4-6, STCE course: Space Weather impacts on ionospheric wave propagation - focus on GNSS and HF, Brussels, Belgium - Registrations are open
* Jan 22-24, 2024, STCE Space Weather Introductory Course, Brussels, Belgium - Registrations are open
* Jan 25, 2024, post-Space Weather Introductory Course, by JMG and MeteoWing, place TBD - registration is included in the Jan SWIC
Check: https://www.stce.be/calendar