- Table of Content
- 1.Solar Orbiter ...
- 2.Review of Spac...
- 3.PROBA2 Observa...
- 4.International ...
- 5.Geomagnetic Ob...
- 6.The SIDC Space...
- 7.Review of Iono...
- 8.Calendar
2. Review of Space Weather
3. PROBA2 Observations (14 Aug 2023 - 20 Aug 2023)
4. International Sunspot Number by SILSO
5. Geomagnetic Observations in Belgium
6. The SIDC Space Weather Briefing
7. Review of Ionospheric Activity
8. Calendar
Solar Orbiter Discovers Tiny Jets That Could Power the Solar Wind
The mystery about the source of the solar wind
ESA's Solar Orbiter spacecraft has discovered a multitude of tiny jets of material escaping from the Sun's outer atmosphere. Each jet lasts for between 20 and 100 seconds, and expels plasma at around 100 km/s. These jets could be the long-sought-after source of the solar wind.
The solar wind consists of charged particles, known as plasma, that continuously escape the Sun. When the solar wind collides with Earth's magnetic field, it produces the aurorae. Understanding how and where the solar wind is generated near the Sun has proven elusive and has been a key focus of study for decades. Now, observations by the Extreme Ultraviolet Imager (EUI) onboard Solar Orbiter have taken us an important step closer.
EUI is a telescope observing the Sun in extreme ultraviolet light. It is operated by the Royal Observatory of Belgium, and its unprecedented high-resolution and high-cadence images of the Sun's south pole on 30 March 2022 reveal a population of faint, short-lived features that are associated with small jets of million-degree plasma being ejected from the Sun's atmosphere. The results are reported in a paper just published in the Science journal.
Jets in coronal holes
Researchers have known for decades that a significant fraction of the solar wind is associated with magnetic structures called coronal holes, regions where the Sun's magnetic field does not turn back down into the Sun. Instead, the magnetic field stretches deep into the solar system. Plasma can flow along these open magnetic field lines. But the question was: how did the plasma get launched? The traditional assumption was that because the corona is hot, it will naturally expand and a portion of it will escape along the field lines, creating the solar wind.
"One of our results is that to a large extent, this flow is not actually steady and uniform, as was traditionally assumed. Rather, the ubiquity of the jets suggests that the solar wind from coronal holes might originate as a highly intermittent outflow," says Andrei Zhukov, Royal Observatory of Belgium, a collaborator on the work who led the Solar Orbiter observing campaign.
The ubiquity of the tiny jets implied by the new observations suggests that they are expelling a substantial fraction of the material we see in the solar wind. And there could be even smaller, more frequent events providing yet more. "I think it's a significant step to find something on the solar disk that certainly is contributing to the solar wind," says David Berghmans, Royal Observatory of Belgium, and principal investigator for the EUI instrument.
Observing the solar poles
In the next years, we expect EUI to register these tiny jets in a better perspective than now, as Solar Orbiter will gradually incline its orbit towards the polar regions. All involved will be eager to see what fresh insights they can collect because this work extends further than our own Solar System. The Sun is the only star whose atmosphere we can observe in such detail, but it is likely that the same process operates on other stars too. That turns these observations into the discovery of a fundamental astrophysical process.
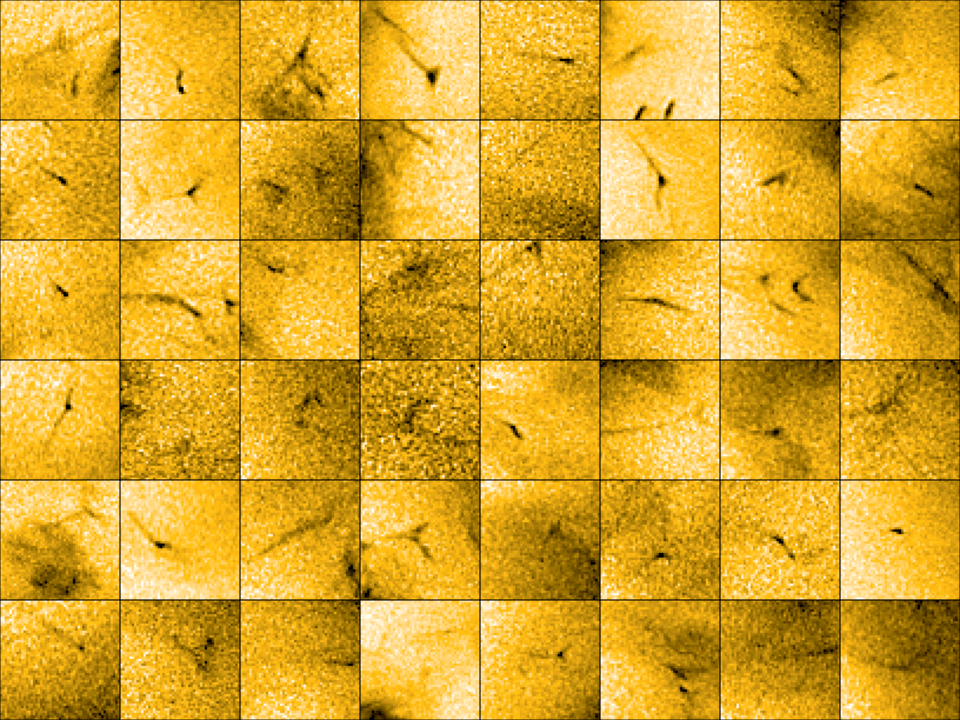
This mosaic of images shows a multitude of tiny jets of material escaping from the Sun's outer atmosphere. The images come from the EUI telescope onboard ESA's Solar Orbiter spacecraft. They show up as dark streaks across the solar surface in this mosaic. The images are 'negatives' meaning that although the jets are displayed as dark, there are really bright flashes against the solar surface. Each jet lasts for between 20 and 100 seconds, and expels charged particles, known as plasma, at around 100 km/s. These events could be the long-sought-after source of the solar wind, the constant outflow of charged particles that comes from the Sun and flows through the Solar System.

Movie: https://www.stce.be/EUI/picojets_nobkg_l5.mp4
This movie was taken by the EUI telescope onboard ESA's Solar Orbiter spacecraft. It shows a coronal hole near the Sun's south pole observed on 30 March 2022. Subsequent analysis has revealed many tiny jets taking place during the observation. They show up as little streaks of bright light across the image. Each one expels a quantity of charged particles, known as plasma, into space. These events could be the source of the solar wind, the constant outflow of charged particles that comes from the Sun and flows through the Solar System. Magnetic structures known as coronal holes are a source region of the solar wind. These are regions where the Sun's magnetic field does not turn back down into the Sun. Instead, it stretches into the Solar System. It could be that the tiny jets discovered in these images launch the plasma that feeds the solar wind, as they travel away from the Sun.
The circle indicates the size of the Earth for scale.
"Picoflare jets power the solar wind emerging from a coronal hole on the Sun" by L. P. Chitta et al. is published in Science, vol. 381, issue 6660, pages 867-872, doi: 10.1126/science.ade5801: https://www.science.org/doi/10.1126/science.ade5801
More details in the ESA story: https://www.esa.int/Science_Exploration/Space_Science/Solar_Orbiter/Solar_Orbiter_discovers_tiny_jets_that_could_power_the_solar_wind
Solar Orbiter is a space mission of international collaboration between ESA and NASA, operated by ESA. The EUI instrument was built by an international consortium led by the Centre Spatial de Liège and is operated since the launch (2020) by the Royal Observatory of Belgium (https://www.astro.oma.be), with funding and support from the Solar-Terrestrial Centre of Excellence (STCE) and the Belgian Federal Science Policy Office (BELSPO, https://www.belspo.be).
Review of Space Weather
Solar Active Regions (ARs) and flares
Solar flaring activity was at low levels. There was a total of 14 active regions observed on the visible solar disk over the week, most of these were relatively small and simple. The largest flare was an C8.9 flare, peaking at 21:10 UTC August 14. This flare was associated with NOAA AR 3405 near the east limb. This region and NOAA 3395 were most active at the start of the week. At the end of the week, NOAA 3409 and 3410 were responsible for most of the flaring activity.
Coronal Mass Ejections (CME)
There were no Earth-directed Coronal Mass Ejections (CMEs) detected in the available coronagraph observations.
Coronal Holes
A positive polarity coronal hole in the northern hemisphere and a negative polarity coronal hole in the southern hemisphere began to transit the central meridian on August 12 and 13, respectively. Later in the week, a small negative polarity coronal hole in the northern hemisphere also crossed the central meridian on August 18.
Proton flux levels near Earth
The greater than 10 MeV GOES proton flux was at nominal levels.
Electron fluxes at GEO
The greater than 2 MeV electron flux was elevated for the first half of the week, between August 13 and 16, reaching the 1000 pfu threshold. It began to decrease from August 16 and then remained at nominal levels. The 24h electron fluence was at nominal to moderate levels at the start of the week decreasing to nominal levels from August 17.
Solar wind at L1
At the start of the week, the solar wind conditions reflected a gradual return to a background slow solar wind regime. The solar wind speed decreased from 450 km/s on August 13 to around 300 km/s on August 16. On August 16 and 17 the speed then increased slightly to around 350 km/s and the interplanetary magnetic field phi angle switched into the positive sector. From around 03:00 UTC on August 18, the solar wind speed increased sharply to 450 km/s with the arrival of the High Speed Stream (HSS) from the negative polarity coronal hole. The speed then continued to gradually increase, reaching peak values near 700 km/s on August 20. The interplanetary magnetic field also increased on August 18, with a maximum of 15nT and a minimum Bz of -12nT. However, Bz fluctuated between positive and negative values.
Geomagnetism
The geomagnetic conditions were mostly quiet to unsettled throughout the week. On August 16 and 19, there were two short intervals of active conditions locally (K-Bel = 4).
PROBA2 Observations (14 Aug 2023 - 20 Aug 2023)
Solar Activity
Solar flare activity was low during the week.
In order to view the activity of this week in more detail, we suggest to go to the following website from which all the daily (normal and difference) movies can be accessed: https://proba2.oma.be/ssa
This page also lists the recorded flaring events.
A weekly overview movie can be found here (SWAP week 699). https://proba2.sidc.be/swap/data/mpg/movies/weekly_movies/weekly_movie_2023_08_14.mp4
No particular event was to be highlighted.
International Sunspot Number by SILSO
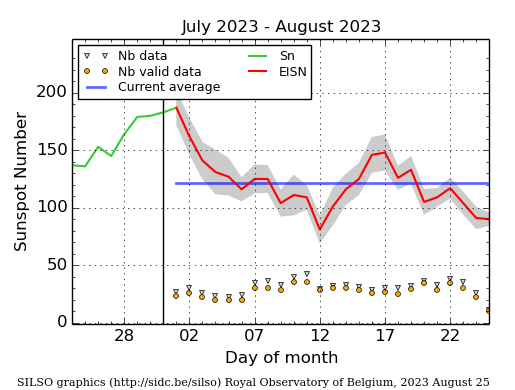
The daily Estimated International Sunspot Number (EISN, red curve with shaded error) derived by a simplified method from real-time data from the worldwide SILSO network. It extends the official Sunspot Number from the full processing of the preceding month (green line), a few days more than one solar rotation. The horizontal blue line shows the current monthly average. The yellow dots give the number of stations that provided valid data. Valid data are used to calculate the EISN. The triangle gives the number of stations providing data. When a triangle and a yellow dot coincide, it means that all the data is used to calculate the EISN of that day.
Geomagnetic Observations in Belgium
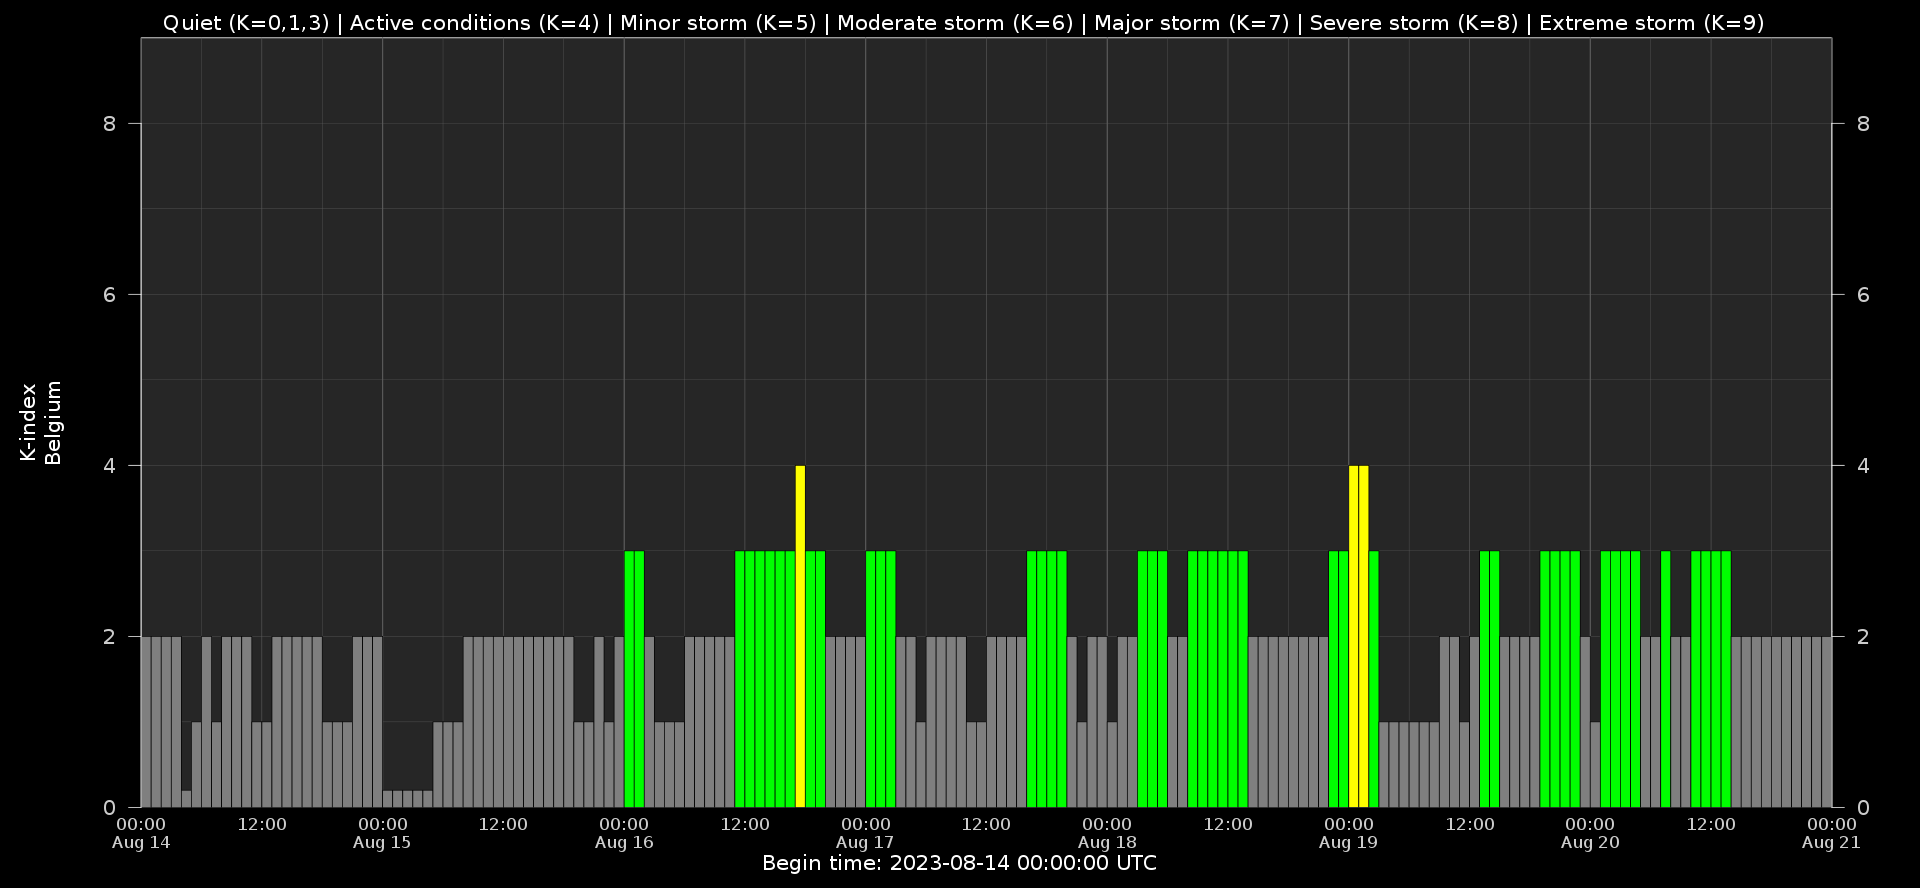
Local K-type magnetic activity index for Belgium based on data from Dourbes (DOU) and Manhay (MAB). Comparing the data from both measurement stations allows to reliably remove outliers from the magnetic data. At the same time the operational service availability is improved: whenever data from one observatory is not available, the single-station index obtained from the other can be used as a fallback system.
Both the two-station index and the single station indices are available here: http://ionosphere.meteo.be/geomagnetism/K_BEL/
The SIDC Space Weather Briefing
The Space Weather Briefing presented by the forecaster on duty from Aug 14 to 20. It reflects in images and graphs what is written in the Solar and Geomagnetic Activity report: https://www.stce.be/briefings/20230821_SWbriefing.pdf
If you need to access the movies, contact us: stce_coordination at stce.be
Review of Ionospheric Activity
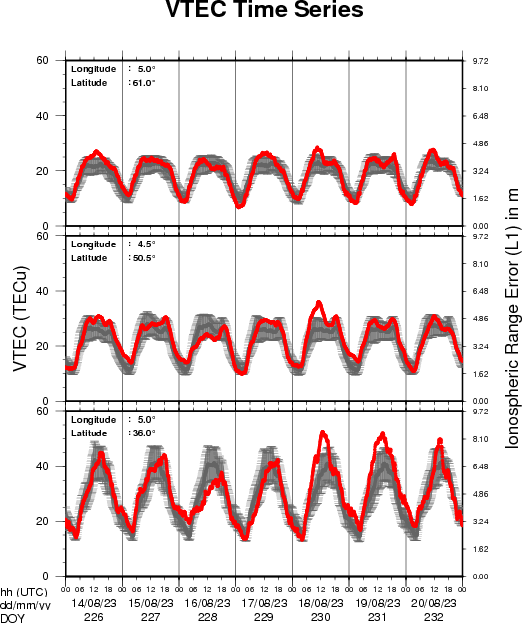
The figure shows the time evolution of the Vertical Total Electron Content (VTEC) (in red) during the last week at three locations:
a) in the northern part of Europe(N 61deg E 5deg)
b) above Brussels(N 50.5deg, E 4.5 deg)
c) in the southern part of Europe(N 36 deg, E 5deg)
This figure also shows (in grey) the normal ionospheric behaviour expected based on the median VTEC from the 15 previous days.
The VTEC is expressed in TECu (with TECu=10^16 electrons per square meter) and is directly related to the signal propagation delay due to the ionosphere (in figure: delay on GPS L1 frequency).
The Sun's radiation ionizes the Earth's upper atmosphere, the ionosphere, located from about 60km to 1000km above the Earth's surface.The ionization process in the ionosphere produces ions and free electrons. These electrons perturb the propagation of the GNSS (Global Navigation Satellite System) signals by inducing a so-called ionospheric delay.
See http://stce.be/newsletter/GNSS_final.pdf for some more explanations ; for detailed information, see http://gnss.be/ionosphere_tutorial.php
Calendar
Check out our activity calendar: activities and encounters with the Sun-Space-Earth system and Space Weather as the main theme. We provide occasions to get submerged in our world through educational, informative and instructive activities.
If you want your event in our calendar, contact us: stce_coordination at stce.be
* Sept 9-10, Open Doors at the Humain Radioastronomy Station, Humain, Belgium
* Sept 12-13, PITHIA-NRF Fifth Training for Partners, London, UK
* Sep 18-20, STCE Space Weather Introductory Course, Brussels, Belgium - full
* Sep 26, post-Space Weather Introductory Course, by JMG, registration is included in the Sep SWIC
* Nov 18-19, e-SWAN Space Weather School: data, models and services, by the STCE, Toulouse, France
* Dec 4-6, STCE course: Space Weather impacts on ionospheric wave propagation - focus on GNSS and HF, Brussels, Belgium - Registrations are open
* Jan 22-24, 2024, STCE Space Weather Introductory Course, Brussels, Belgium - Registrations are open
* Jan 25, 2024, post-Space Weather Introductory Course, by JMG and MeteoWing, place TBD - registration is included in the Jan SWIC
Check: https://www.stce.be/calendar