- Table of Content
- 1.Switch!
- 2.New Guest Inve...
- 3.E-SWAN webinar...
- 4.Review of Spac...
- 5.International ...
- 6.PROBA2 Observa...
- 7.Noticeable Sol...
- 8.Review of Iono...
- 9.Geomagnetic Ob...
- 10.The SIDC Space...
- 11.Upcoming Activ...
2. New Guest Investigator Call: visit the EUI, SWAP and LYRA PI teams in Brussels in 2024!
3. E-SWAN webinars on the Environmental Sustainability of Space Activities
4. Review of Space Weather
5. International Sunspot Number by SILSO
6. PROBA2 Observations (4 Sep 2023 - 10 Sep 2023)
7. Noticeable Solar Events
8. Review of Ionospheric Activity
9. Geomagnetic Observations in Belgium
10. The SIDC Space Weather Briefing
11. Upcoming Activities
Switch!
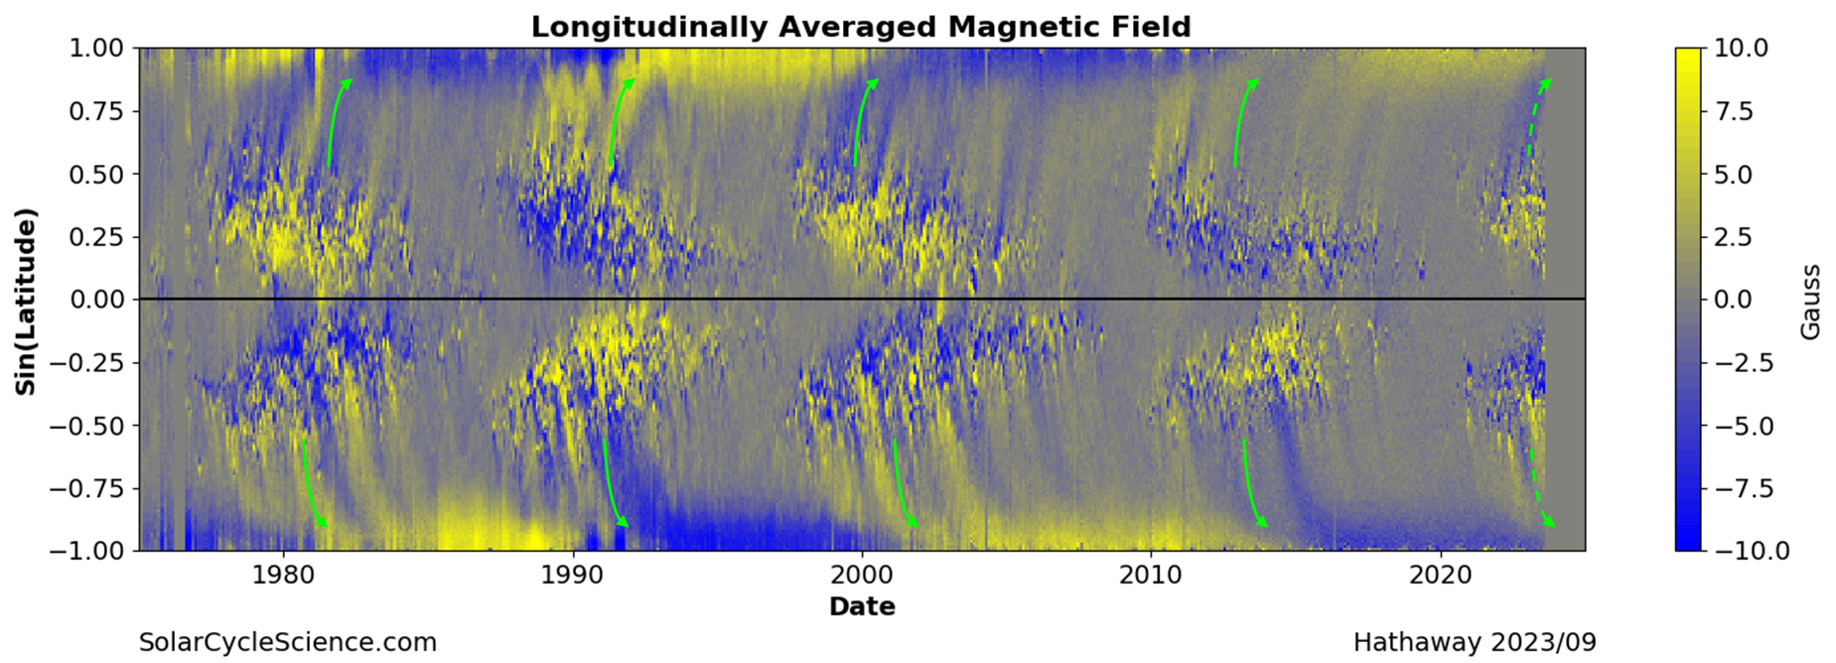
Each solar cycle, during the period of maximum activity, the magnetic field at the solar poles disappears and gets replaced by a magnetic field of opposite polarity. These reversals are a key feature of the solar dynamo: the physical process that generates the Sun's magnetic field necessary for the creation of sunspots and other magnetic phenomena. This switch of the polar magnetic fields does not take place overnight. Indeed, it may take several months and longer before they are permanently established. The old polar field is replaced by opposite polarity field from the magnetic remnants of active regions, being transported towards the poles by the Sun's magnetic conveyor belt, as tree leaves floating on a rippling creek. This is a slow process as can be seen in the figure underneath from the SolarCycleScience page (http://solarcyclescience.com/ ), annotated by green arrows indicating the movement from the active region belt towards the solar poles (yellow is positive polarity, blue negative). This reversal can take place at different times for the poles, and may also be of different duration. For example, during the previous solar cycle, the polar field reversal at the southern pole was completed in just a few months around mid-2013, whereas for the northern pole the reversal started around mid-2012 and was only completed late 2014 (Mierla et al. 2020 - https://link.springer.com/article/10.1007/s11207-020-01635-x ).
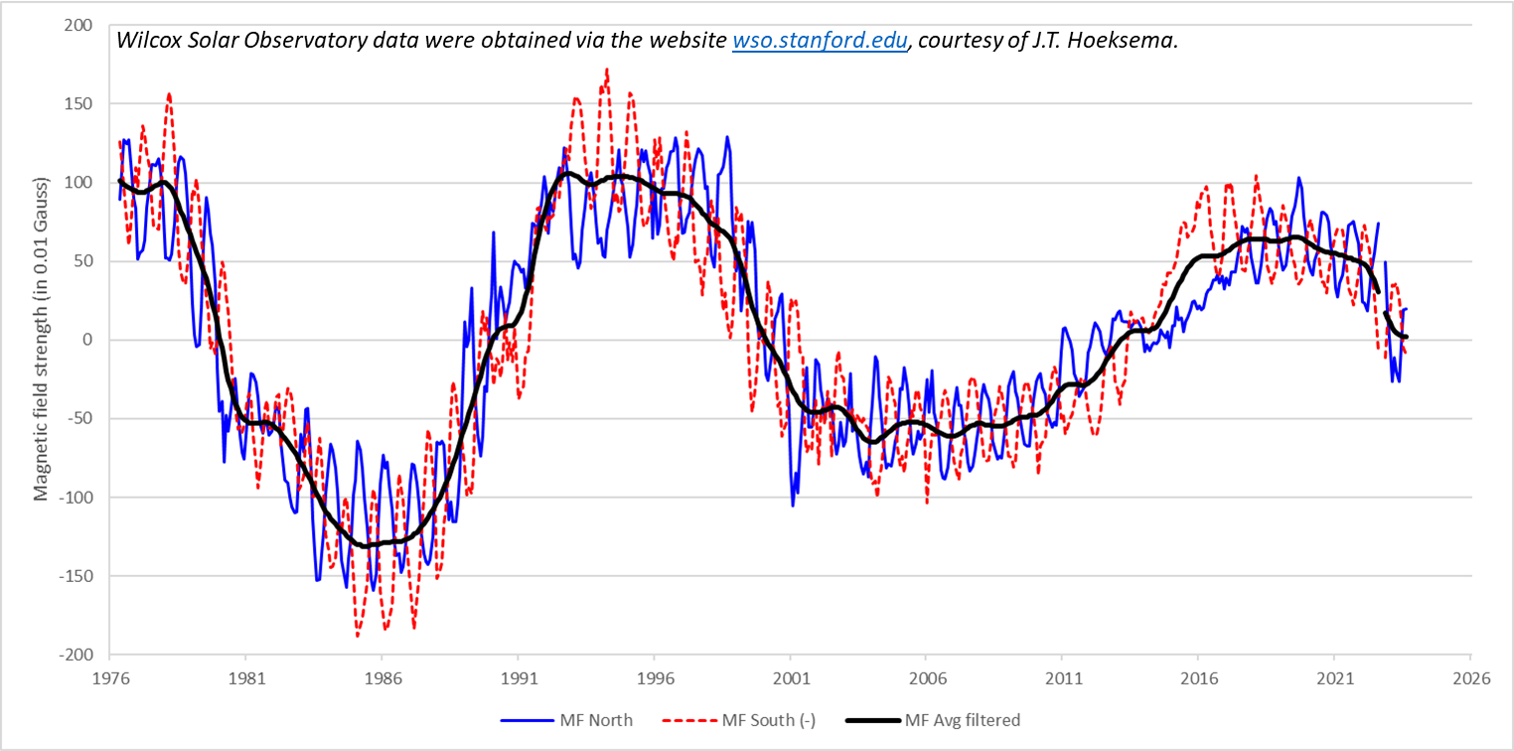
Recent measurements by the Wilcox Solar Observatory (WSO , http://wso.stanford.edu/ ) of the Sun's polar magnetic fields seem to indicate that the polar field reversal has started. In the graph underneath, polar magnetic field strength (WSO) is shown per month and per solar hemisphere (solid blue: north pole, dashed red: south pole) as well as the average value (thick black line). Note that the sign of the south polar magnetic fields has been reversed. The magnetic field strength is expressed in units of 0.01 Gauss. The ups-and-downs in the curves for the north and south polar region are due to a seasonal effect: in the course of a year, as the Earth orbits the Sun, the instruments have a better look on the Sun's southern polar region during the January-April timeframe, and a better view on the northern polar region during the July-October period. The average magnetic field strength (black curve) has been filtered such that (most of) these ups-and-downs have been removed. The graph shows that the magnetic polarity for both polar regions has already been reversed briefly, but not permanently. Based on the available data points (last 4 solar cycles), the reversal at a single pole may take 1.5 years (median), with an uncertainty of one year. In view of the different evolution of the reversals at the different poles, and because of the long time a field reversal may take, it's no suprize that for several months around solar maximum, the Sun may exhibit two poles both with the same magnetic polarity. This creates very complex magnetic structures around the Sun, which in turn affect the rest of the solar system and helps for example to further reduce access of the cosmic rays to the earth environment - see the SC25 Tracking page at https://www.stce.be/content/sc25-tracking#cosmicrays . When the filtered average magnetic field (black curve) reaches 0 Gauss, it usually takes another 6 months (median) before the smoothed monthly international sunspot number (ISN - SILSO https://www.sidc.be/SILSO/home ) reaches its maximum, albeit with an uncertainty of again 12 months. The current filtered average magnetic field strength is near 0 Gauss, but not yet. A solar cycle maximum in 2024 is certainly possible.
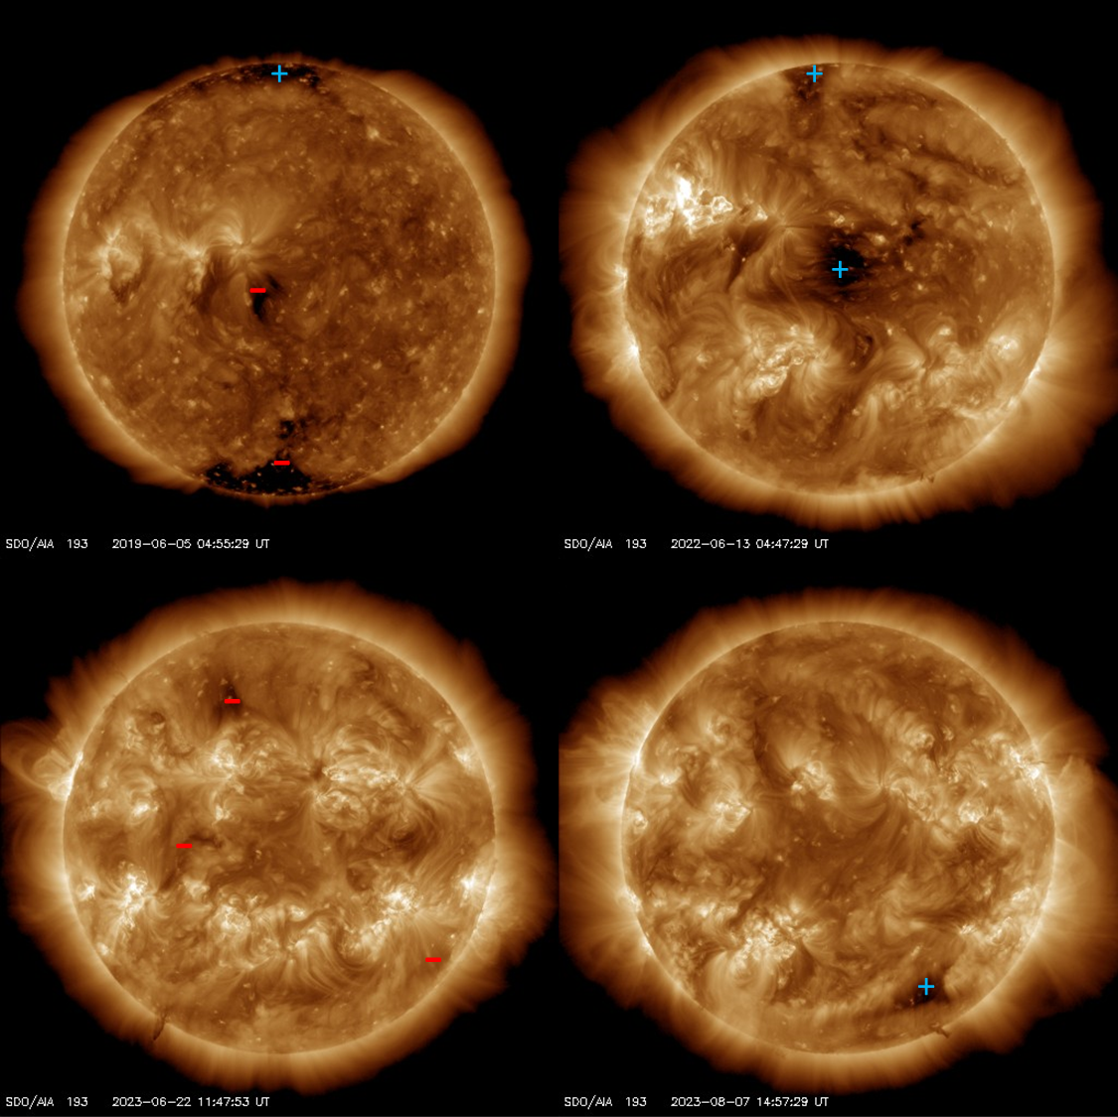
All this magnetic restructuring has also had its impact on the polar coronal holes, similar to what has been described in this STCE newsitem at https://www.stce.be/news/423/welcome.html for the previous solar cycle. Indeed, since a couple of months, these polar sources of the high-speed solar wind have mostly disappeared, with only and occasionally a few weak patches of the old magnetic polarity visible. At the same time, some more prominent (though still small) coronal holes have started developing at latitudes of 50-60 degrees, but more importantly having occasionally already the new magnetic polarity. This means e.g. that at the northern polar region, the old positive magnetic polarity coronal holes have nearly disappeared, and small high-latitude negative polarity coronal holes are occasionally visible. Near the southern hemisphere, the same evolution has been observed, but with opposite polarities. See the annotated SDO/AIA 193 images (https://sdo.gsfc.nasa.gov/data/aiahmi/ ) underneath showing the mature resp. small polar coronal holes in June 2019 resp. June 2022, and the small high-latitude opposite polarity coronal holes during the summer of 2023. The "+" and "-" signs indicate positive resp. negative magnetic polarity as indicated on the NOAA/SWPC solar synoptic maps (https://www.swpc.noaa.gov/products/solar-synoptic-map ). So, the currently small-sized high-latitude coronal holes are expected to further develop during and after the polar field reversal, to fully establish fresh polar coronal holes but with a magnetic polarity opposite to that of the previous solar cycle, i.e. a northern polar coronal hole with a negative instead of a positive magnetic polarity, and a southern polar coronal hole with a positive instead of a negative magnetic polarity. But please don't leave your sleep for it: it's going to take a year or two before those new polar coronal holes will have fully matured.
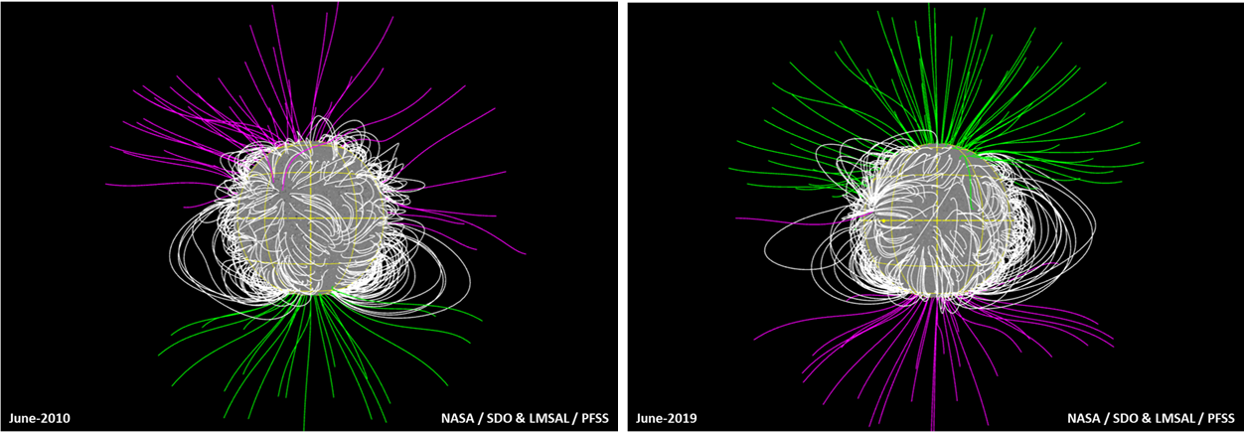
In the online version of this newsitem at https://www.stce.be/news/664/welcome.html , there's a clip that shows the evolution of the overall solar magnetic field for each year (around 5 June) since 2010, represented by a selection of field lines that have been computed from the long-running PFSS model at the Lockheed Martin Solar and Astrophysics Laboratory (LMSAL - https://sdowww.lmsal.com/sdomedia/SunInTime/webgl_tool/sv4/ ). The Potential-field Source-surface (PFSS) model provides a simple and effective tool for the large-scale features of the global coronal magnetic field. The color of the fieldlines is based on whether they are closed (white) or open (green or magenta, representing positive ("outgoing") resp. negative ("returning") magnetic polarity). The surface magnetic map is based on a flux-transport model of the solar photosphere, with magnetogram data from SDO/HMI inserted at regular intervals (Schrijver and DeRosa, 2003 - https://doi.org/10.1023/A:1022908504100 ). The clip nicely captures the polar field reversal during the previous solar cycle, as well as that it takes a while before a new stable dipolar structure has been established. The last frames also indicate a new polar field reversal is at hand. Note similar clips can be made with the SWHelioviewer software (SWHV - http://swhv.oma.be/user_manual/), which uses a slightly different model and a different source for the magnetograms.
New Guest Investigator Call: visit the EUI, SWAP and LYRA PI teams in Brussels in 2024!
The EUI and SWAP/LYRA PI teams welcome research proposals for the 2024 round of its Guest Investigator Program for research based on EUI, SWAP or LYRA data analysis by scientists outside the PI teams.
Selected proposers will be invited to spend a few weeks with the PI team at the Royal Observatory in Brussels to obtain expert knowledge on the instruments, to participate in the planning of observations according to the needs of their proposal, and to conduct their research. Each Guest Investigator will get reimbursed for travel, accommodation and living expenses.
Proposals must be received by November 1, 2023 (23:59 CET) and visits should be scheduled in 2024.
Details on how to apply to the Guest Investigator program can be found in the 2024 call: https://www.sidc.be/GuestInvestigator/GI_call_2024 .
E-SWAN webinars on the Environmental Sustainability of Space Activities
As scientists we are not only observing our physical environment but we have -unfortunately- also an impact on it. In particular the sustainability of space sciences can be questioned, given its dependence on international collaborations, large data infrastructure and assets in space.
E-SWAN, the European organisation for space weather and space climate, has set up a working group to examine the environmental impacts of its activities, and to search for alternative, less damaging, ways of working. This E-SWAN WG8 Sustainability aims at sharing information that empowers our community to make adequate choices to progressively reduce its carbon footprint and environmental impact.
More info on E-SWAN: https://eswan.eu/
More info on WG8 Sustainability: https://eswan.eu/index.php/about-e-swan/workinggroups
Following this objective, the WG will, starting in September 2023, organise regular webinars on topics pertaining to the sustainability of our activities and practices as space scientists.
The first webinar of this series will discuss the digital sustainability, and will take place on September 21, 2023 at 15:00 CEST.
All details on the seminar can be found here: https://www.stce.be/content/e-swan-sustainability-seminar-energy-challenges-digital-technology-and-artificial
Review of Space Weather
Solar Active Regions (ARs) and flares
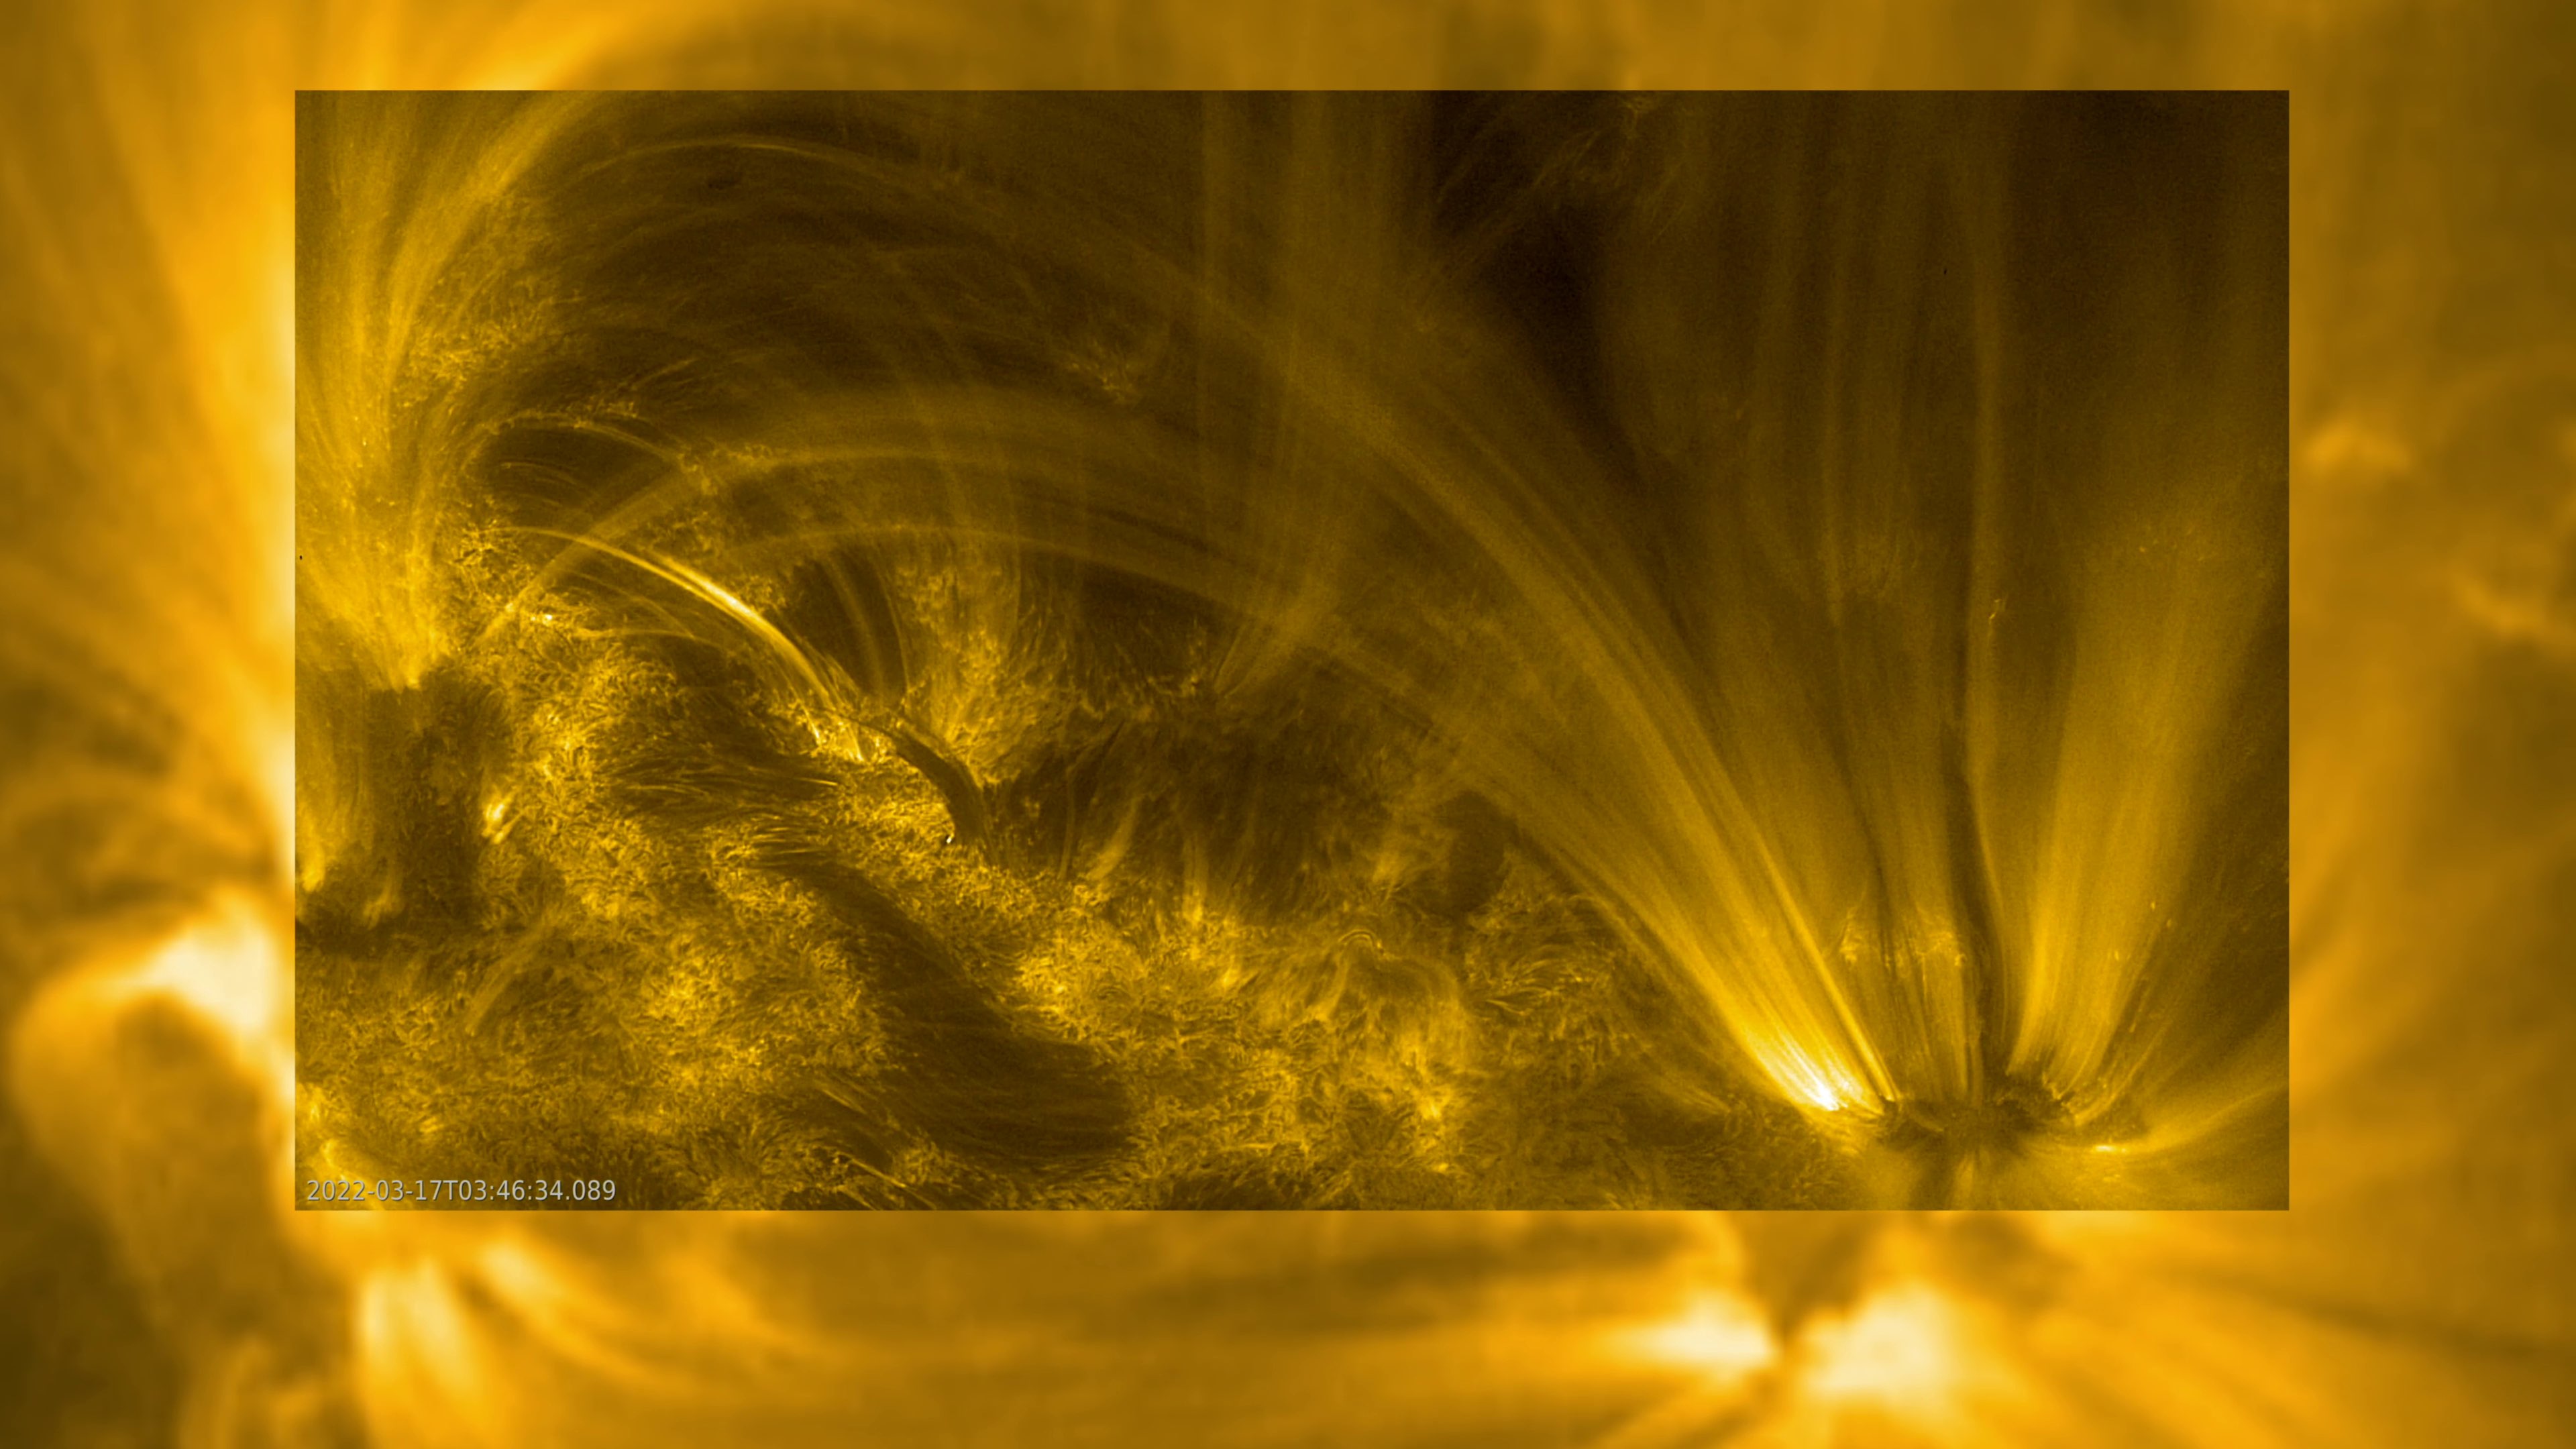
During this week, 13 active regions were observed on the side of the Sun as seen from Earth. Most of the time, the majority of the observed active regions had a beta configuration of the photospheric magnetic field. The solar flaring activity resulted in four M-class and 48 C-class flares reported by GOES. The majority of the flaring activity originated from the Catania sunspot group 41 (NOAA AR 3421) which produced 3 of the 4 M-class flares. The strongest flare recorded this week was the GOES M2.1 flare which peaked at 19:09 UTC on September 7. This flare originated from the Catania sunspot group 48 (NOAA AR 3425). Underneath is an extreme ultraviolet (EUV) image of this event provided by SDO/AIA 094.

Coronal mass ejections (CMEs)
During this week, there were five wide CMEs reported and none of them was expected to arrive at Earth. Four halo CMEs had the source region on the far side of the Sun as seen from Earth. The fifth wide CME originated from a source region situated at and behind the east solar limb.
- The full halo CME, first seen in the SOHO/LASCO C2 field of view at about 14:12 UTC on September 5, had a velocity of about 1000 km/s (as reported by CACTus software). The source region of the CME was situated at and behind the west solar limb. Due to this position of the CME's source region, the CME was not expected to arrive to Earth.
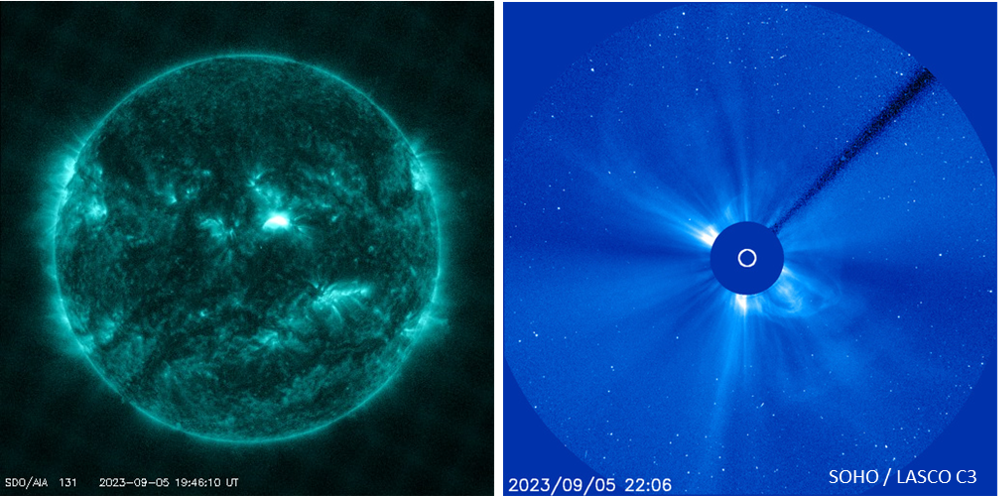
- The second full halo CME on September 5 was first seen in the SOHO/LASCO C2 field of view at about 20:24 UTC. The CME had a velocity of about 1300 km/s (as reported by the CACTus software). As the CME was temporarily very well synchronized with the M1.2 flare originating from the center of the disk active region, it was at first erroneously associated with the flare. When more data became available, it was found that also this halo CME had a source region on the far side of the Sun. A EUV view on the M1 flare and a coronagraphic image of the (far side) CME can be found underneath.
- The faint halo CME observed on September 7, was first seen in the SOHO/LASCO C2 field of view at about 13:25 UTC. This CME was not detected by CACTUS. Its source region was also at the far side of the Sun as seen from Earth.
- The fourth full halo CME observed this week was first seen in the SOHO/LASCO C2 field of view at about at 11:36 UTC on September 8. There were no on disk signatures of this CME observed in the EUV data, and from the shape of the CMEs it was concluded that this CME originated from the same, behind the west solar limb, active region as the first and third halo CMEs.
- Finally, a bright partial halo CME with an angular width of about 130 degrees was first observed (above the east solar limb) in the SOHO/LASCO C2 field of view at about 02:24 UTC on September 8. The source region of this CME was at and behind the east solar limb and CME was not expected to arrive to Earth.
Coronal holes
During this week, four small coronal holes were observed to rotate across the central meridian, three of them had negative polarity and one was of a positive polarity. The elongated, negative polarity coronal hole situated on the northern solar hemisphere reached the central meridian already at the beginning of the week, on September 3. The second and third coronal hole observed this week were both small and had a circular shape. They also had a negative polarity and they crossed the central meridian on September 6 and September 10. The only positive polarity coronal hole observed this week was situated on the northern solar hemisphere and it reached the central meridian on September 10.
Proton flux levels
The greater than 10 MeV proton flux was at the background level during the whole week.
Electron fluxes at GEO
During most of the week the greater than 2 MeV electron flux was fluctuating around the 1000 pfu threshold. During the first part of the week, the 24h electron fluence was at moderate to normal levels. From the middle of the week onwards, it decreased to normal levels.
Solar wind
During most of the week, the solar wind was fluctuating between 300 and 400 km/s. On September 5 at about 14:40 UTC, the in situ data showed the sudden simultaneous jump of the solar wind magnetic field, velocity, density and temperature indicating the arrival of a shock wave. This shock was possibly associated with one of the two halo CMEs observed on September 1. The shock was followed only by the post shock sheath-region without any clear signature of the ICME.
Geomagnetism
During most of the week, the geomagnetic conditions were quiet to unsettled. The arrival of the shock wave on September 5 was followed by two longer intervals of negative values for the Bz component of the interplanetary magnetic field magnitude (down to -9 nT) which resulted in disturbed geomagnetic conditions. The local station at Dourbes reported K=3 and NOAA reported Kp=4.
International Sunspot Number by SILSO
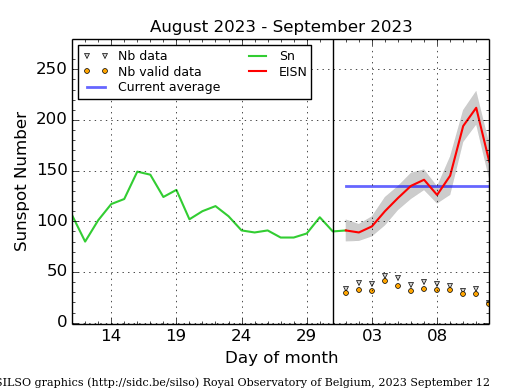
The daily Estimated International Sunspot Number (EISN, red curve with shaded error) derived by a simplified method from real-time data from the worldwide SILSO network. It extends the official Sunspot Number from the full processing of the preceding month (green line), a few days more than one solar rotation. The horizontal blue line shows the current monthly average. The yellow dots give the number of stations that provided valid data. Valid data are used to calculate the EISN. The triangle gives the number of stations providing data. When a triangle and a yellow dot coincide, it means that all the data is used to calculate the EISN of that day.
PROBA2 Observations (4 Sep 2023 - 10 Sep 2023)
Solar Activity
Solar flare activity fluctuated from low to moderate during the week.
In order to view the activity of this week in more detail, we suggest to go to the following website from which all the daily (normal and difference) movies can be accessed: https://proba2.oma.be/ssa
This page also lists the recorded flaring events.
A weekly overview movie can be found here (SWAP week 702). https://proba2.oma.be/swap/data/mpg/movies/weekly_movies/weekly_movie_2023_09_04.mp4
Details about some of this week's events can be found further below.
If any of the linked movies are unavailable they can be found in the P2SC movie repository here https://proba2.oma.be/swap/data/mpg/movies/
Thursday Sep 07
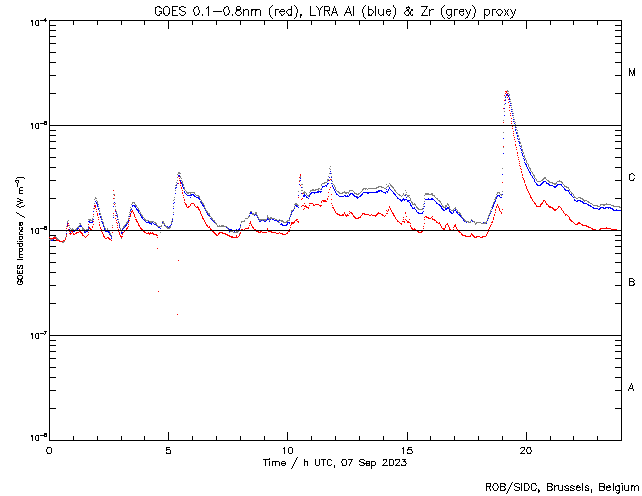
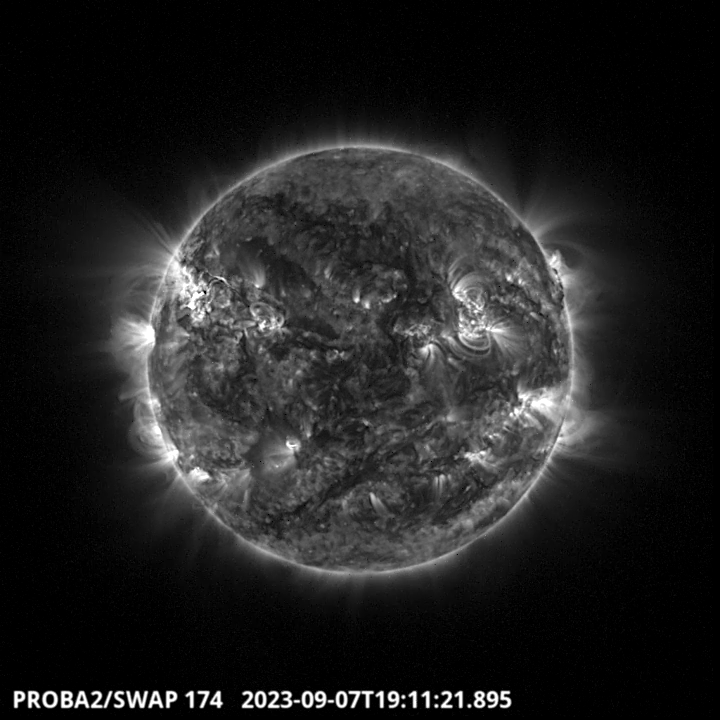
A M2.1 flare was produced by the active region 3425 on the North-East part of the solar disk around 19:11 UT. This event is shown in the LYRA and SWAP image above. Find a SWAP movie of the event here. https://proba2.sidc.be/swap/movies/20230907_swap_movie.mp4
Noticeable Solar Events
| DAY | BEGIN | MAX | END | LOC | XRAY | OP | 10CM | TYPE | Cat | NOAA |
| 05 | 0803 | 0812 | 0824 | N16W4 | M2.0 | 1N | III/1 | 41 | 3421 | |
| 05 | 1933 | 1945 | 1957 | N16W10 | M1.2 | 1N | 41 | 3421 | ||
| 05 | 2321 | 2339 | 2353 | N15W13 | M1.0 | 1F | 41 | 3421 | ||
| 07 | 1858 | 1909 | 1924 | N22E56 | M2.1 | 1B | III/1II/2 | 48 | 3425 |
| LOC: approximate heliographic location | TYPE: radio burst type |
| XRAY: X-ray flare class | Cat: Catania sunspot group number |
| OP: optical flare class | NOAA: NOAA active region number |
| 10CM: peak 10 cm radio flux |
Review of Ionospheric Activity
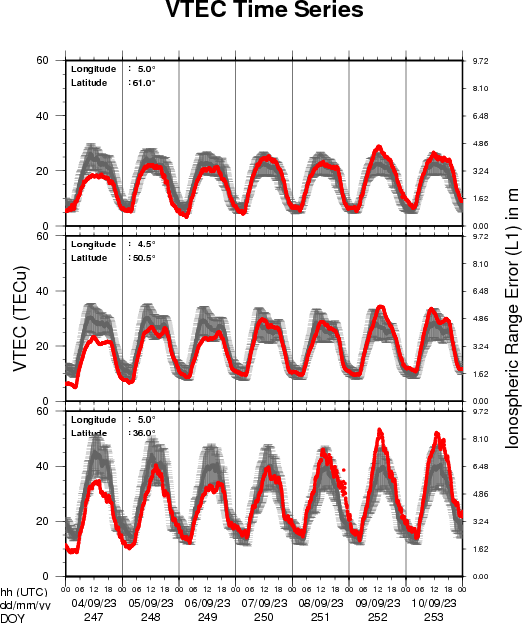
The figure shows the time evolution of the Vertical Total Electron Content (VTEC) (in red) during the last week at three locations:
a) in the northern part of Europe(N 61deg E 5deg)
b) above Brussels(N 50.5deg, E 4.5 deg)
c) in the southern part of Europe(N 36 deg, E 5deg)
This figure also shows (in grey) the normal ionospheric behaviour expected based on the median VTEC from the 15 previous days.
The VTEC is expressed in TECu (with TECu=10^16 electrons per square meter) and is directly related to the signal propagation delay due to the ionosphere (in figure: delay on GPS L1 frequency).
The Sun's radiation ionizes the Earth's upper atmosphere, the ionosphere, located from about 60km to 1000km above the Earth's surface.The ionization process in the ionosphere produces ions and free electrons. These electrons perturb the propagation of the GNSS (Global Navigation Satellite System) signals by inducing a so-called ionospheric delay.
See http://stce.be/newsletter/GNSS_final.pdf for some more explanations ; for detailed information, see http://gnss.be/ionosphere_tutorial.php
Geomagnetic Observations in Belgium
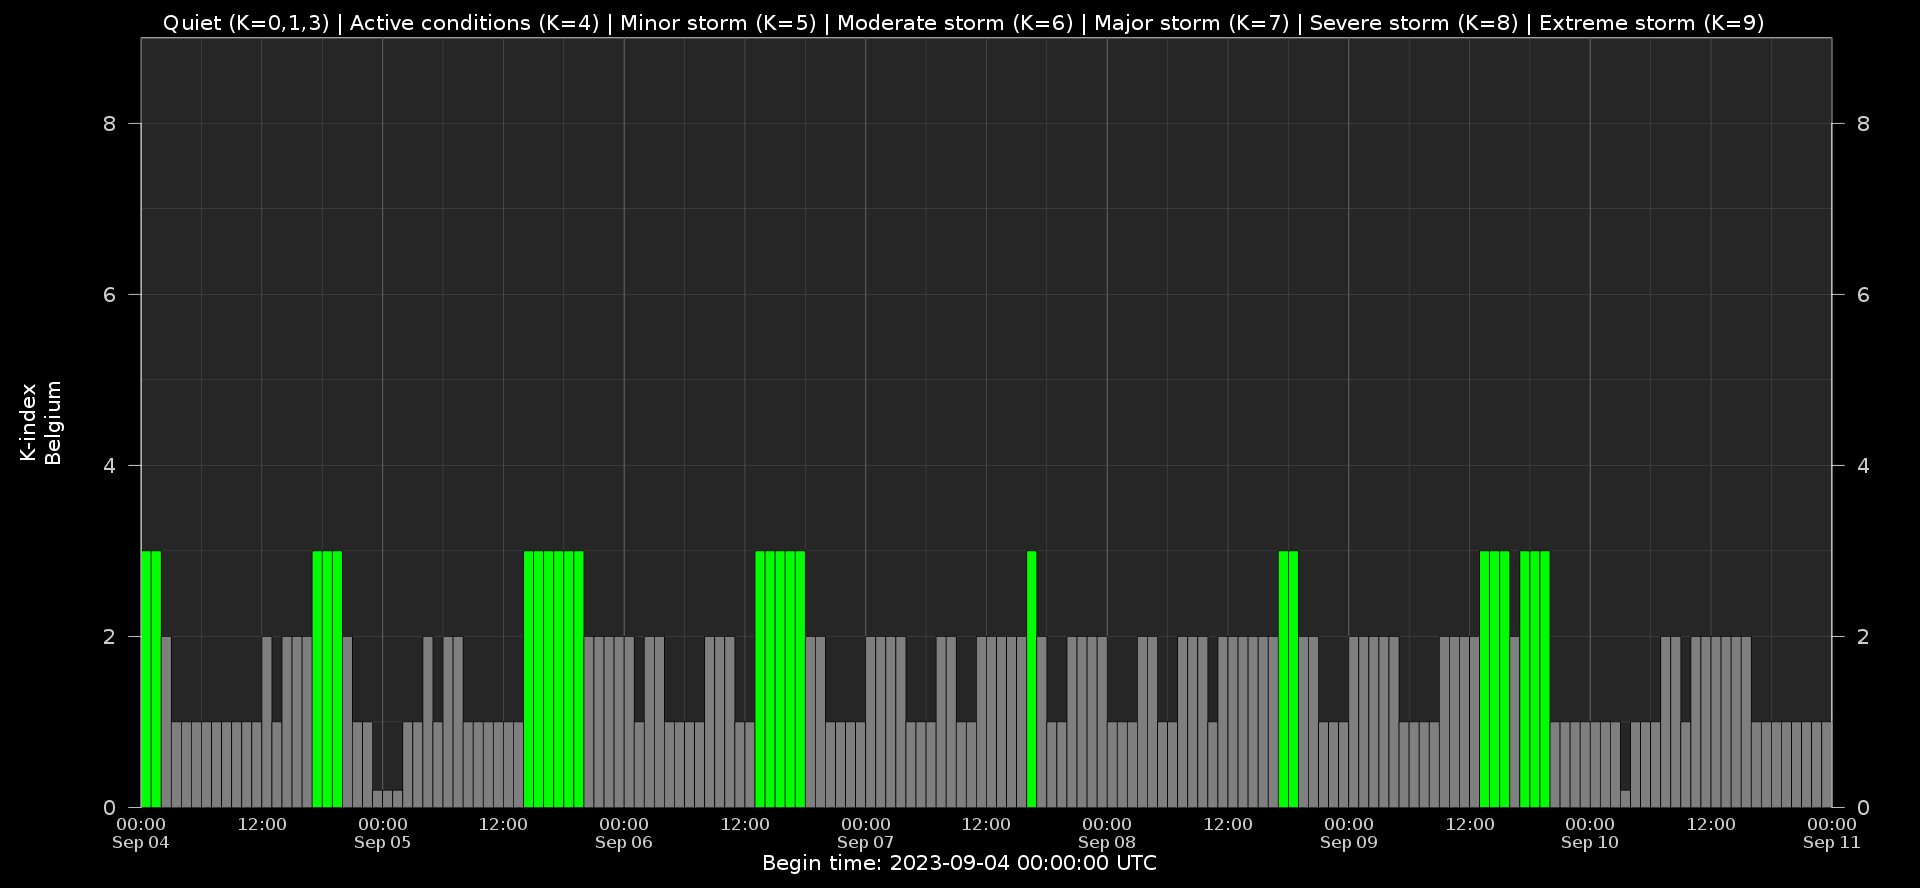
Local K-type magnetic activity index for Belgium based on data from Dourbes (DOU) and Manhay (MAB). Comparing the data from both measurement stations allows to reliably remove outliers from the magnetic data. At the same time the operational service availability is improved: whenever data from one observatory is not available, the single-station index obtained from the other can be used as a fallback system.
Both the two-station index and the single station indices are available here: http://ionosphere.meteo.be/geomagnetism/K_BEL/
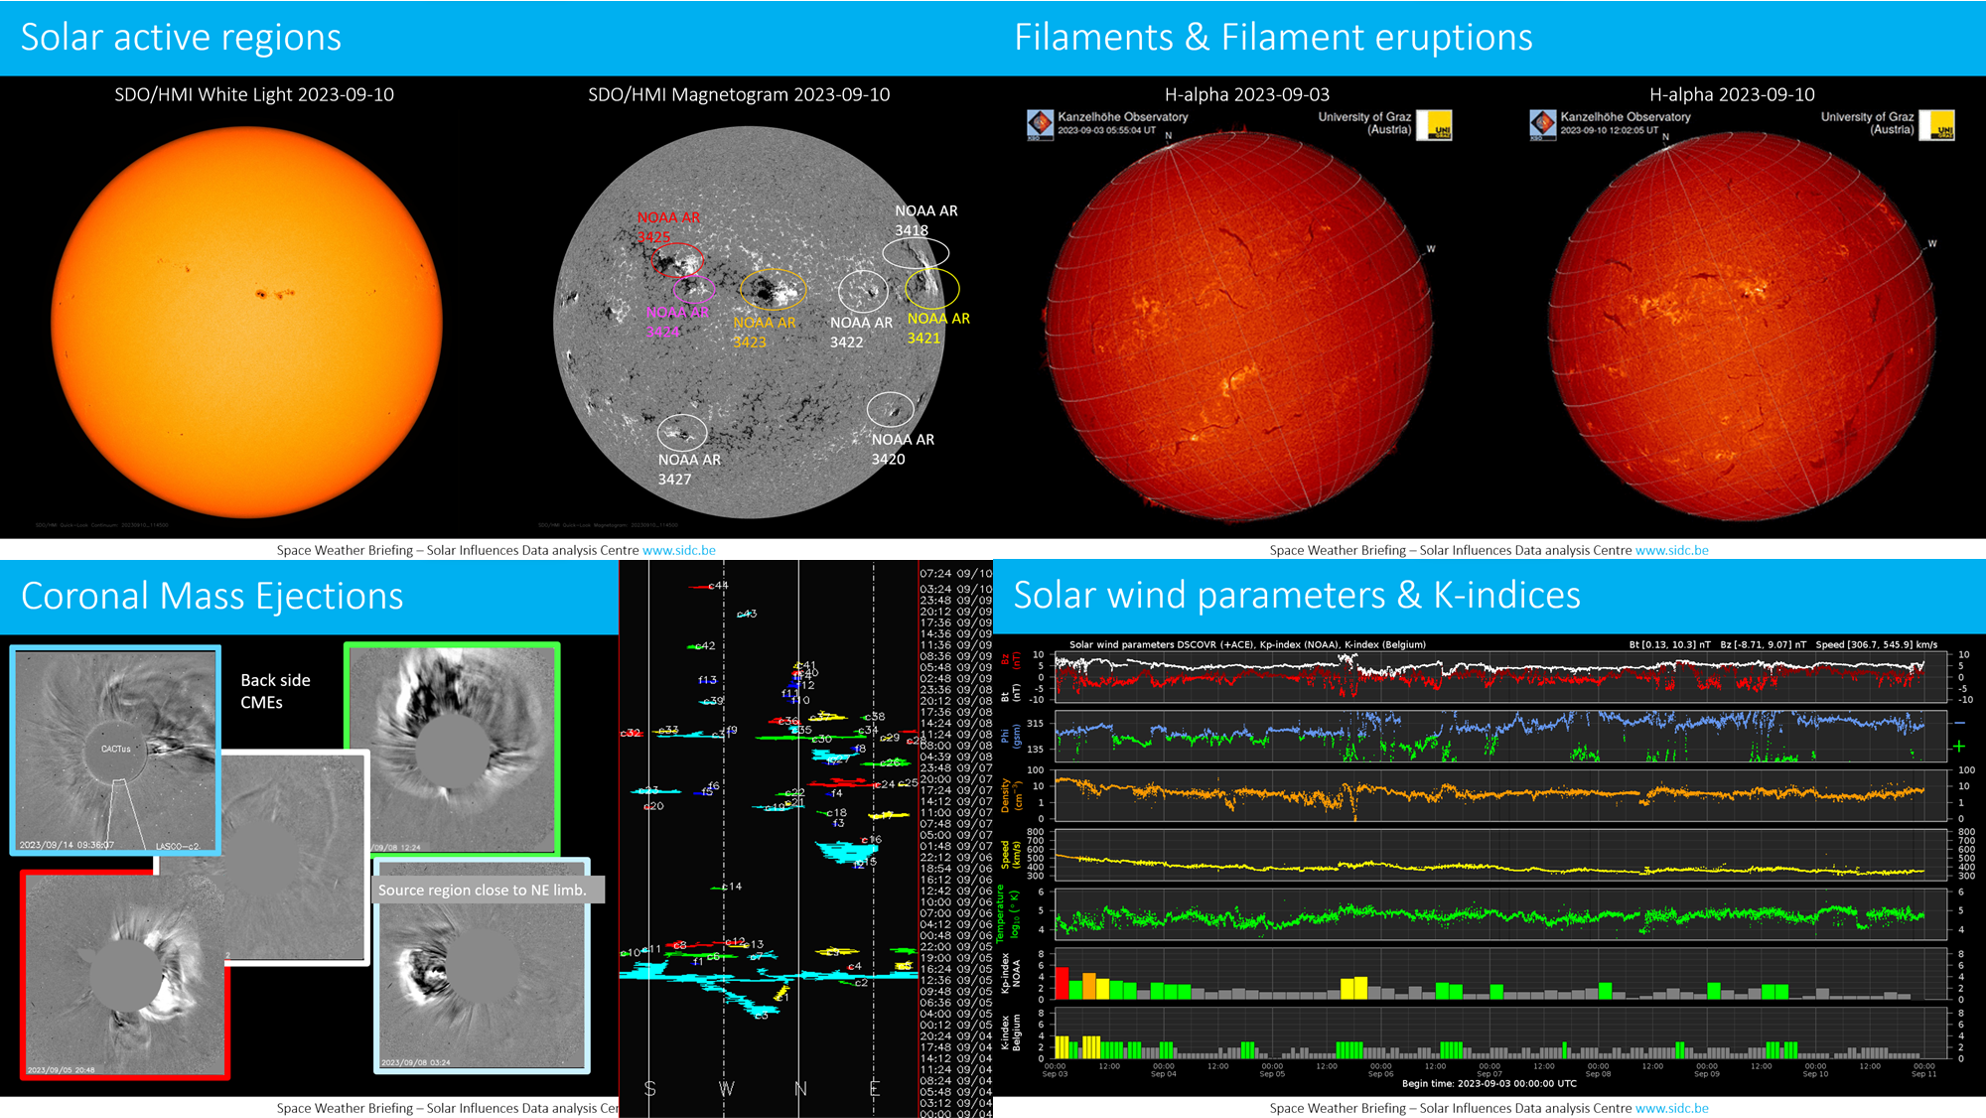
The SIDC Space Weather Briefing
The Space Weather Briefing presented by the forecaster on duty from 4 to 10 September. It reflects in images and graphs what is written in the Review of Space Weather: https://www.stce.be/briefings/20230911_SWbriefing.pdf
If you need to access the movies, contact us: stce_coordination at stce.be
Upcoming Activities
Check out our activity calendar: activities and encounters with the Sun-Space-Earth system and Space Weather as the main theme. We provide occasions to get submerged in our world through educational, informative and instructive activities.
If you want your event in our calendar, contact us: stce_coordination at stce.be
* Sep 18-20, STCE Space Weather Introductory Course, Brussels, Belgium - full
* Sep 21, E-SWAN Sustainability Seminar: The energy challenges of digital technology and artificial intelligence, by David Hill
* Sep 26, post-Space Weather Introductory Course, by JMG, registration is included in the September SWIC
* Nov 18-19, E-SWAN Space Weather School: data, models and services, by the STCE, Toulouse, France
* Dec 4-6, STCE course: Space Weather impacts on ionospheric wave propagation - focus on GNSS and HF, Brussels, Belgium - Registrations are open
* Jan 22-24, 2024, STCE Space Weather Introductory Course, Brussels, Belgium - Registrations are open
* Jan 25, 2024, post-Space Weather Introductory Course, by JMG and MeteoWing, place TBD - registration is included in the January SWIC
Check: https://www.stce.be/calendar