- Table of Content
- 1.SC25 update
- 2.Review of Spac...
- 3.International ...
- 4.PROBA2 Observa...
- 5.Noticeable Sol...
- 6.Geomagnetic Ob...
- 7.Review of Iono...
- 8.The SIDC Space...
- 9.STCE Activitie...
2. Review of Space Weather
3. International Sunspot Number by SILSO
4. PROBA2 Observations
5. Noticeable Solar Events
6. Geomagnetic Observations in Belgium
7. Review of Ionospheric Activity
8. The SIDC Space Weather Briefing
9. STCE Activities
SC25 update
The STCE's SC25 Tracking page https://www.stce.be/content/sc25-tracking has been updated to reflect the latest evolution of some critical space weather parameters for the ongoing solar cycle 25 (SC25). It covers various aspects of space weather, from sunspot numbers over geomagnetic indices all the way to cosmic rays. The multiple graphs allow for a comparison with previous solar cycles at similar stages in their evolution.
Solar activity remained enhanced with the highest (provisional) monthly sunspot numbers (SILSO - https://www.sidc.be/SILSO/home) so far this solar cycle observed in June (163.4) and July (159.1) 2023. The smoothed provisional monthly sunspot number exceeded the smoothed maximum of the previous solar cycle in February 2023. Based on this surge in solar activity, the Solar Cycle Science webpage (http://solarcyclescience.com/forecasts.html ) now gives a maximum for SC25 around 141 in October 2024 (best fitting curve for a single maximum). The results from the SILSO prediction methodologies (12-month window) are somewhat diverging, but favor sunspot numbers also above the ones initially predicted by the SC25 panel, i.e. well above 115. These numbers can further change pending the evolution of solar activity in the coming months. Also, there's still a good possibility that SC25 may have a similar outlook as SC24, i.e. with 2 moderate, well-separated maxima.

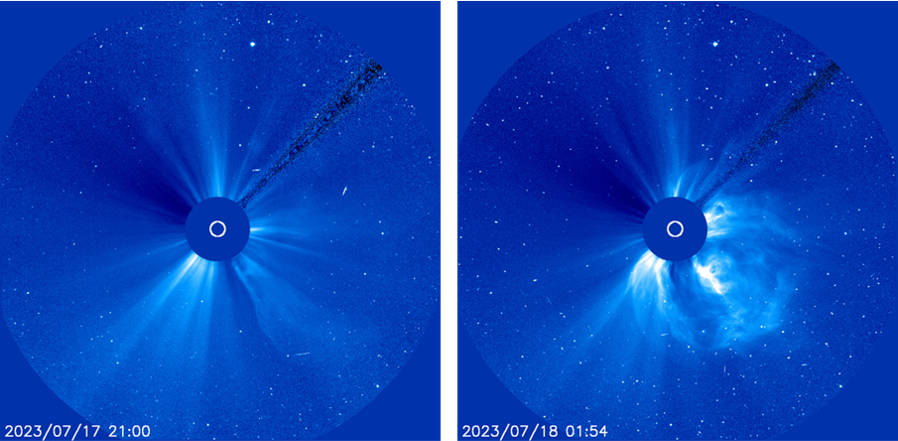
The increase in sunspot numbers was accompanied by a corresponding enhancement in other solar parameters, such as the solar radio flux and the number of solar flares. Also the smoothed number of coronal mass ejections (CME) was near an average of 6/day. The first 2 moderate solar radiation storms (S2 on the NOAA scales - https://www.swpc.noaa.gov/noaa-scales-explanation) of SC25 were produced in July this year. The strongest proton event (620 pfu) was associated with an M5 flare produced by active region NOAA 3363 on 18 July 2023. The coronagraphic images (SOHO/LASCO - https://soho.nascom.nasa.gov/ ) underneath show this event as an increase in noise ("white dots") in the images made by the CCD camera on board of the SOHO satellite and is due to the enhanced number of energetic protons impacting the pixels of the instrument. The image on the left was taken at 21:00 UTC about 3 hours before the M5 flare, and the image on the right was taken at 01:54 UTC about 2 hours after the flare with the proton event in full swing. The CME to the lower right was also associated with this flare.
Review of Space Weather
WEEK 1189 from 2023 Oct 09
Solar Active Regions and flares
Solar flaring activity was moderate to low during the week with 2 M-class flares detected at the start of the week. NOAA Active Region (AR) 3452 (magnetic configuration Beta, Catania group 86) emitted both flares, while NOAA AR 3451 (magnetic configuration Beta-Gamma, Catania group 87) and NOAA AR 3460 (magnetic configuration Beta-Gamma-Delta, Catania group 4) produced the most and the brightest of the C-class flares this week.
Coronal mass ejections
No Earth-directed Coronal Mass Ejections (CMEs) were observed during the week.
Coronal Holes
A large equatorial corona hole (CH) with a negative magnetic polarity crossed the central meridian at the very start of the week. A small CH with positive polarity crossed the central meridian on October 14.
Proton flux levels
The greater than 10 MeV proton flux was at nominal levels throughout the week.
Electron fluxes at GEO
The greater than 2 MeV electron flux, as measured by the GOES-16 satellite, was below the 1000 pfu threshold throughout the week. The 24h electron fluence was at nominal levels during the same period.
Solar wind
The Solar Wind (SW) conditions were typical of the slow SW regime until the arrival of a short-lived High Speed Stream (HSS) on October 13. Up until this event the SW speed varied between 260 and 380 km/s, the total interplanetary magnetic field (Bt) was below 7 nT, and its North-South magnetic component (Bz) was between -6 and 5 nT. The HSS effects lasted until 15 October and caused an increase of the SW speed to 550 km/s, an increase of the Bt to 25 nT, while Bz varied between -16 and 22 nT. Nevertheless, the fast SW conditions did not last for long as by the end of the week the SW speed dropped to 360 km/s, the Bt to well below 4 nT, and Bz ranged between -3 and 3 nT.
Geomagnetism
Geomagnetic conditions were quiet to unsettled both globally and locally (NOAA Kp 0+ to 3- and K BEL 0 to 3) until the arrival of a High Speed Stream (HSS) on October 13. However, the effects were minor and short-lived both globally and locally. NOAA Kp increased to active conditions (Kp 4-) only in the October 13, 15:00-18:00 UTC interval and locally K BEL remained up to 3. From October 14 onwards the geomagnetic conditions returned to quiet levels globally (NOAA Kp 0+ to 2) and stayed at quiet to unsettled levels locally (K BEL 0 to 3).
International Sunspot Number by SILSO

The daily Estimated International Sunspot Number (EISN, red curve with shaded error) derived by a simplified method from real-time data from the worldwide SILSO network. It extends the official Sunspot Number from the full processing of the preceding month (green line), a few days more than one solar rotation. The horizontal blue line shows the current monthly average. The yellow dots give the number of stations that provided valid data. Valid data are used to calculate the EISN. The triangle gives the number of stations providing data. When a triangle and a yellow dot coincide, it means that all the data is used to calculate the EISN of that day.
PROBA2 Observations
Solar Activity
Solar flare activity fluctuated from low to moderate during the week.
In order to view the activity of this week in more detail, we suggest to go to the following website from which all the daily (normal and difference) movies can be accessed: https://proba2.oma.be/ssa
This page also lists the recorded flaring events.
A weekly overview movie (SWAP week 707) can be found here: https://proba2.sidc.be/swap/data/mpg/movies/weekly_movies/weekly_movie_2023_10_09.mp4.
Details about some of this week's events can be found further below.
If any of the linked movies are unavailable they can be found in the P2SC movie repository here: https://proba2.oma.be/swap/data/mpg/movies/.
Tuesday October 10
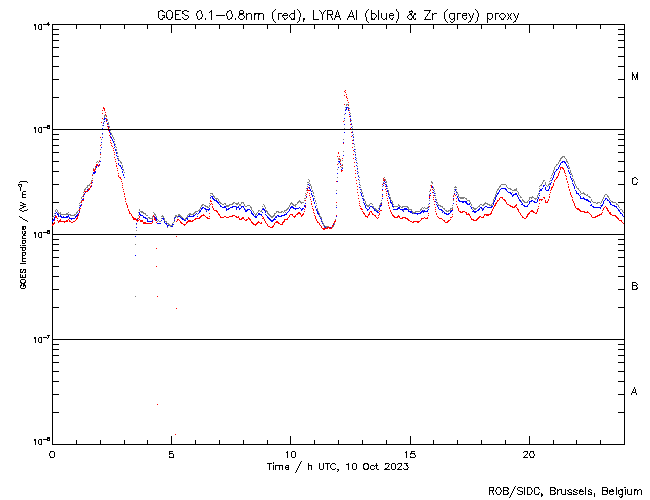
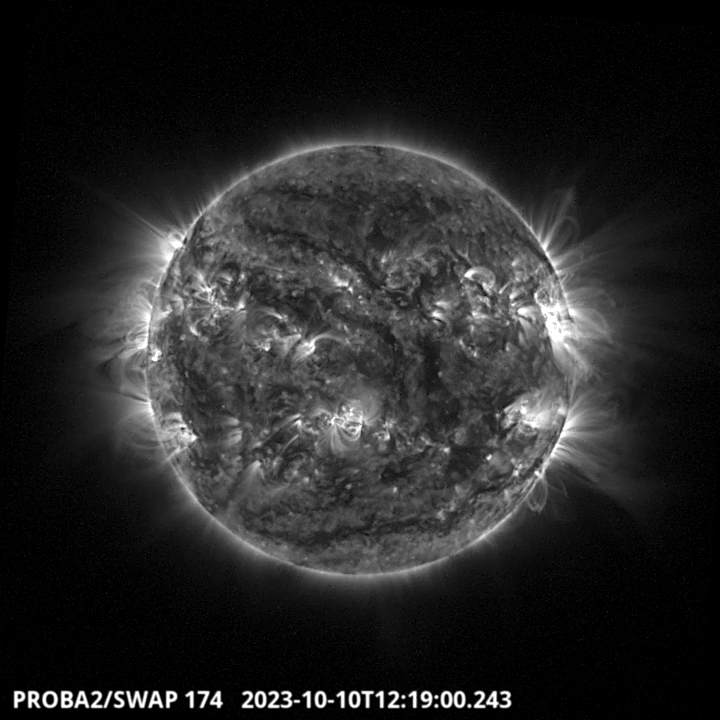
The largest flare of this week, an M2.3, was observed by LYRA (top panel) and SWAP (bottom panel). The flare peaked on 2023-Oct-10 at 12:17 UT. It occurred in the western hemisphere close to the solar limb, and it originated from NOAA AR3451.
Find a SWAP movie of the event here: https://proba2.sidc.be/swap/movies/20231010_swap_movie.mp4.
Noticeable Solar Events
| DAY | BEGIN | MAX | END | LOC | XRAY | OP | 10CM | TYPE | Cat | NOAA |
| 10 | 0155 | 0209 | 0222 | M1.6 | 87 | 3451 | ||||
| 10 | 1208 | 1217 | 1229 | N9W69 | M2.3 | SF | 87 | 3451 | ||
| 12 | 0450 | 0458 | 0505 | M1.1 | 3451 |
| LOC: approximate heliographic location | TYPE: radio burst type |
| XRAY: X-ray flare class | Cat: Catania sunspot group number |
| OP: optical flare class | NOAA: NOAA active region number |
| 10CM: peak 10 cm radio flux |
Geomagnetic Observations in Belgium
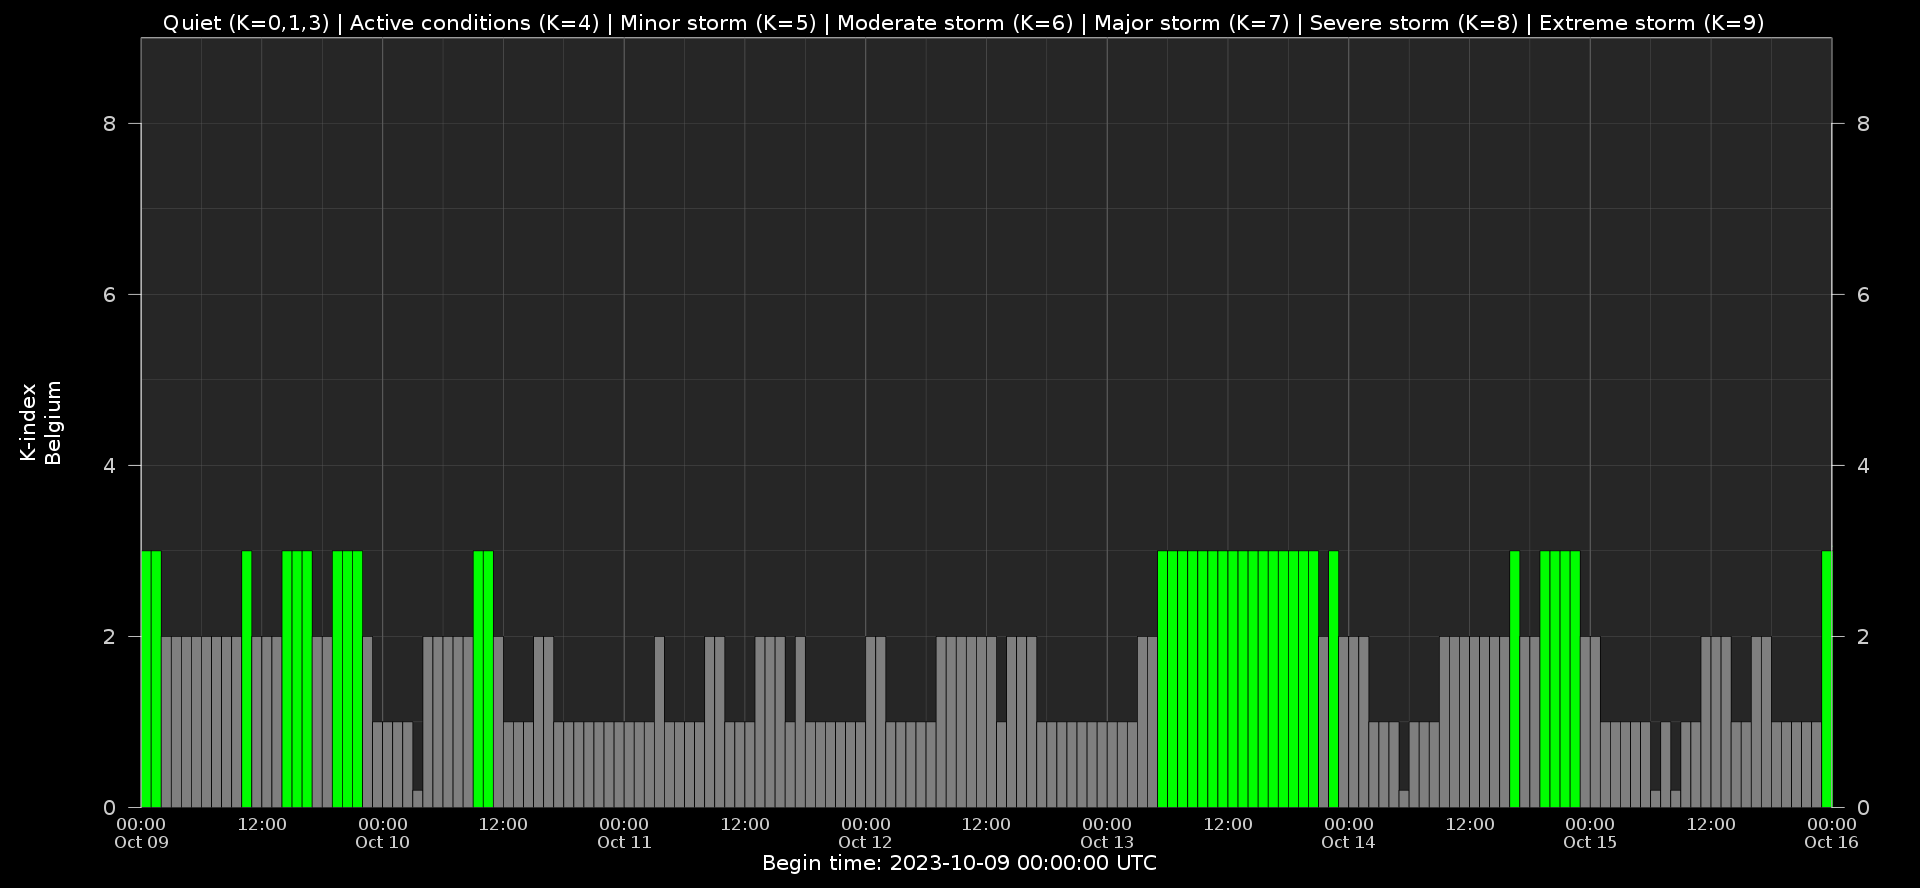
Local K-type magnetic activity index for Belgium based on data from Dourbes (DOU) and Manhay (MAB). Comparing the data from both measurement stations allows to reliably remove outliers from the magnetic data. At the same time the operational service availability is improved: whenever data from one observatory is not available, the single-station index obtained from the other can be used as a fallback system.
Both the two-station index and the single station indices are available here: http://ionosphere.meteo.be/geomagnetism/K_BEL/
Review of Ionospheric Activity
NEW! The time series below illustrates (in green) the VTEC deviation from normal quiet behaviour.


VTEC time series at 3 locations in Europe from 9 Oct 2023 till 15 Oct 2023
The top figure shows the time evolution of the Vertical Total Electron Content (VTEC) (in red) during the last week at three locations:
a) in the northern part of Europe(N 61deg E 5deg)
b) above Brussels(N 50.5deg, E 4.5 deg)
c) in the southern part of Europe(N 36 deg, E 5deg)
This top figure also shows (in grey) the normal ionospheric behaviour expected based on the median VTEC from the 15 previous days.
The time series below shows the VTEC difference (in green) and relative difference (in blue) with respect to the median of the last 15 days in the North, Mid (above Brussels) and South of Europe. It thus illustrates the VTEC deviation from normal quiet behaviour.
The VTEC is expressed in TECu (with TECu=10^16 electrons per square meter) and is directly related to the signal propagation delay due to the ionosphere (in figure: delay on GPS L1 frequency).
The Sun's radiation ionizes the Earth's upper atmosphere, the ionosphere, located from about 60km to 1000km above the Earth's surface.The ionization process in the ionosphere produces ions and free electrons. These electrons perturb the propagation of the GNSS (Global Navigation Satellite System) signals by inducing a so-called ionospheric delay.
See http://stce.be/newsletter/GNSS_final.pdf for some more explanations ; for detailed information, see http://gnss.be/ionosphere_tutorial.php
The SIDC Space Weather Briefing
The Space Weather Briefing presented by the forecaster on duty from to July. It reflects in images and graphs what is written in the Solar and Geomagnetic Activity report: https://www.stce.be/briefings/20231016_SWbriefing.pdf
If you need to access the movies, contact us: stce_coordination at stce.be
STCE Activities
Check out our activity calendar: activities and encounters with the Sun-Space-Earth system and Space Weather as the main theme. We provide occasions to get submerged in our world through educational, informative and instructive activities.
If you want your event in our calendar, contact us: stce_coordination at stce.be
* Nov 18-19, E-SWAN Space Weather School: data, models and services, by the STCE, Toulouse, France
* Nov 24, Webinar: Meet EPOS-BE, ROB, online
* Nov 26, STCE @ Dag van de Wetenschap, Planetarium, Brussels
* Dec 4-6, STCE course: Space Weather impacts on ionospheric wave propagation - focus on GNSS and HF, Brussels, Belgium - Registrations are open
* Jan 22-24, 2024, STCE Space Weather Introductory Course, Brussels, Belgium - Registrations are open
* Jan 25, 2024, post-Space Weather Introductory Course, by JMG and MeteoWing, place TBD - registration is included in the Jan SWIC
Check: https://www.stce.be/calendar