- Table of Content
- 1.Soar like an e...
- 2.Review of spac...
- 3.PROBA2 Observa...
- 4.International ...
- 5.Noticeable Sol...
- 6.Geomagnetic Ob...
- 7.The SIDC space...
- 8.Review of Iono...
- 9.STCE Seminars,...
2. Review of space weather
3. PROBA2 Observations (15 Apr 2024 - 21 Apr 2024)
4. International Sunspot Number by SILSO
5. Noticeable Solar Events
6. Geomagnetic Observations in Belgium
7. The SIDC space weather briefing
8. Review of Ionospheric Activity
9. STCE Seminars, Lectures and Courses
Soar like an eagle
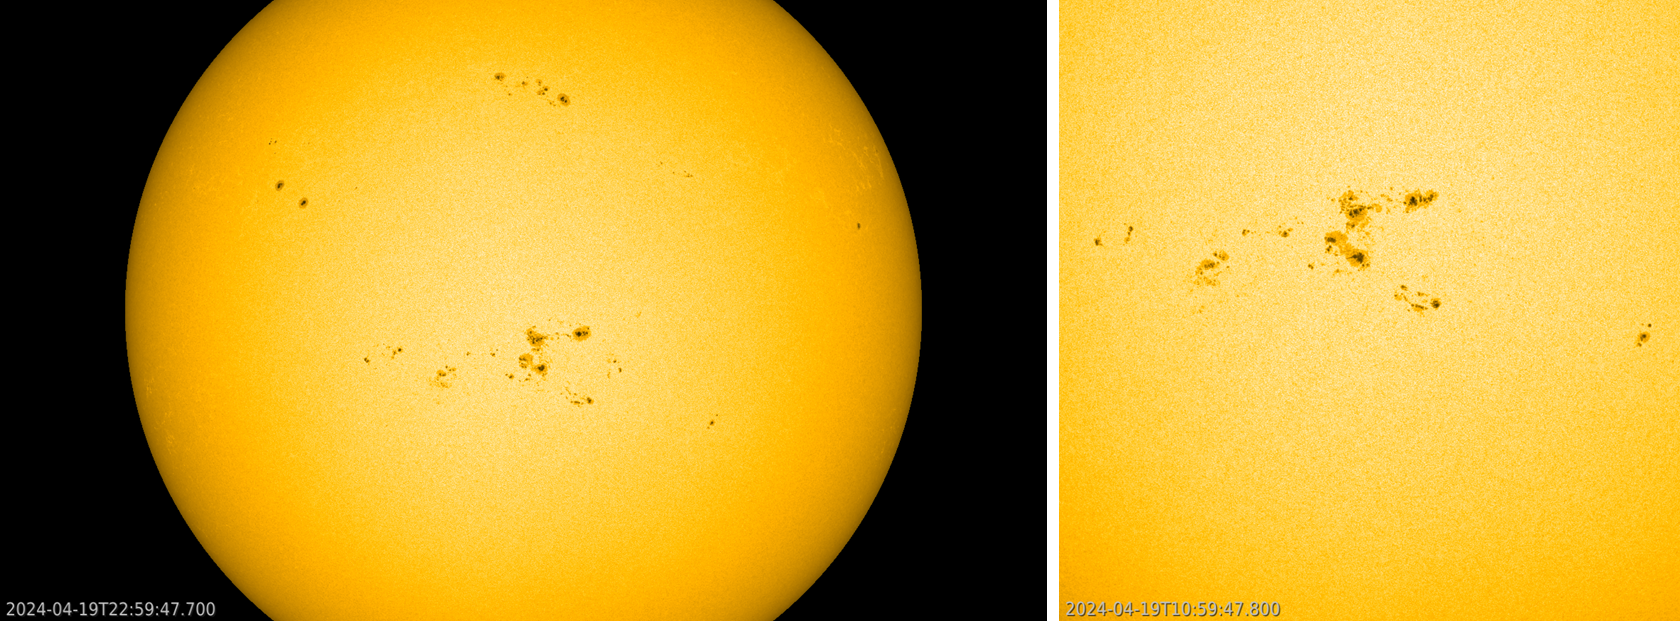
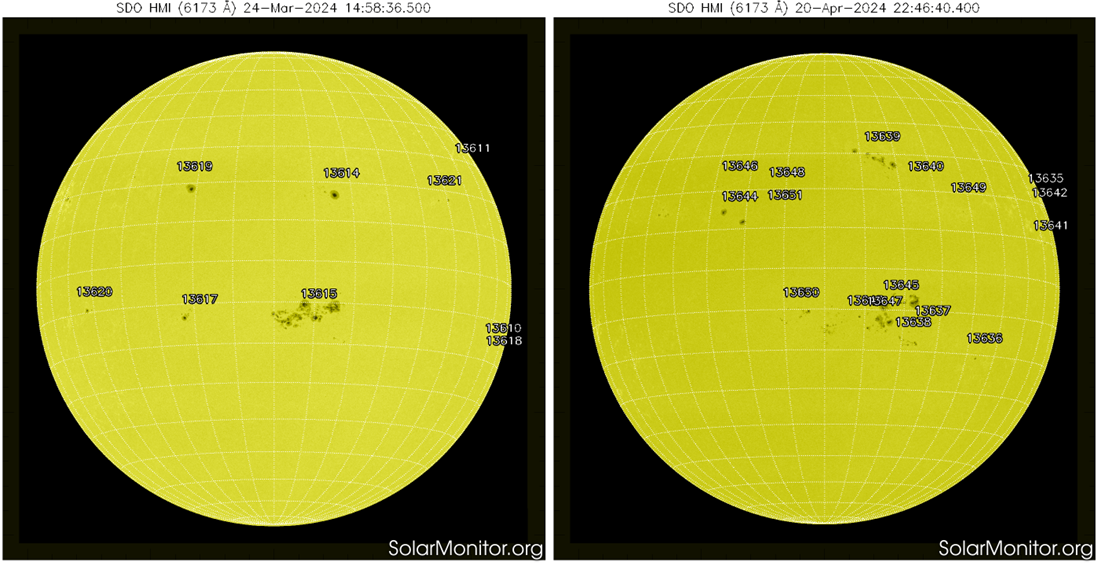
Sunspot activity rose to around 250 by 19 April, nearly doubling in just a week and more than 4 times higher than at the beginning of the month. Aside numerous small to medium sized sunspot groups, there was a huge sunspot complex in the southern solar hemisphere consisting of at least 5 sunspot groups. None of these groups contained large sunspots, but they were composed of many small spots. From 17 April onwards, most of the M-class flaring originated from the central portion of this complex (active regions NOAA 3643/3645/3647). This is also the location where complex sunspot group NOAA 3615 developed during the previous solar rotation (STCE newsitem at https://www.stce.be/news/696/welcome.html ). The SDO/HMI (http://sdo.gsfc.nasa.gov/data/aiahmi/ ) image shows a white light image of this sunspot complex on 19 April. It is followed by a comparison with the previous solar rotation. Clips are in the online version of this newsitem at https://www.stce.be/news/696/welcome.html
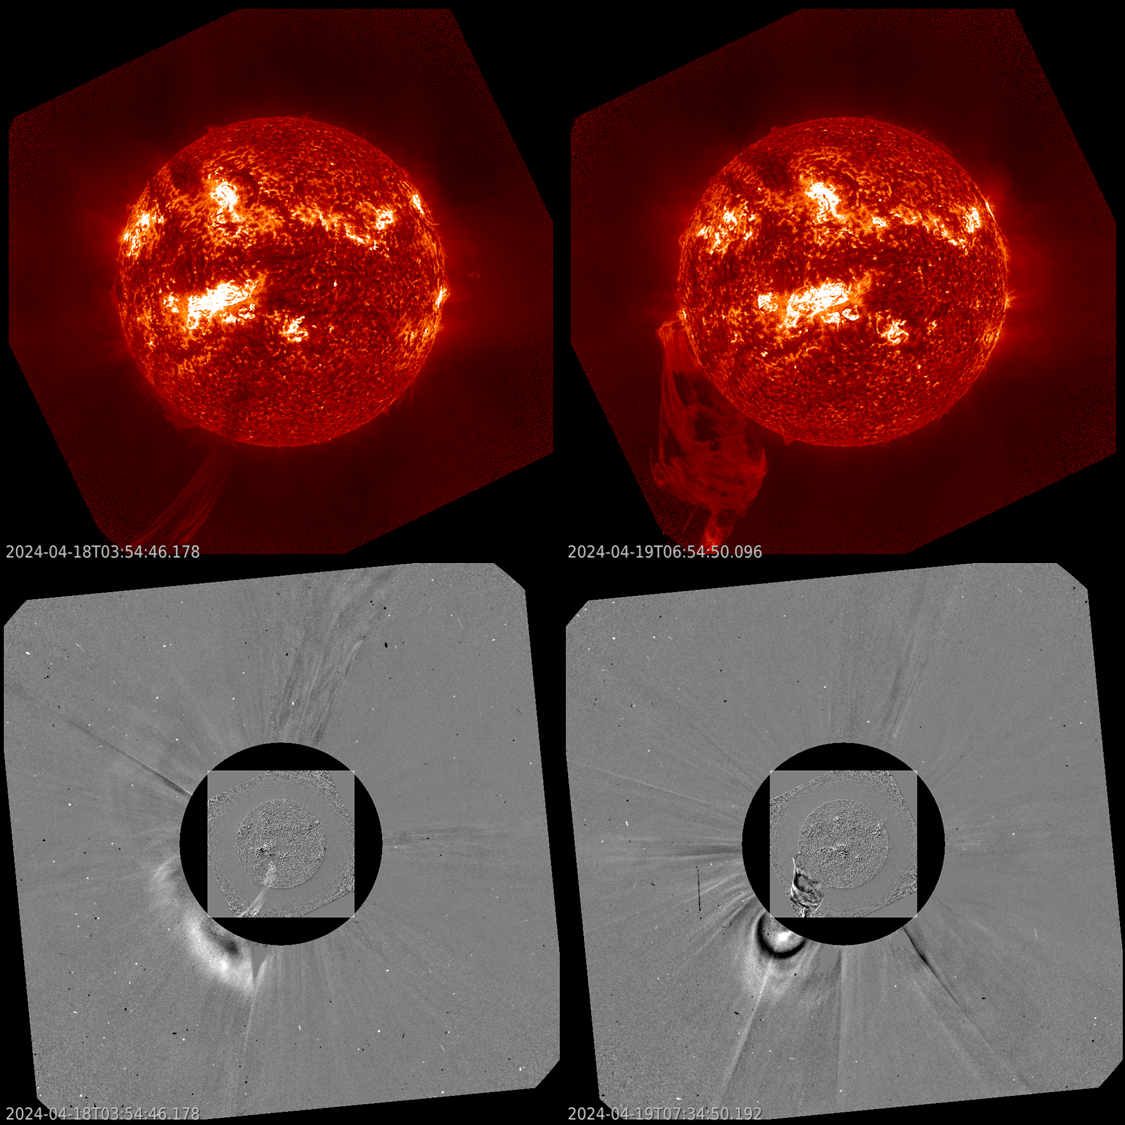
The most notable eruptive activity came from active region NOAA 3638, a rather small and deceivingly simple member of this sunspot complex located to the southwest ("lower right"). It produced numerous jetlike eruptions which were associated with relatively narrow coronal mass ejections (CMEs). These CME puffs were mostly directed south of the ecliptic (the plane created by the Earth in its yearly orbit around the Sun), though some of the wider CMEs may have an earth-directed component. The imagery underneath shows extreme ultraviolet images from GOES/SUVI (top row ; https://www.swpc.noaa.gov/products/goes-solar-ultraviolet-imager-suvi ) and combined with coronagraphic imagery by SOHO/LASCO C2 (bottom row ; http://sohowww.nascom.nasa.gov/data/realtime-images.html ). Difference imagery, i.e. one image subtracted from the next, were used for the latter. The left column shows a jet with its associated CME early on 18 April, the right column shows an impressive prominence eruption (unrelated to the activity in the sunspot complex) early on 19 April.
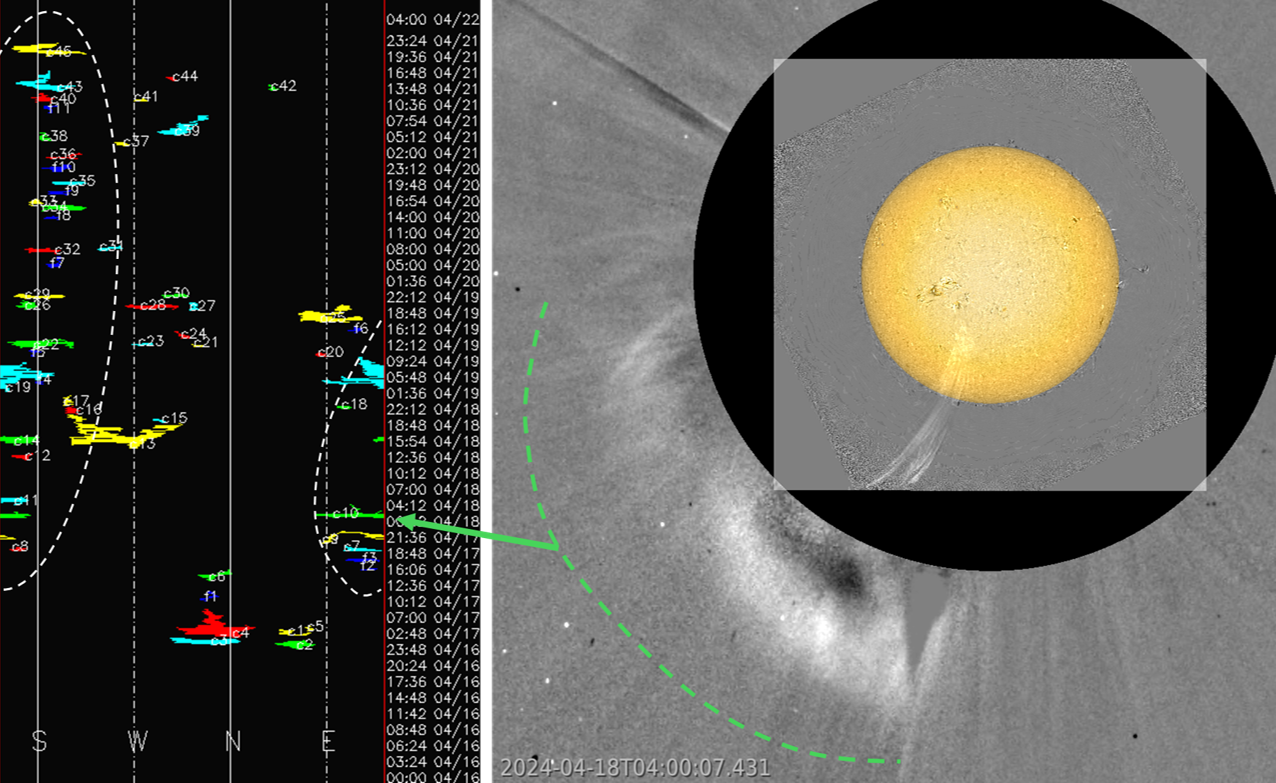
As the sunspot complex rotated from the south-eastern quadrant over the central meridian into the southwestern quadrant, NOAA 3638's puffs could also be traced in the CACTus diagram (https://www.sidc.be/cactus/ ) where a string of relatively narrow CMEs could be followed from east over south to west from 18 to 21 April, as annotated in the diagram underneath (white dashed line). In this diagram, the entire solar limb is stretched over a horizontal line with the principal directions (South West North East) indicated, and time moving upward. CMEs are then the short, horizontal, colored strings as observed moving in a direction. To the right of this diagram is a compilation tracing a jet from its source (NOAA 3638 - white light overlay) to its associated CME annotated with the green dashed line. The green color corresponds to the green color of the related CME early on 18 April on the CACTus diagram. Not all of the CMEs in the annotated portion of this diagram are related to CMEs from NOAA 3638, there are also some farside CMEs, and from 21 April onwards, some of the CMEs were associated with jetlike eruptions in NOAA 3636, 20 degrees to the west ("right") of NOAA 3638.
Review of space weather
Solar Active Regions (ARs) and flares
The solar flaring activity was mostly at moderate levels. There were 25 active regions visible throughout the week. 71 C-class flares and 19 M-class flares were recorded, the strongest being an M4.0-flare with peak time 19:32 UTC on Apr 15, associated with NOAA AR 3639. In the first part of the week, most of the flaring activity came from NOAA AR 3634 and NOAA AR 3639. In the second part of the week, most of the flaring activity originated from a group consisted of NOAA AR 3638, 3639, 3643, 3645 and 3647.
Coronal mass ejections
There were multiple coronal mass ejections (CMEs) observed over the course of the week. A faint partial halo CME was observed in LASCO/C2 coronagraph data from 06:48 UTC on Apr 15. The CME was directed primarily to the North from the Earth's perspective and was likely associated with a small filament eruption near NOAA AR 3636. The CME probably arrived on Apr 19.
A small filament eruption occurred in the southeastern quadrant from around 18:36 UTC on Apr 16, the associated CME appeared narrow and slow and was not expected to arrive to Earth. Another filament eruption was observed in the northern quadrant, first seen in SDO/AIA 304 at around 01:16 UTC on Apr 17. An associated CME can be seen in SOHO/LASCO-C2 from 02:36 on Apr 17. The CME is judged to be too narrow to reach Earth. Some more CMEs occurred in coronagraph images afterwards, but all are judged to be too narrow or off the Sun-Earth line to reach Earth.
Coronal Holes
Small negative polarity equatorial coronal hole has began to cross the central meridian on Apr 17.
Proton flux levels
The greater than 10 MeV proton flux was at nominal levels throughout the entire week.
Electron fluxes at GEO
The greater than 2 MeV electron flux, as measured by the GOES-16 satellite, was below the 1000 pfu threshold and the 24h electron fluence was at nominal level over the past week.
Solar wind
The solar wind parameters were indicative of a slow solar wind regime at the beginning of the week. The solar wind conditions became slightly disturbed from around 17:26 UTC on Apr 15, probably registering the arrival of a faint halo CME observed near the Sun on Apr 12. The magnetic field during the ICME passage reached a maximum of 13 nT with a minimum Bz of -11 nT and the solar wind speed remained at slow background values. The next ICME passage was registered in the morning of Apr 19, with the shock front arriving around 04:53 UTC on Apr 19. The total magnetic field reached 18 nT, the solar wind speed ranged between 330 km/s and 530 km/s. The southward component of the interplanetary magnetic field fluctuated between -16 nT and 7 nT. This ICME was probably linked with the faint partial hallo CME observed near the Sun on Apr 15. The ICME probably mixed on its way with the high-speed stream from the negative polarity equatorial coronal hole.
Geomagnetism
The geomagnetic activity was at quiet to unsettled levels at the beginning of the week and gradually increased as a result of the ICME arrival, reaching the minor storm level (NOAA-Kp = 5, K-Bel = 5) between 18:00 and 00:00 UTC on Apr 16. The geomagnetic conditions then reduced to quiet to unsettled levels until Apr 19. Geomagnetic conditions reached strong storm levels globally (NOAA-Kp = 7) between 18:00 and 21:00 UTC on Apr 19. Locally over Belgium, only minor geomagnetic storm conditions were observed (K-Bel = 5). These strong levels were reached due to the prolonged period of negative Bz following second ICME arrival. For the remaining part of the week, geomagnetic conditions were mostly at unsettled to active levels.
PROBA2 Observations (15 Apr 2024 - 21 Apr 2024)
Solar Activity
Solar flare activity fluctuated from low to moderate during the week.
In order to view the activity of this week in more detail, we suggest to go to the following website from which all the daily (normal and difference) movies can be accessed: https://proba2.oma.be/ssa
This page also lists the recorded flaring events.
A weekly overview movie (SWAP week 734) can be found here: https://proba2.sidc.be/swap/data/mpg/movies/weekly_movies/weekly_movie_2024_04_15.mp4.
Details about some of this week's events can be found further below.
If any of the linked movies are unavailable they can be found in the P2SC movie repository here: https://proba2.oma.be/swap/data/mpg/movies/.
Monday April 15
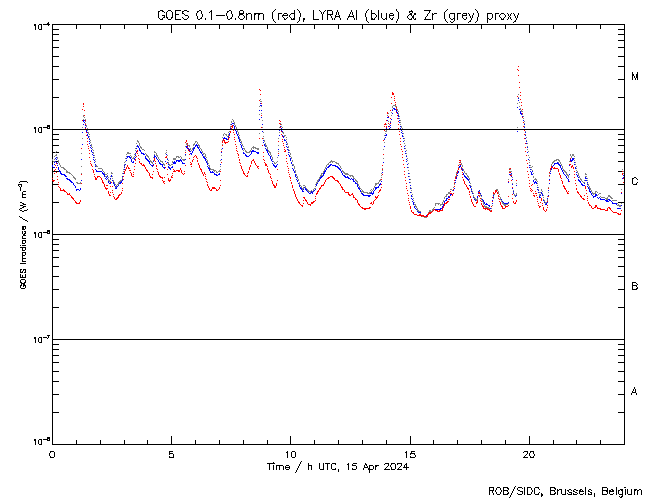
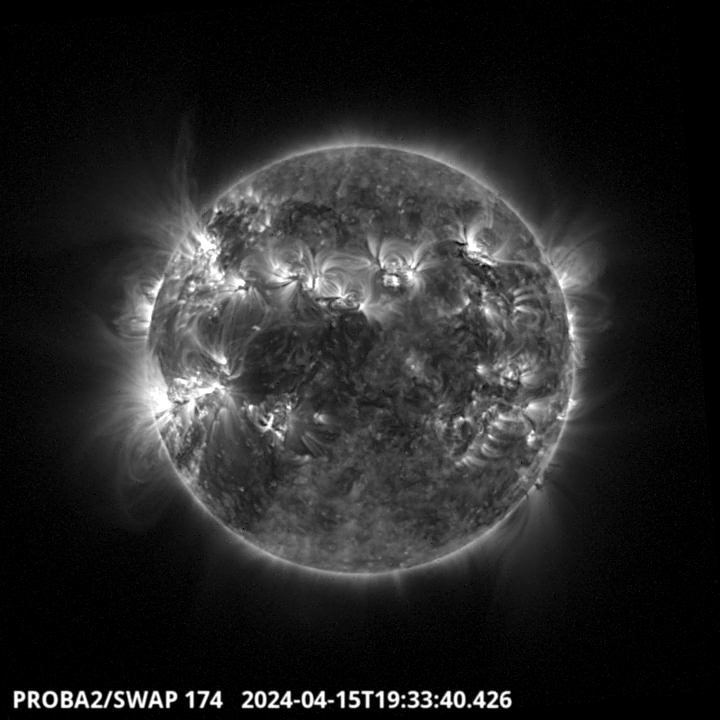
The largest flare of this week was an M4.0, and it was observed by LYRA (top panel) and SWAP (bottom panel). The flare peaked on 2024-Apr-15 at 19:32 UT. It occurred on the north-eastern quadrant, and it originated from NOAA AR3639.
Find a SWAP movie of the event here: https://proba2.sidc.be/swap/movies/20240415_swap_movie.mp4.
International Sunspot Number by SILSO
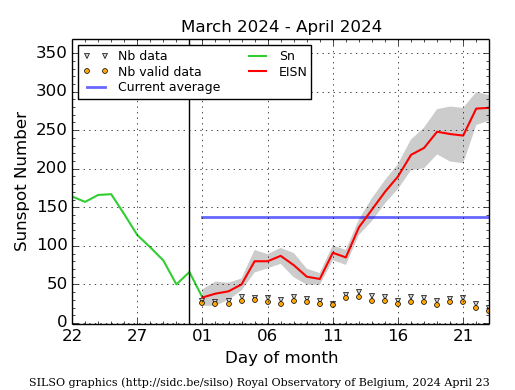
The daily Estimated International Sunspot Number (EISN, red curve with shaded error) derived by a simplified method from real-time data from the worldwide SILSO network. It extends the official Sunspot Number from the full processing of the preceding month (green line), a few days more than one solar rotation. The horizontal blue line shows the current monthly average. The yellow dots give the number of stations that provided valid data. Valid data are used to calculate the EISN. The triangle gives the number of stations providing data. When a triangle and a yellow dot coincide, it means that all the data is used to calculate the EISN of that day.
Noticeable Solar Events
| DAY | BEGIN | MAX | END | LOC | XRAY | OP | 10CM | TYPE | Cat | NOAA |
| 15 | 0106 | 0118 | 0126 | N34E68 | M1.7 | SF | 3639 | |||
| 15 | 0715 | 0732 | 0738 | N30E57 | M1.0 | 1F | 3639 | |||
| 15 | 0838 | 0842 | 0847 | N27W29 | M2.3 | 1B | III/2 | 50 | 3634 | |
| 15 | 0921 | 0932 | 0942 | N29E60 | M1.2 | SF | VI/2 | 3639 | ||
| 15 | 1343 | 1358 | 1401 | N28E56 | M1.1 | 1F | III/1 | 3639 | ||
| 15 | 1408 | 1417 | 1427 | N26W33 | M2.2 | SN | III/1 | 3639 | ||
| 15 | 1401 | 1404 | 1406 | N26W33 | M1.4 | SN | 50 | 3634 | ||
| 15 | 1925 | 1932 | 1939 | N28E56 | M4.0 | 1N | 3639 | |||
| 16 | 1749 | 1802 | 1814 | S10E36 | M1.1 | 2N | 3645 | |||
| 17 | 2155 | 2208 | 2217 | S7E22 | M1.6 | 2N | 62 | 3643 | ||
| 18 | 0232 | 0248 | 0253 | S11E27 | M2.2 | SF | V/3 | 59 | 3638 | |
| 18 | 0717 | 0737 | 0809 | S12E23 | M1.3 | SF | 62 | 3643 | ||
| 18 | 1922 | 2001 | 2012 | S12E17 | M1.6 | SF | III/1 | 60 | 3645 | |
| 18 | 2012 | 2016 | 2021 | S12E17 | M1.6 | SF | III/1 | 3647 | ||
| 19 | 0440 | 0453 | 0503 | N20W58 | M2.1 | SF | VI/1III/1 | 60 | 3647 | |
| 19 | 1253 | 1306 | 1323 | M1.0 | III/2 | 60 | 3647 | |||
| 21 | 1239 | 1259 | 1334 | S6W25 | M1.0 | 1F | III/2 | 3645 | ||
| 21 | 1507 | 1514 | 1520 | N22E19 | M2.2 | SF | V/3III/3 | 3638 | ||
| 21 | 2144 | 2152 | 2157 | S17W37 | M3.4 | SN | III/3 | 3638 |
| LOC: approximate heliographic location | TYPE: radio burst type |
| XRAY: X-ray flare class | Cat: Catania sunspot group number |
| OP: optical flare class | NOAA: NOAA active region number |
| 10CM: peak 10 cm radio flux |
Geomagnetic Observations in Belgium
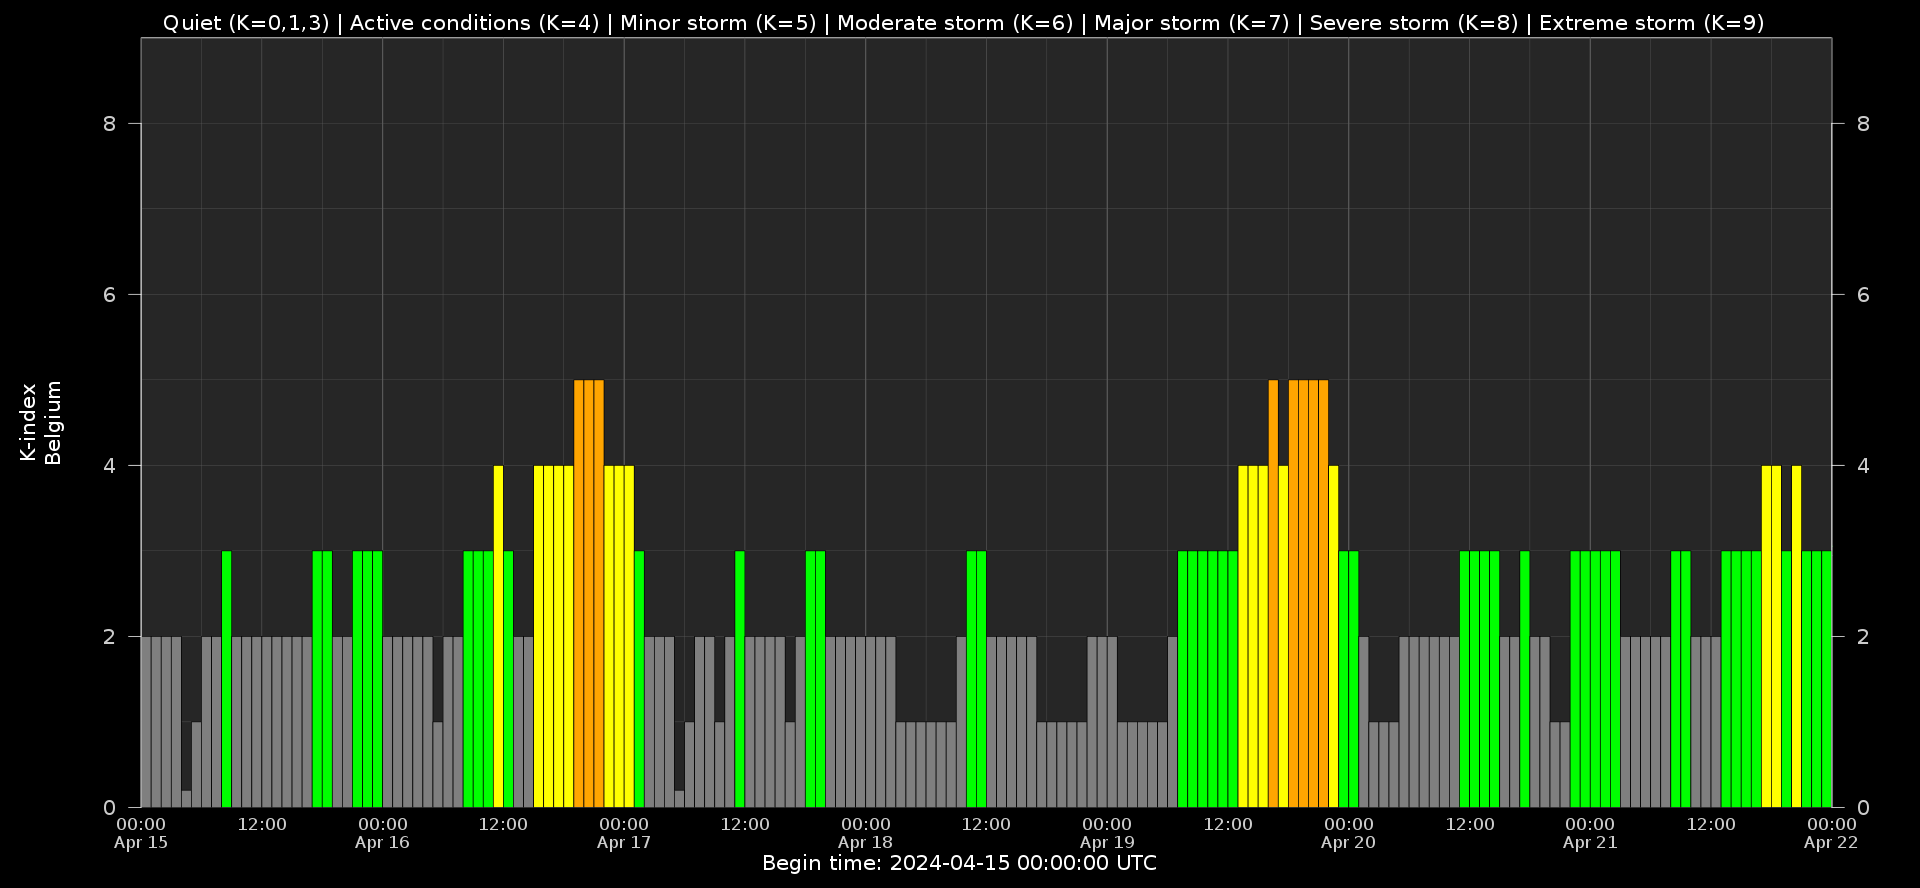
Local K-type magnetic activity index for Belgium based on data from Dourbes (DOU) and Manhay (MAB). Comparing the data from both measurement stations allows to reliably remove outliers from the magnetic data. At the same time the operational service availability is improved: whenever data from one observatory is not available, the single-station index obtained from the other can be used as a fallback system.
Both the two-station index and the single station indices are available here: http://ionosphere.meteo.be/geomagnetism/K_BEL/
The SIDC space weather briefing
The forecaster on duty presented the SIDC briefing that gives an overview of space weather from April 15 to 21.
The pdf of the presentation can be found here: https://www.stce.be/briefings/20240422_SWbriefing.pdf

Review of Ionospheric Activity
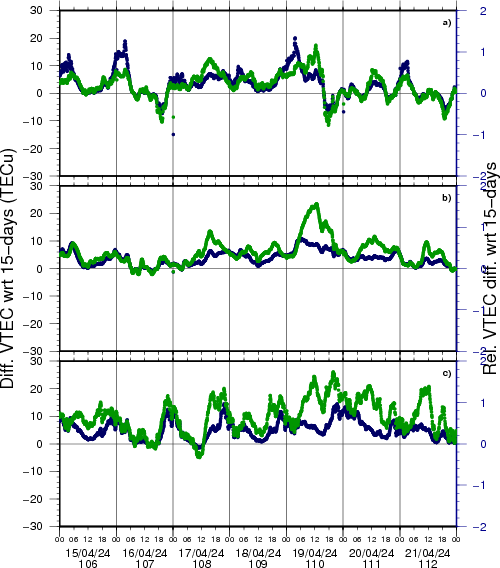
NEW! The time series below illustrates (in green) the VTEC deviation from normal quiet behaviour.
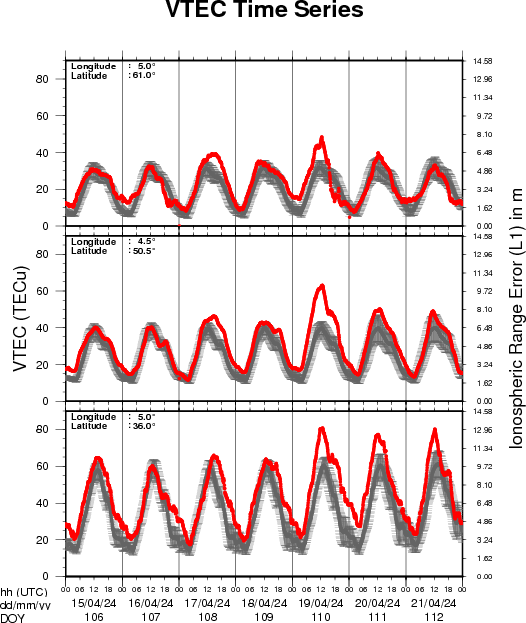
VTEC time series at 3 locations in Europe from 15 Apr 2024 till 21 Apr 2024
The top figure shows the time evolution of the Vertical Total Electron Content (VTEC) (in red) during the last week at three locations:
a) in the northern part of Europe(N 61deg E 5deg)
b) above Brussels(N 50.5deg, E 4.5 deg)
c) in the southern part of Europe(N 36 deg, E 5deg)
This top figure also shows (in grey) the normal ionospheric behaviour expected based on the median VTEC from the 15 previous days.
The time series below shows the VTEC difference (in green) and relative difference (in blue) with respect to the median of the last 15 days in the North, Mid (above Brussels) and South of Europe. It thus illustrates the VTEC deviation from normal quiet behaviour.
The VTEC is expressed in TECu (with TECu=10^16 electrons per square meter) and is directly related to the signal propagation delay due to the ionosphere (in figure: delay on GPS L1 frequency).
The Sun's radiation ionizes the Earth's upper atmosphere, the ionosphere, located from about 60km to 1000km above the Earth's surface.The ionization process in the ionosphere produces ions and free electrons. These electrons perturb the propagation of the GNSS (Global Navigation Satellite System) signals by inducing a so-called ionospheric delay.
See http://stce.be/newsletter/GNSS_final.pdf for some more explanations; for more information, see https://gnss.be/SpaceWeather
STCE Seminars, Lectures and Courses
Courses and presentations with the Sun-Space-Earth system and Space Weather as the main theme. We provide occasions to get submerged in our world through educational, informative and instructive activities.
* April 26, Public presentation Proba-3: a solar eclipse maker, MIRA, Grimbergen, Belgium
* April 30, Solar physics and Space Weather: Proba-2 and Proba-3, online course - Registrations are open
* May 3, STCE seminar, An Echo of the Sun, Brussels, Belgium
* May 6, An Echo of the Sun, PhD defense Pepa Ivanova, Brussels, Belgium
* May 13, lecture by the STCE, From physics to forecasting, ESA Space Weather Training Course 2024, Euro Space Center, Redu, Belgium
* May 14, STCE Seminar, Segmentation, grouping and classification of sunspots from ground-based observations using deep learning methods
* May 13 - 17, lectures by the STCE, solar and heliospheric weather; magnetosphere, ionosphere, aviation, and ground based impact, Course Operational Space Weather Fundamentals, L'Aquila, Italy
* May 18, Public presentation, The PROBA-3 Mission: Artificial Total Solar Eclipse in Space, FotonFest, Urania, Hove, Belgium
* May 28, Solar physics and Space Weather: Solar Orbiter Spacecraft, online course - Registrations are open
* June 4, STCE seminar, title TBC
* June 9, Public presentation Total Eclipse of the Sun, Helios, Averbode, Belgium
* June 13, STCE seminar, Solar Prominence Eruptions: Insights from UV Imaging with EUI/FSI
* June 25, Solar physics and Space Weather: predictions and services, online course - Registrations are open
* June 27, STCE annual meeting, Brussels, Belgium
* June 28, public presentation Help! Het stormt in de ruimte!?, Wetenschappelijke middagen, Brussels, Belgium
To register for a course or lecture, check the page of the STCE Space Weather Education Center: https://www.stce.be/SWEC
If you want your event in the STCE newsletter, contact us: stce_coordination at stce.be