- Table of Content
- 1.The show conti...
- 2.Science and Ar...
- 3.International ...
- 4.Noticeable Sol...
- 5.Geomagnetic Ob...
- 6.PROBA2 Observa...
- 7.The SIDC Space...
- 8.Review of Iono...
- 9.Courses and pr...
2. Science and Art - Solar Stasis
3. International Sunspot Number by SILSO
4. Noticeable Solar Events
5. Geomagnetic Observations in Belgium
6. PROBA2 Observations (29 Apr 2024 - 5 May 2024)
7. The SIDC Space Weather Briefing
8. Review of Ionospheric Activity
9. Courses and presentations
The show continues!...
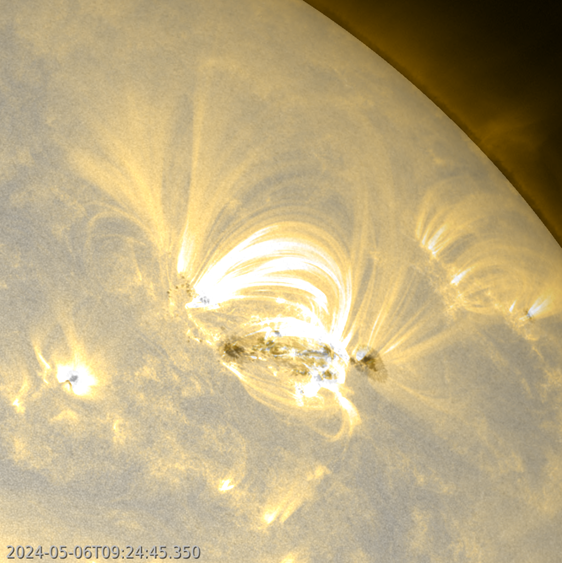
The strong solar flare activity from NOAA 3663 has been discussed in this STCE Newsflash (https://www.stce.be/news/698/welcome.html ). On 6 May, the region produced its 4th and -so far- strongest X-class flare during its solar transit. The long-duration X4.5 flare peaked at 06:35UTC. It is the 3rd strongest flare so far this solar cycle (SC25), after the X6.3 flare from NOAA 3590 on 22 February this year (https://www.stce.be/news/687/welcome.html ), and the X5.0 flare from NOAA 3536 on 31 December 2023 (https://www.stce.be/news/675/welcome.html ). The imagery underneath combines semi-transparent extreme ultraviolet (EUV) pictures taken by SDO/AIA 171 (temperatures around 700.000 degrees ; https://sdo.gsfc.nasa.gov/data/aiahmi/) with white lights pictures. It shows the location of the X4 flare and the subsequent development of post-flare coronal loops. A clip is available in the online version at https://www.stce.be/news/699/welcome.html STEREO-A coronagraphic images show an associated coronal mass ejection (CME) of which the bulk is mostly directed northward. The SIDC forecaster (https://www.sidc.be/index.php ) is further analyzing the images as they become available.
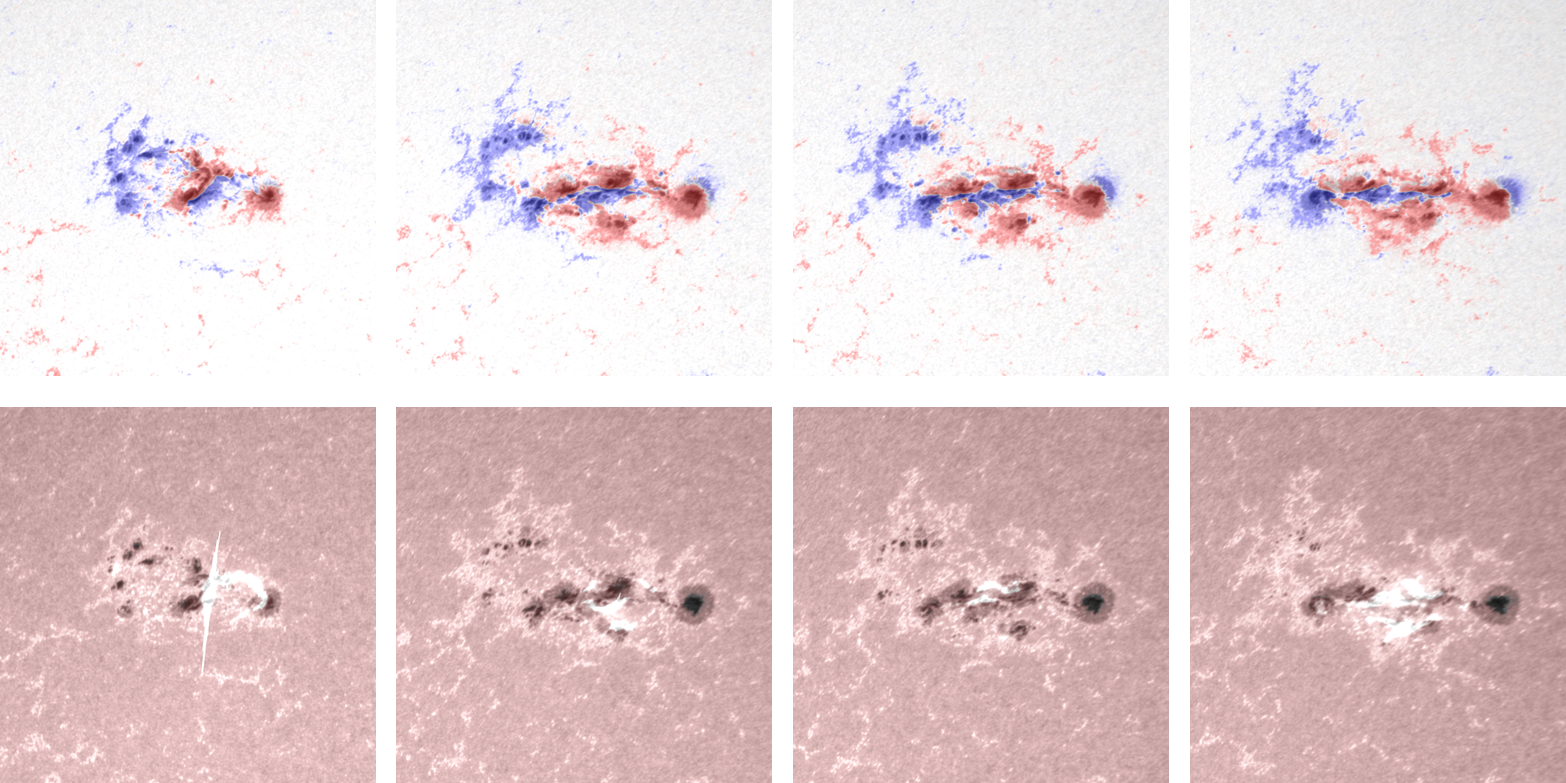
During the 1-5 May period, NOAA 3663 produced also 17 M-class flares ("medium"), some of which were flirting with the X-class level threshold. The fuel for all this solar flare frenzy came (is still coming...) from the strong and dynamic magnetic delta structure that NOAA 3663 developed. A sunspot group is said to contain a delta structure when there is at least one mature spot present in which umbrae of opposite polarities are separated by less than 2° and are situated within the common penumbra. Delta regions have a much higher flaring probability than the other regions. The top row in the imagery underneath shows a semi-transparent magnetogram overlaid on white light images of NOAA 3663. Red indicates positive magnetic polarity (field lines coming out of the Sun), blue represents negative magnetic polarity (field lines returning into the Sun). These images are about 10-30 minutes prior to each of the 4 X-class events. The bottom row then shows the location of the flare ribbons by overlaying AIA 1700 over the white light images close to the maximum of each X-class flare. AIA1700 shows the inner atmosphere of the Sun right above its surface, at temperatures near 5000 degrees. The ribbons are usually parallel to the magnetic inversion line, i.e. the line separating positive from negative magnetic polarities and near which flaring activity usually takes place. A clip showing the evolution of the magnetic delta in NOAA 3663 (2-6 May) can be found in the online version of this newsitem.
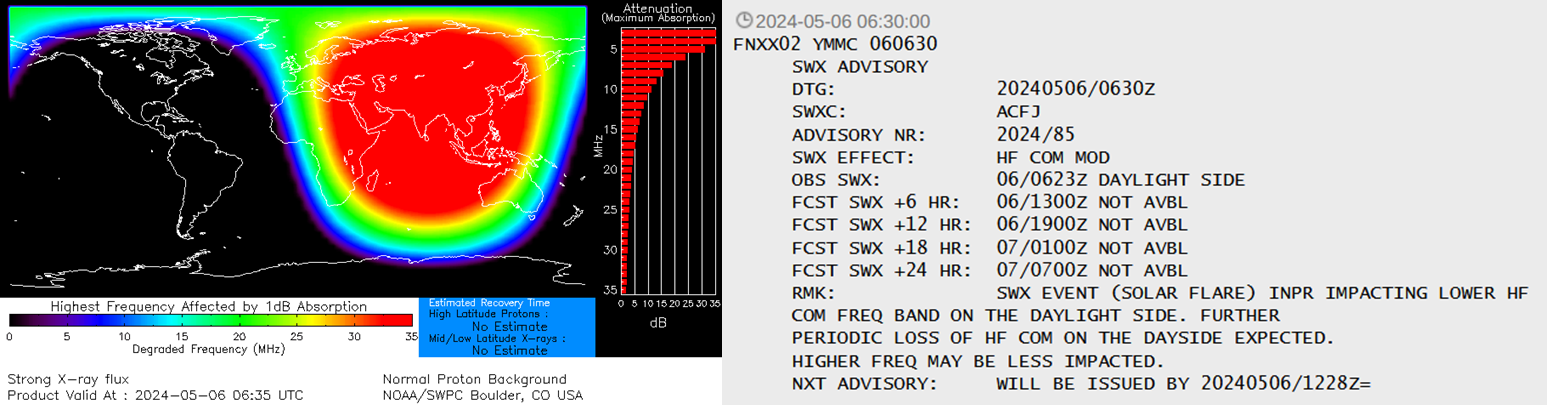
Similar to the X1.3 flare, this X4 event affected High Frequency (HF) communications over the western portion of Australia, Southeast Asia, China, Japan, Russia, India, the Arabian peninsula and East-Africa (D-RAP ; https://www.swpc.noaa.gov/products/d-region-absorption-predictions-d-rap ). An advisory for disturbed HF Com has been sent by ACFJ (consortium of Australia, Canada, France and Japan) to the civil aviation through PECASUS (https://pecasus.eu/ ). Magnetometer stations in India and Asia (Intermagnet (BGS) - https://imag-data.bgs.ac.uk/GIN_V1/GINForms2 ) recorded a solar flare effect of 5-20 nT. Further strong flaring from NOAA 3663 can be expected as long as the potent magnetic delta structure remains present.
Science and Art - Solar Stasis
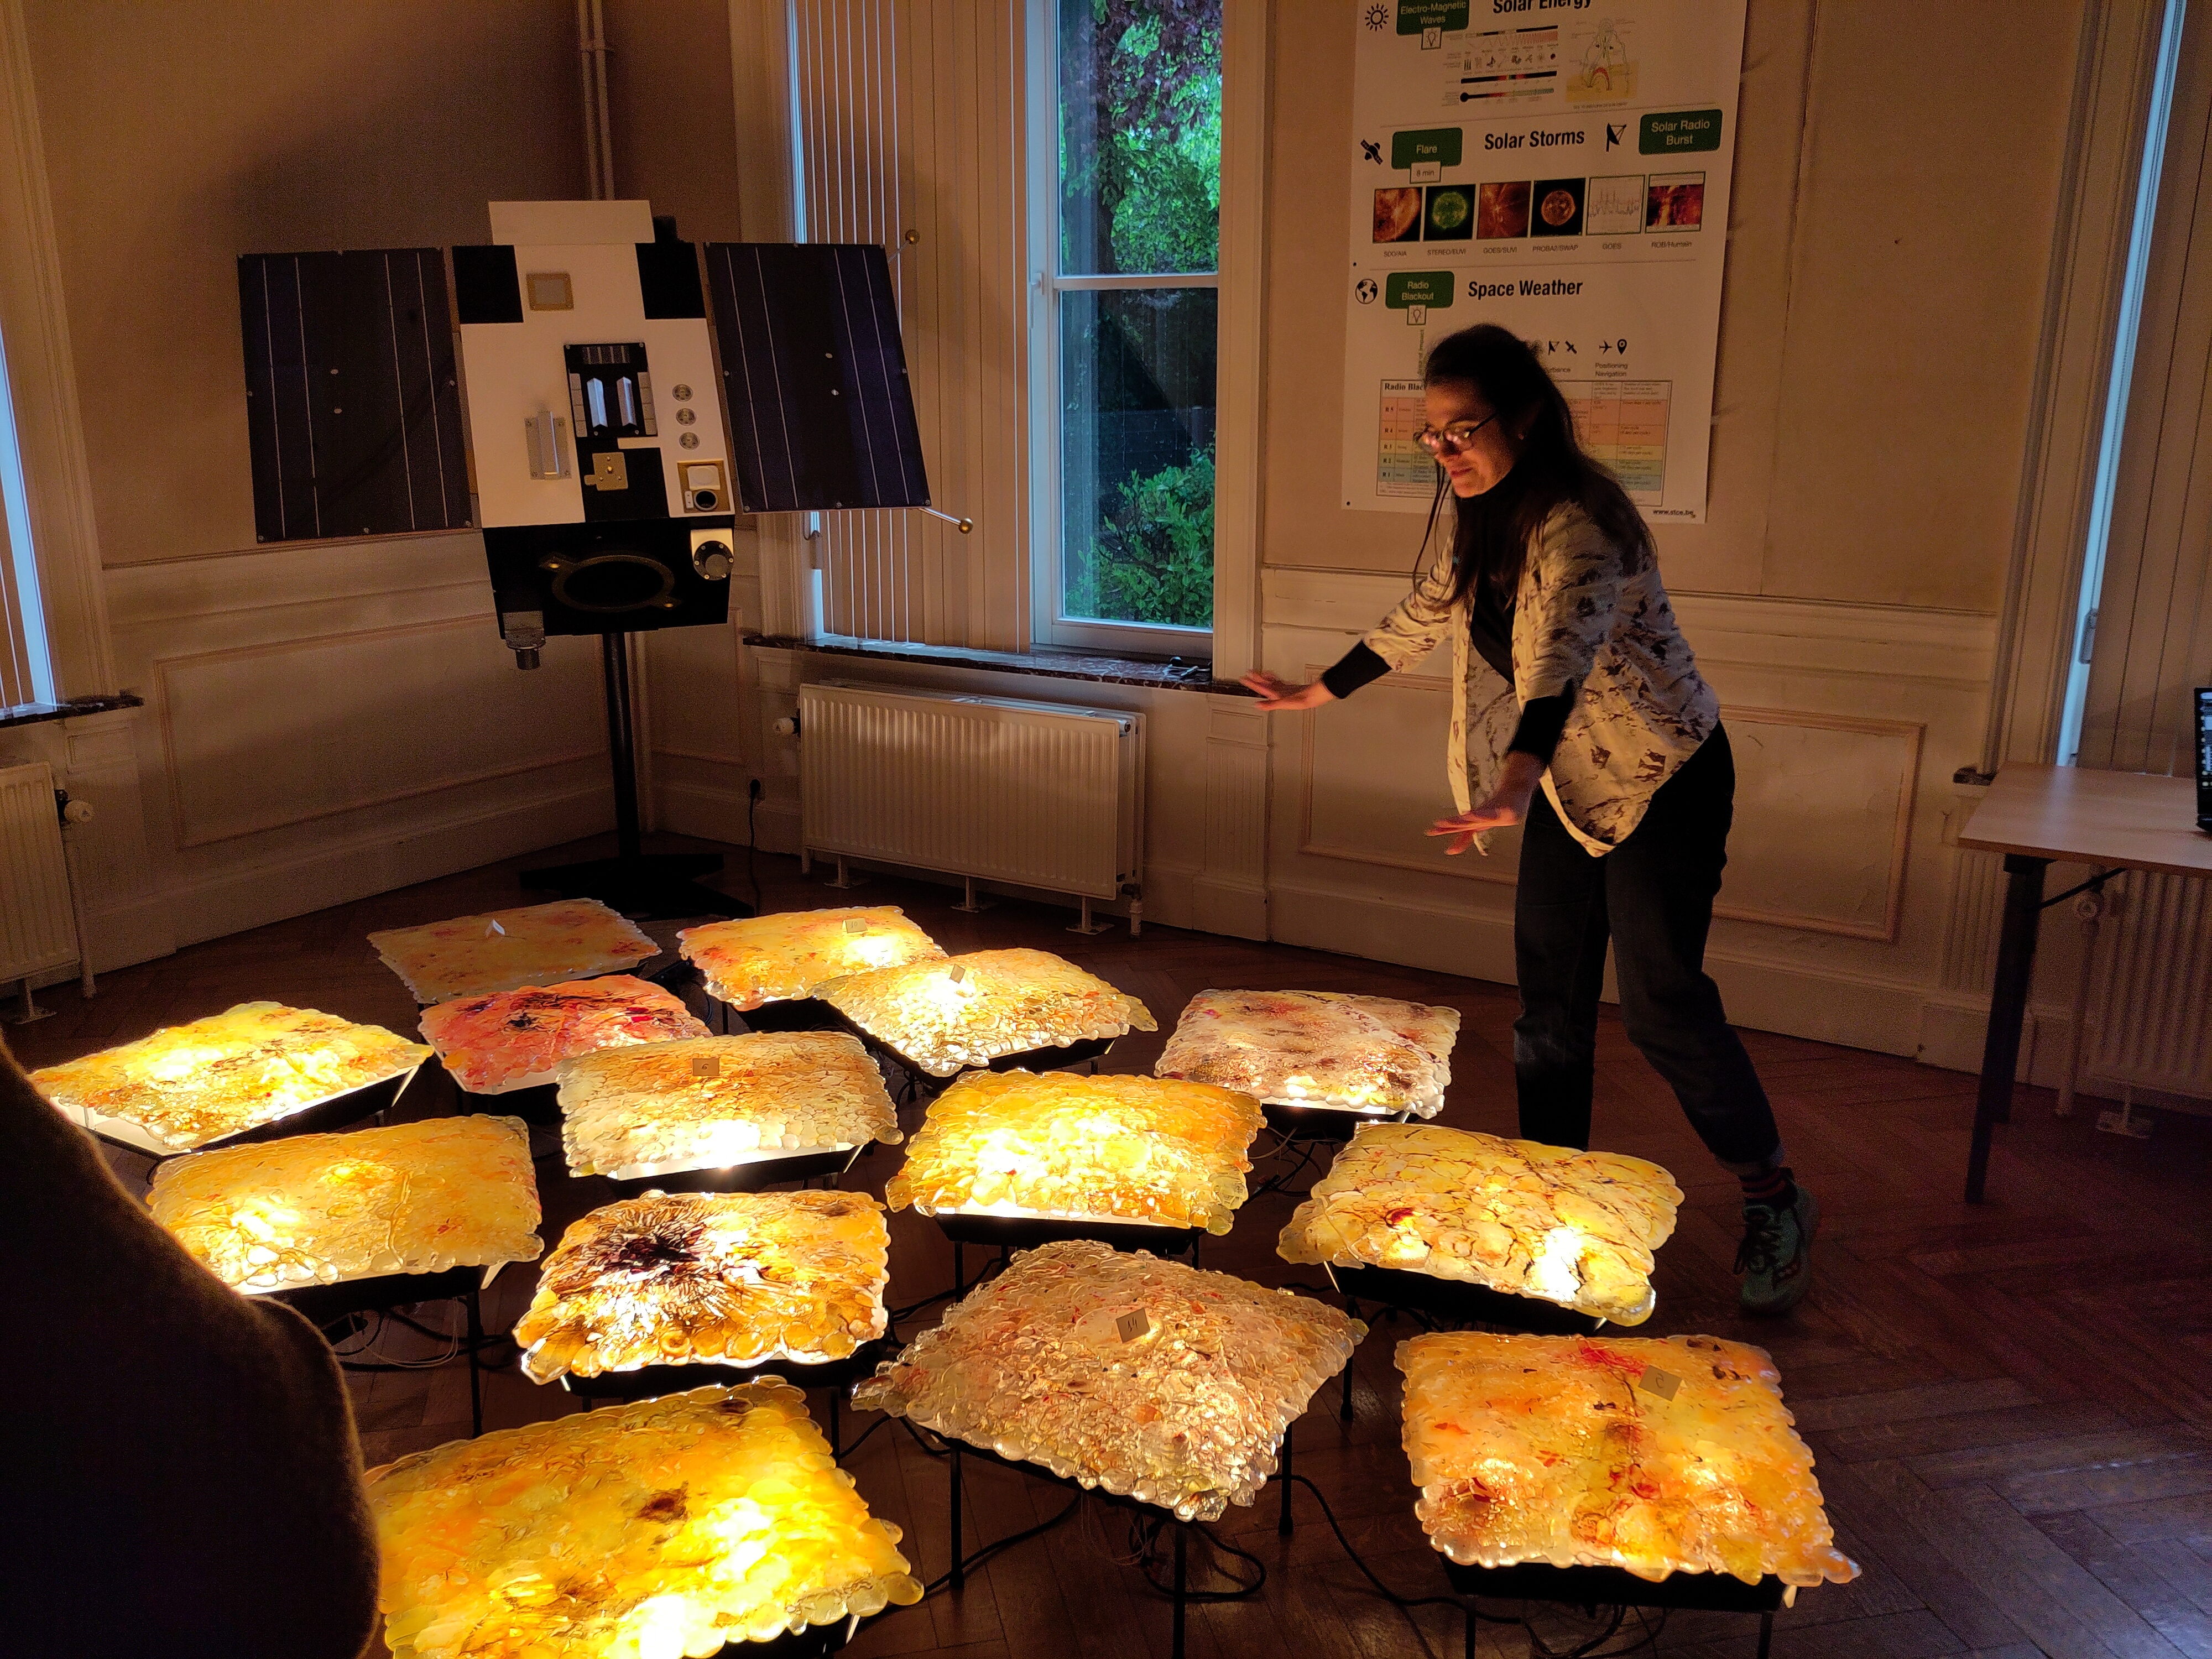
Pepa Ivanova got the PhD degree on May 6, 2024 for her research on the relation between solar science and art which resulted in the dissertation 'Solar Stasis'. An art installation supported the part 'An Echo of the Sun’ that reflects on the evolution and coexistence between the Earth and the Sun.
Pepa: "In this practice-based Ph.D. research I examine the cultural values embodied in science and the aesthetics behind solar observations with emphasis on the sun-earth cohabitation. I investigate the phenomenological approach described in those fields and dive into the meaning-making processes essential for collaborative art-science practices. I look at how numerical, machine-generated knowledge production and a large amount of observational, scientific data have become an artifact in society and culture today. How algorithms have made their way from their technocentric habitat into the living, while scientific processes have become recipients of cultural and aesthetic values. I draw inspiration from contemporary philosophers such as Luciana Parisi and her "soft thought" and “autopoiesis” in algorithmic architecture. I discuss those two philosophical concepts, in relation to datasets and customized algorithms applied in the realization of the suNEARth interface, Picturing Earth's Light, and WARMTH installation.
My approach presupposes that scientific observations are an active agency in meaning-making in culture today. In this way, I build on Alexander Chizhevsky’s hypothesis that the earth's ecosystem is echoing the sun's activity. For example, to highlight the sun-earth cohabitation I perform solar observational data with audio field recordings of the Earth (suNEARth interface). These concepts and the supporting artworks will be discussed during my phd defence along with presentation of WARMTH installation installed at the Observatory."
International Sunspot Number by SILSO

The daily Estimated International Sunspot Number (EISN, red curve with shaded error) derived by a simplified method from real-time data from the worldwide SILSO network. It extends the official Sunspot Number from the full processing of the preceding month (green line), a few days more than one solar rotation. The horizontal blue line shows the current monthly average. The yellow dots give the number of stations that provided valid data. Valid data are used to calculate the EISN. The triangle gives the number of stations providing data. When a triangle and a yellow dot coincide, it means that all the data is used to calculate the EISN of that day.
Noticeable Solar Events
| DAY | BEGIN | MAX | END | LOC | XRAY | OP | 10CM | TYPE | Cat | NOAA |
| 29 | 0033 | 0048 | 0054 | S8W40 | M2.5 | 1N | 74 | 3654 | ||
| 29 | 0054 | 0111 | 0120 | M3.7 | 74 | 3654 | ||||
| 30 | 0046 | 0114 | 0131 | S6W50 | M1.6 | SF | VI/1 | 74 | 3654 | |
| 30 | 1450 | 1511 | 1526 | S7W60 | M1.2 | SF | 74 | 3654 | ||
| 30 | 1611 | 1633 | 1647 | S5W60 | M1.3 | SF | III/1 | 74 | 3654 | |
| 30 | 2323 | 2346 | 2358 | S5W63 | M9.5 | 2B | III/2 | 74 | 3654 | |
| 01 | 1417 | 1432 | 1437 | S5W75 | M1.8 | SN | III/1 | 74 | 3654 | |
| 01 | 1437 | 1444 | 1448 | S8W75 | M1.9 | SN | III/1 | 74 | 3654 | |
| 01 | 2226 | 2231 | 2237 | N25E24 | M1.8 | SN | V/3III/2 | 3663 | ||
| 02 | 0207 | 0217 | 0224 | N25E23 | M1.0 | 1N | VI/1 | 84 | 3663 | |
| 02 | 2052 | 2057 | 2101 | M2.7 | III/2 | 86 | 3664 | |||
| 03 | 0008 | 0015 | 0019 | S21E59 | M2.7 | 1N | III/3 | 86 | 3664 | |
| 03 | 0211 | 0222 | 0227 | N25E7 | X1.6 | 1B | III/2VI/2II/2IV/1 | 84 | 3663 | |
| 03 | 0805 | 0811 | 0816 | N24E5 | M4.4 | SB | III/1 | 84 | 3663 | |
| 03 | 2225 | 2247 | 2311 | N26W6 | M1.2 | SF | III/3 | 3654 | ||
| 03 | 2311 | 2316 | 2320 | N26W6 | M1.0 | SF | III/3 | 84 | 3663 | |
| 03 | 2324 | 2330 | 2336 | N26W6 | M2.4 | SN | III/2 | 84 | 3663 | |
| 04 | 0026 | 0036 | 0044 | N26W6 | M1.6 | SF | 84 | 3663 | ||
| 04 | 0602 | 0619 | 0630 | N26W8 | M9.1 | 1B | III/3II/1IV/1 | 84 | 3663 | |
| 04 | 0704 | 0707 | 0711 | M1.5 | 84 | 3663 | ||||
| 04 | 1810 | 1820 | 1825 | M1.3 | 84 | 3663 | ||||
| 04 | 2223 | 2237 | 2254 | M3.2 | 84 | 3663 | ||||
| 04 | 2328 | 2348 | 2355 | N26W10 | M9.0 | 1B | III/1 | 84 | 3663 | |
| 05 | 0115 | 0127 | 0143 | N26W10 | M8.4 | 1B | VI/1 | 84 | 3663 | |
| 05 | 0547 | 0601 | 0607 | N26W10 | X1.3 | 1B | III/3 | 84 | 3663 | |
| 05 | 0807 | 0819 | 0824 | N27W21 | M1.3 | SF | 84 | 3663 | ||
| 05 | 0923 | 0938 | 0953 | S20E22 | M2.3 | SN | III/1 | 86 | 3664 | |
| 05 | 0953 | 1000 | 1019 | N26W21 | M7.4 | 1B | VI/1 | 84 | 3663 | |
| 05 | 1141 | 1154 | 1216 | N26W22 | X1.2 | 1B | 84 | 3663 | ||
| 05 | 1433 | 1447 | 1456 | N25W25 | M1.3 | SF | VI/1 | 84 | 3663 | |
| 05 | 1528 | 1538 | 1551 | N24W26 | M2.2 | 2N | 84 | 3663 | ||
| 05 | 1655 | 1701 | 1706 | S19E25 | M1.3 | 1F | III/2 | 86 | 3664 | |
| 05 | 1834 | 1840 | 1845 | S19E25 | M1.0 | SF | III/1 | 86 | 3664 | |
| 05 | 1944 | 1952 | 2006 | N24W28 | M1.3 | 2N | III/1 | 84 | 3663 |
| LOC: approximate heliographic location | TYPE: radio burst type |
| XRAY: X-ray flare class | Cat: Catania sunspot group number |
| OP: optical flare class | NOAA: NOAA active region number |
| 10CM: peak 10 cm radio flux |
Geomagnetic Observations in Belgium
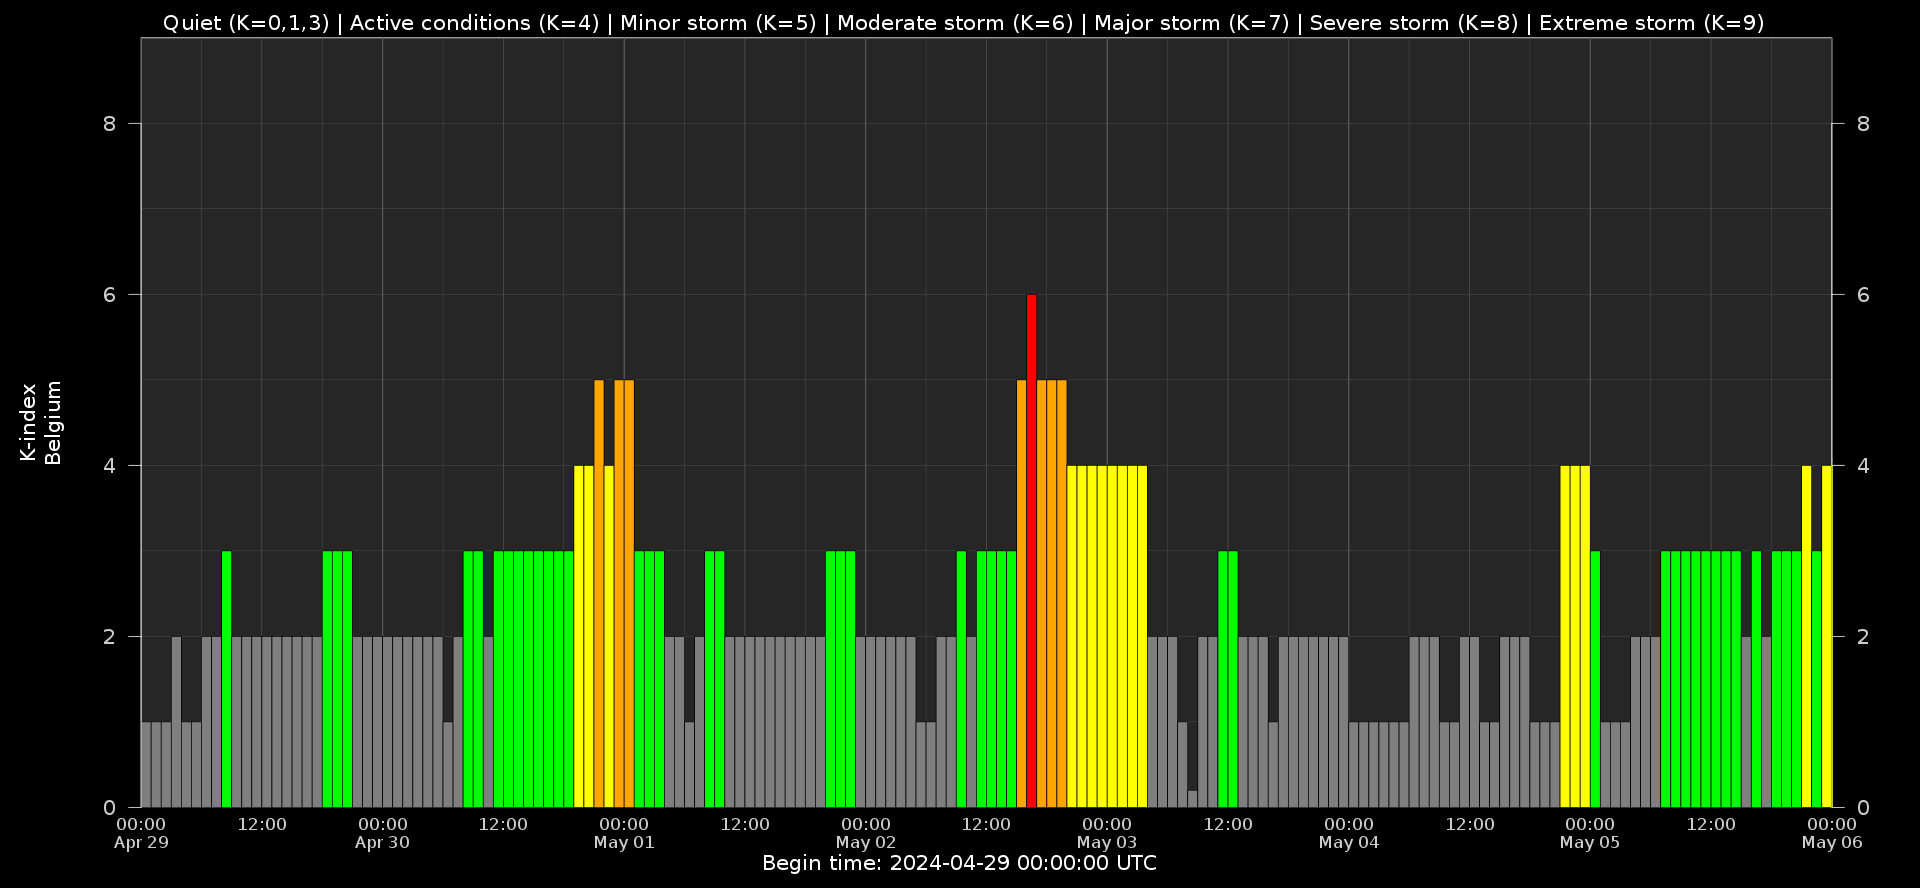
Local K-type magnetic activity index for Belgium based on data from Dourbes (DOU) and Manhay (MAB). Comparing the data from both measurement stations allows to reliably remove outliers from the magnetic data. At the same time the operational service availability is improved: whenever data from one observatory is not available, the single-station index obtained from the other can be used as a fallback system.
Both the two-station index and the single station indices are available here: http://ionosphere.meteo.be/geomagnetism/K_BEL/
PROBA2 Observations (29 Apr 2024 - 5 May 2024)
Solar Activity
Solar flare activity fluctuated from moderate to very high during the week.
In order to view the activity of this week in more detail, we suggest to go to the following website from which all the daily (normal and difference) movies can be accessed: https://proba2.oma.be/ssa
This page also lists the recorded flaring events.
A weekly overview movie (SWAP week 736) can be found here: https://proba2.sidc.be/swap/data/mpg/movies/weekly_movies/weekly_movie_2024_04_29.mp4.
Details about some of this week's events can be found further below.
If any of the linked movies are unavailable they can be found in the P2SC movie repository here: https://proba2.oma.be/swap/data/mpg/movies/.
Friday May 03
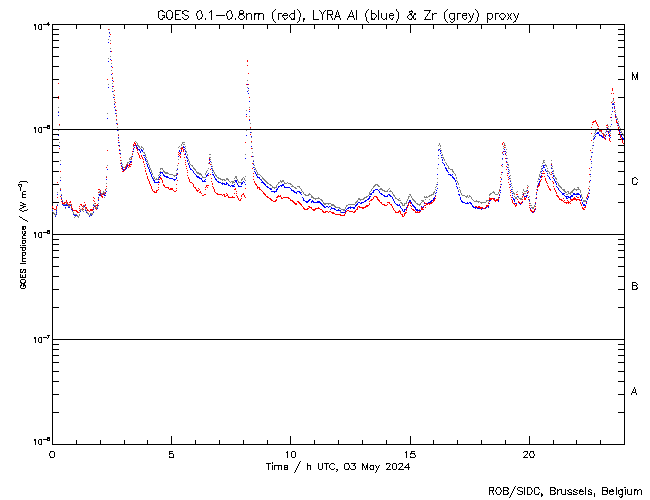
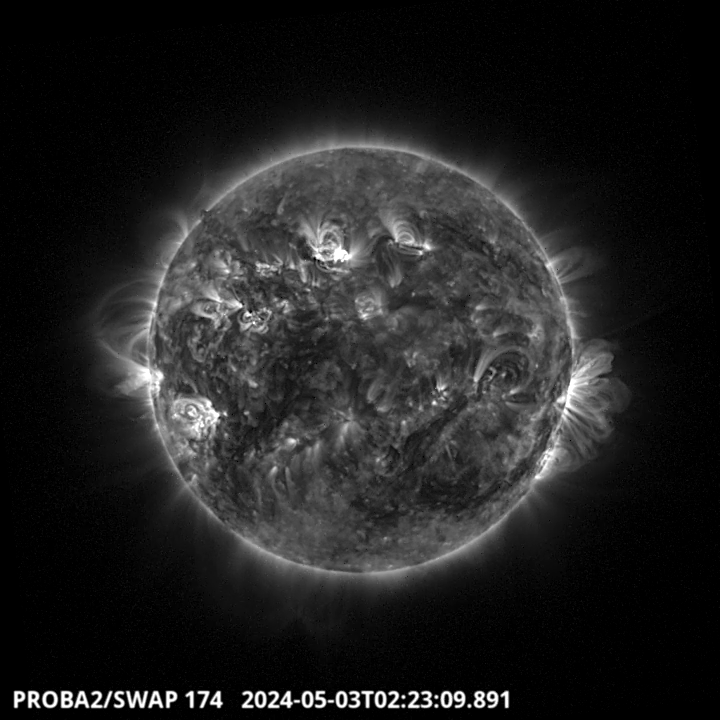
The largest flare of this active week was an X1.6, and it was observed by LYRA (top panel) and SWAP (bottom panel). The flare peaked on 2024-May-03 at 02:22 UT. It occurred in the northern hemisphere close to the central meridian, and it originated from NOAA AR3663.
Find a SWAP movie of the event here: https://proba2.sidc.be/swap/movies/20240503_swap_movie.mp4.
The SIDC Space Weather Briefing
The SIDC briefing that gives an overview of space weather from April 28 to May 5: https://www.stce.be/briefings/20240506_SWbriefing.pdf
Review of Ionospheric Activity
NEW! The time series below illustrates (in green) the VTEC deviation from normal quiet behaviour.


VTEC time series at 3 locations in Europe from 29 Apr 2024 till 5 May 2024
The top figure shows the time evolution of the Vertical Total Electron Content (VTEC) (in red) during the last week at three locations:
a) in the northern part of Europe(N 61deg E 5deg)
b) above Brussels(N 50.5deg, E 4.5 deg)
c) in the southern part of Europe(N 36 deg, E 5deg)
This top figure also shows (in grey) the normal ionospheric behaviour expected based on the median VTEC from the 15 previous days.
The time series below shows the VTEC difference (in green) and relative difference (in blue) with respect to the median of the last 15 days in the North, Mid (above Brussels) and South of Europe. It thus illustrates the VTEC deviation from normal quiet behaviour.
The VTEC is expressed in TECu (with TECu=10^16 electrons per square meter) and is directly related to the signal propagation delay due to the ionosphere (in figure: delay on GPS L1 frequency).
The Sun's radiation ionizes the Earth's upper atmosphere, the ionosphere, located from about 60km to 1000km above the Earth's surface.The ionization process in the ionosphere produces ions and free electrons. These electrons perturb the propagation of the GNSS (Global Navigation Satellite System) signals by inducing a so-called ionospheric delay.
See http://stce.be/newsletter/GNSS_final.pdf for some more explanations; for more information, see https://gnss.be/SpaceWeather
Courses and presentations
Courses and presentations with the Sun-Space-Earth interaction and Space Weather as the main theme. We provide occasions to get submerged in our world through educational, informative and instructive activities.
* May 13, lecture by the STCE, From physics to forecasting, ESA Space Weather Training Course 2024, Euro Space Center, Redu, Belgium
* May 14, STCE Seminar, Segmentation, grouping and classification of sunspots from ground-based observations using deep learning methods
* May 13 - 17, lectures by the STCE, solar and heliospheric weather; magnetosphere, ionosphere, aviation, and ground based impact, Course Operational Space Weather Fundamentals, L'Aquila, Italy
* May 18, Public presentation, The PROBA-3 Mission: Artificial Total Solar Eclipse in Space, FotonFest, Urania, Hove, Belgium
* May 28, Solar physics and Space Weather: Solar Orbiter Spacecraft, online course - Registrations are open
* June 7, STCE seminar, Ground level enhancements: probing conditions of the geospace environment
* June 9, Public presentation Total Eclipse of the Sun, Helios, Averbode, Belgium
* June 13, STCE seminar, Solar Prominence Eruptions: Insights from UV Imaging with EUI/FSI
* June 25, Solar physics and Space Weather: predictions and services, online course - Registrations are open
* June 27, STCE annual meeting, Brussels, Belgium
* June 28, public presentation Help! Het stormt in de ruimte!?, Wetenschappelijke middagen, Brussels, Belgium
To register for a course or lecture, check the page of the STCE Space Weather Education Center: https://www.stce.be/SWEC
If you want your event in the STCE newsletter, contact us: stce_coordination at stce.be