- Table of Content
- 1.GNSS impacts f...
- 2.In honour of G...
- 3.Space Weather ...
- 4.Visit of ESA A...
- 5.Review of sola...
- 6.International ...
- 7.PROBA2 Observa...
- 8.Noticeable Sol...
- 9.Geomagnetic Ob...
- 10.Review of Iono...
- 11.The SIDC Space...
- 12.STCE Activitie...
2. In honour of Giovanni Lapenta
3. Space Weather Lab
4. Visit of ESA Academy students
5. Review of solar and geomagnetic activity
6. International Sunspot Number by SILSO
7. PROBA2 Observations
8. Noticeable Solar Events
9. Geomagnetic Observations in Belgium
10. Review of Ionospheric Activity
11. The SIDC Space Weather Briefing
12. STCE Activities
GNSS impacts from the 10-11 May extreme storm
The ionosphere is located in the upper part of the Earth's atmosphere, between roughly 60 and 1000 km above the Earth's surface (see also this STCE newsitem at https://www.stce.be/news/640/welcome.html ). It is a partially ionized layer consisting of neutral atoms, molecules and charged particles. The latter are created by the ionizing effect of the extreme ultraviolet (EUV) and x-ray solar radiation on the atoms and molecules thus creating a layer of ions and electrons. At the altitude where the highest electron density occurs (a million electrons/cm3 at 250-450 km), only about one in every 1000 particles is ionized. This can be seen in the graph underneath, with the density of neutrals and ions indicated by respectively the green and other-coloured lines (Akbari 2015; Kelley 1989 - eBook ISBN: 9780323148054 ; Johnson 1969). The electron density is shown by the thick black line, and coincides with the evolution of the density of ionized oxygen (O+ ; orange line). Yet this relatively small number of electrons in the ionosphere is sufficient to affect radio communication as well as satellite signals used for communication and navigation. Solar flares (on the Earth's dayside), proton events (affecting the Earth's poles), and geomagnetic storms induced by passing coronal mass ejections (CMEs) can further affect the radio propagation and navigation capabilities.

One of the parameters used to characterize the ionospheric conditions is the vertical total electron content (VTEC for short). TEC is the total number of free electrons integrated along the raypath between the GPS satellite and the receiver on the ground. It is estimated in a unit called TECU in which 1 TECU = 10^16 electrons/m2. The VTEC is the vertical value of TEC projected from this raypath and thus independent of the elevation of the raypath. These electrons perturb the propagation of the GNSS (Global Navigation Satellite System) signals by inducing a so-called ionospheric delay. The VTEC is directly related to the signal propagation delay due to the ionosphere (delay on GPS frequencies). These ionospheric conditions are closely monitored by the STCE at the Royal Observatory of Belgium (ROB). The time series below is a time series of the VTEC (in red), the expected VTEC based on observations of the last 15 days (in grey), and the 5-min VTEC variability (in blue) in the North, Middle (Brussels) and South of Europe. The near-real time VTEC over Europe showed abnormal variations during the night of 10 to 11 May 2024. This is due to the strong CME impact detected during the afternoon of 10 May. This event resulted in sudden increases/decreases of the VTEC and high variability from 18:00 UTC on 10 May until the end of 11 May, especially over Northern-Europe.

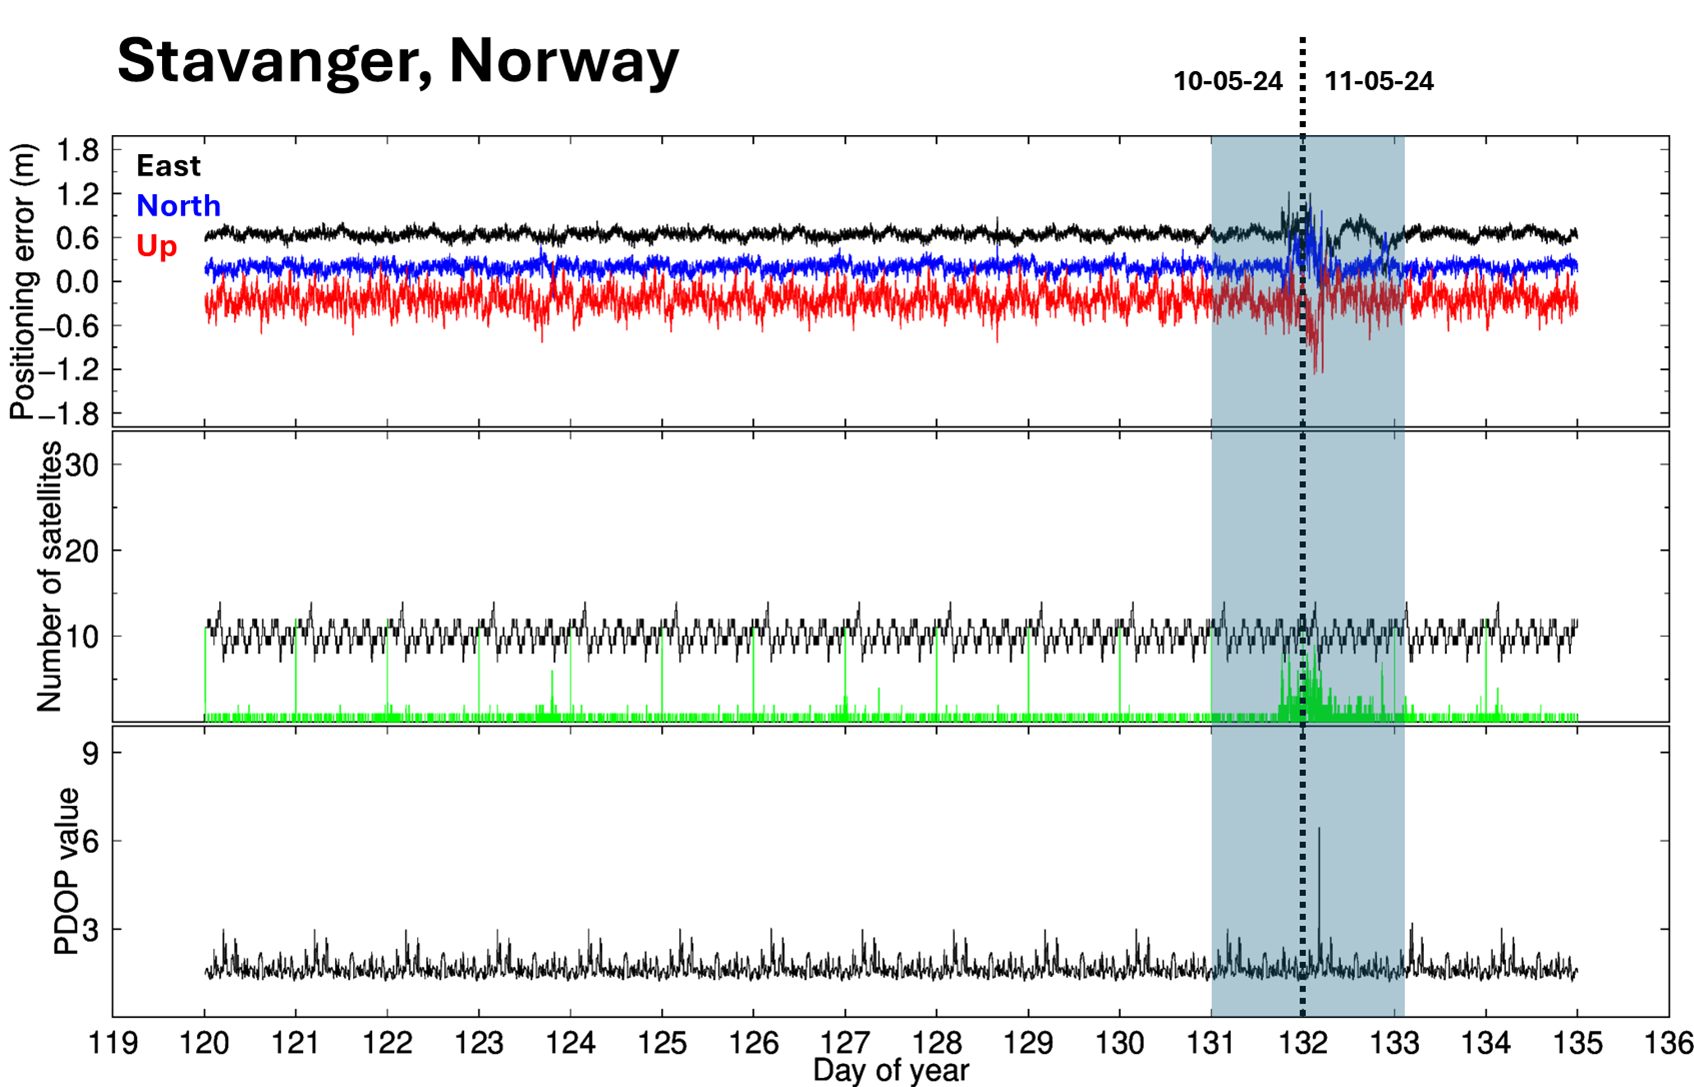
Additionally, the GPS single frequency kinematic positioning showed some abnormal errors, coinciding with these ionospheric disturbances (graphs underneath). While the position should be stable at cm level, the positions estimated during the event showed strong variations of several decimeters up to one meter. This can be explained by the loss of the signal from several satellites at the same time implying an increase of the PDOP (position dilution of precision), i.e. a decrease in positioning accuracy. The graph underneath shows 15-days GPS single frequency position variation for a station situated in Norway. Day of year 131 and 132 correspond to 10 and 11 May 2024 respectively, i.e. during the extreme geomagnetic storm. The top graph shows the kinematic positions in the three components. The middle graph indicates in black the number of satellites that are used for the estimation of the position, and in green the number of satellites for which the tracking signal was lost. The graph at the bottom shows PDOP (position dilution of precision) representing the error caused by the relative position of the GPS satellites. Further results are presently being analyzed to correlate the ionospheric activity and the GPS position degradation on a global basis.
The combo underneath shows the effect of the 10-11 May geomagnetic storm on the VTEC over most of Europe on 10 May at 20:25-20:30 UTC (from the dedicated ROB website at https://gnss.be/SpaceWeather/iono_activity_maps.php ). A related clip (1 hour cadence) is available at https://www.stce.be/news/706/welcome.html The top left displays near real-time VTEC maps whereas the top right shows the expected VTEC maps. The most important map is then the one on the bottom left, which shows the differences between observed and expected VTEC maps. The bottom right is a histogram of the observed differences. Clearly, the geomagnetic storm had a strong impact on the ionosphere, with the electron density gradually evolving into a lower than usual value (blue colour). This meant that for High Frequency (HF) communication, the portion of higher HF frequencies was not available for HF communication, and so several advisories were sent to civil aviation via PECASUS (https://pecasus.eu/ ) to warn for this so-called "post-storm depression" (PSD).
.png)
This newsitem was written with the generous contribution of Nicolas Bergeot, Jean-Marie Chevalier and Jiang Guo (ROB/STCE - https://www.stce.be).
In honour of Giovanni Lapenta
Dear Friends
This was the way Giovanni Lapenta often addressed colleagues in an e-mail. It says a lot about the way he looked at people, how he treated them and how he stood in life. In the many projects he was responsible for, he made you feel comfortable. To him, we were happy to do our very best.
Giovanni had a talent to see opportunities and combinations of new and old methods needed to go the extra research mile. He saw new scientific ways and made them accessible to others.
The news of his death hit like a bomb.
Gianni, we have to say goodbye and that hurts.

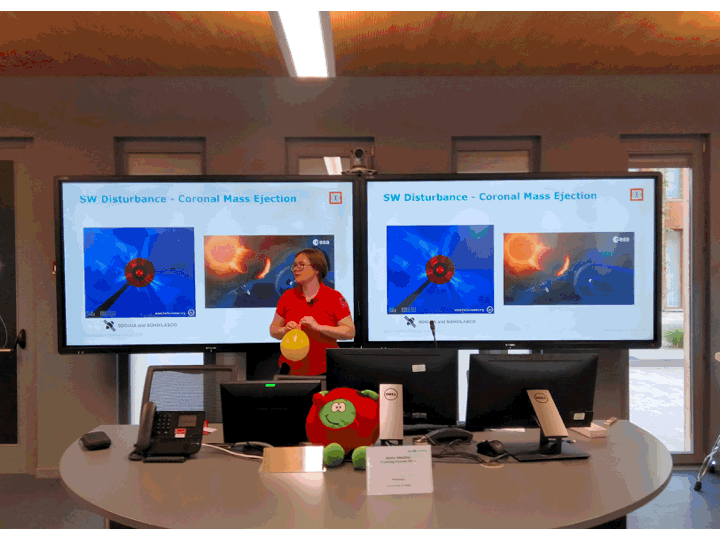
Space Weather Lab
May 2024, Aquila, Italy
50 students
Pasta and anti-pasta
Operations and Space Weather Fundamentals
Informal environment to network and discuss
Wine festival
Plan B for a broken bus
Sun - Earth and the interaction
Ways to talk to non-experts
Excellent gelato
These were the ingredients of the course on 'Operational Space Weather Fundamentals' (https://www.astrogeofisica.it/oswf/Default.aspx)
The STCE was invited to give the lab activity on solar and heliospheric weather, magnetosphere, ionosphere, aviation and ground based impact.
It was fun and enthusing. We had the liberty to fill in the lab activity as we wanted in a very nice setting.
The main highlight: to meet old friends and make new ones.
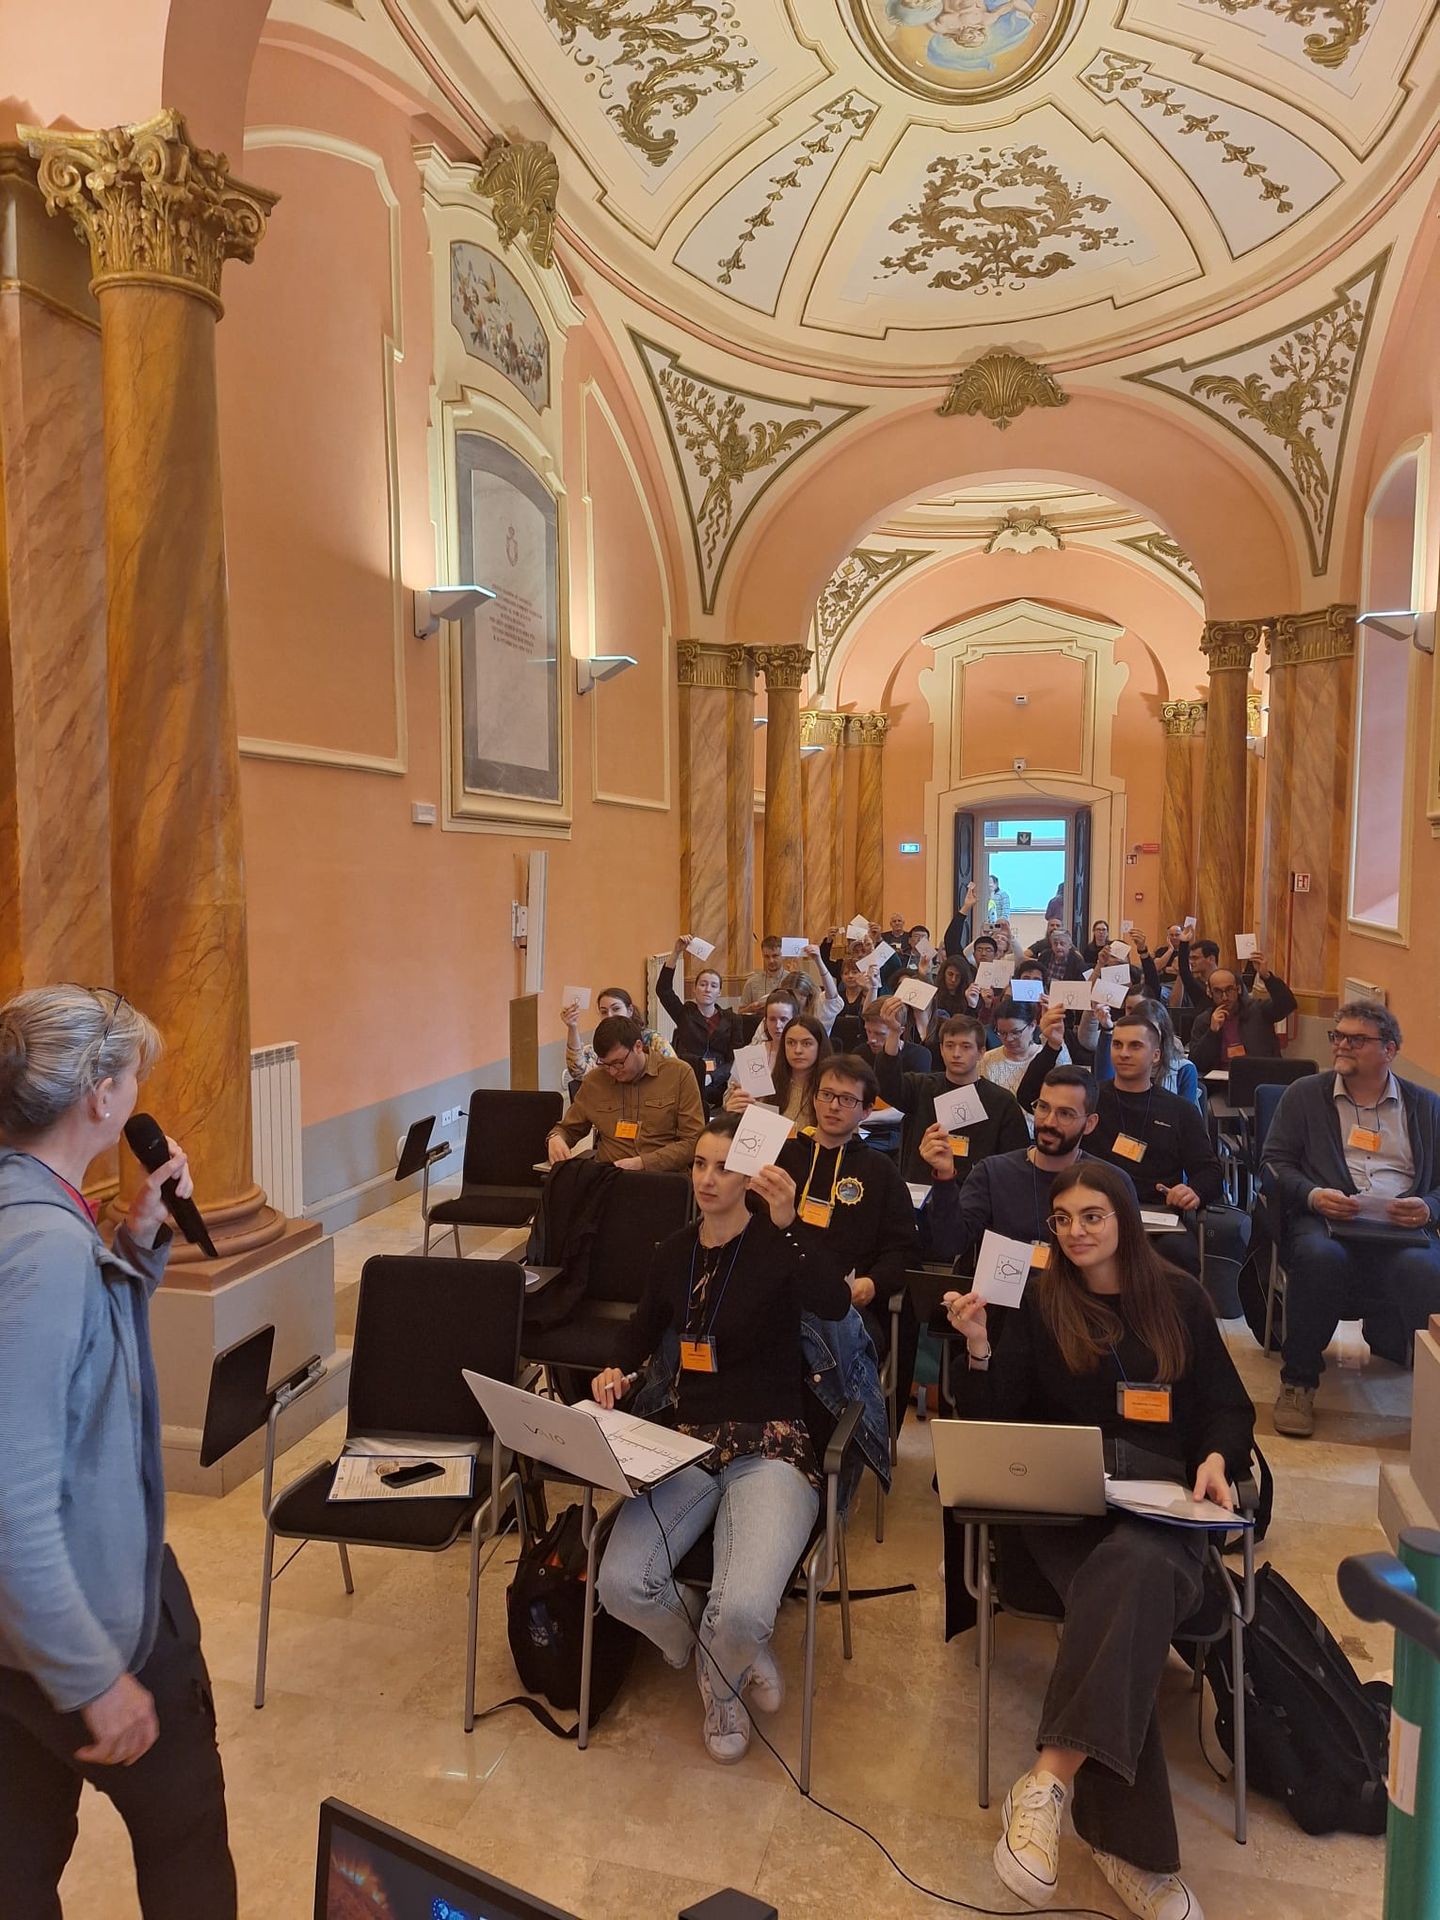
Visit of ESA Academy students
The ESA Academy organized a second edition of their Space Weather Training course. 30 university students from 16 different nationalities were selected to follow courses by experts on various topics related to space weather and its impacts. ESA Academy invited STCE experts to provide part of this training and we saw a group of enthusiastic, engaged and fun students.
We were thus very happy to receive them for a visit to the STCE premises in Brussels on May 15. It was an afternoon filled with exhibits, information, jokes and space weather games.
Review of solar and geomagnetic activity
WEEK 1221 from 2024 May 20
Solar Active Regions and flares
During the week, 20 Active Regions (ARs) were visible: NOAA AR 3672 to 3692. There were 16 M-class flares, produced by NOAA ARs 3685 (beta-gamma magnetic field configuration) on 19 May, 3679 (beta-gamma-delta) on May 21-24, 3683 (beta) on 22 May and 3689 (beta) on May 23.
Coronal mass ejections
There was one CME with a possible Earth directed component, originating from a large filament eruption in the SE quadrant on 23 May. The CME was first seen by LASCO C2 at 01:12 UT on 23 May, followed by other minor eruptions in the vicinity. The CME angular width was about 80 degrees and the speed about 350 km/s.
Coronal Holes
There were two high latitude coronal holes visible, one in the southern and one in the northern hemisphere. The one in the north (negative polarity) had a low latitudinal extension.
Proton flux levels
The 10 MeV GOES-18 proton flux was below threshold throughout the week.
Electron fluxes at GEO
The greater than 2 MeV electron flux from GOES 16 was below the threshold level during the week. The electron fluence was at normal levels throughout the week.
Solar wind
The solar wind, measured in L1, was slow during the whole week, with speeds remaining below 500 km/s and interplanetary magnetic field below 10 nT (mostly with positive polarity).
Geomagnetism
Geomagnetic conditions were quiet most of the week, except for a short 3-hour period of Kp reaching 4 on 23 May.
International Sunspot Number by SILSO

The daily Estimated International Sunspot Number (EISN, red curve with shaded error) derived by a simplified method from real-time data from the worldwide SILSO network. It extends the official Sunspot Number from the full processing of the preceding month (green line), a few days more than one solar rotation. The horizontal blue line shows the current monthly average. The yellow dots give the number of stations that provided valid data. Valid data are used to calculate the EISN. The triangle gives the number of stations providing data. When a triangle and a yellow dot coincide, it means that all the data is used to calculate the EISN of that day.
PROBA2 Observations
Solar Activity
Solar flaring activity fluctuated from low to moderate during the week.
In order to view the activity of this week in more detail, we suggest to go to the following website from which all the daily (normal and difference) movies can be accessed: https://proba2.oma.be/ssa
This page also lists the recorded flaring events.
A weekly overview movie (SWAP week 739) can be found here: https://proba2.sidc.be/swap/data/mpg/movies/weekly_movies/weekly_movie_2024_05_20.mp4.
Details about some of this week's events can be found further below.
If any of the linked movies are unavailable they can be found in the P2SC movie repository here: https://proba2.oma.be/swap/data/mpg/movies/.
Thursday May 23
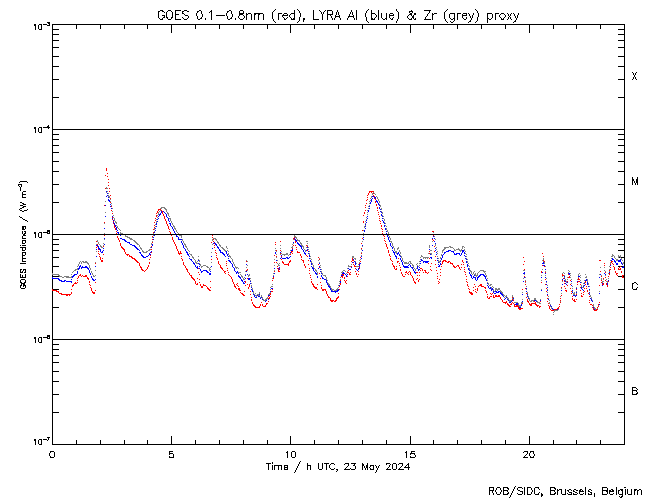
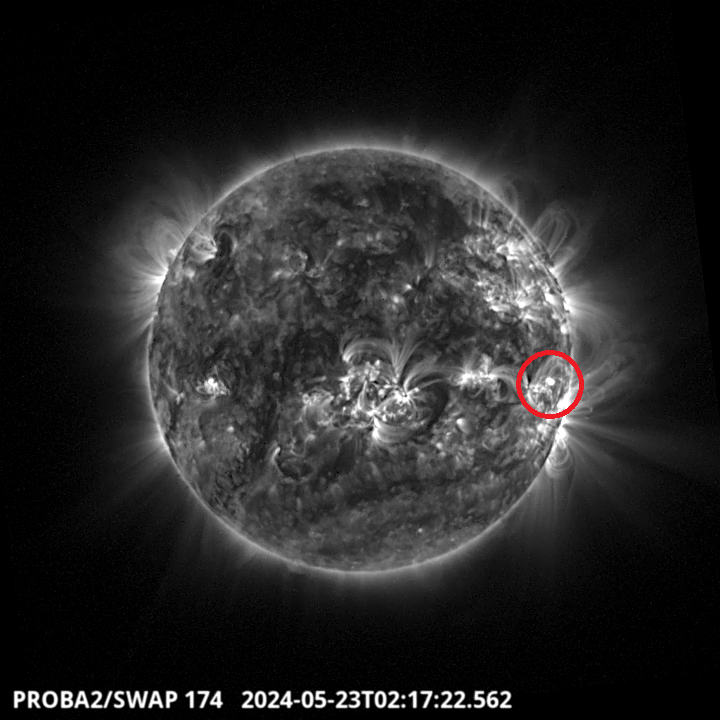
The largest flare of this week was an M4.2, and it was observed by LYRA (top panel) and SWAP (bottom panel). The flare peaked on 2024-May-23 at 02:16 UT. It occurred close to the equator and to the western limb in the region encircled in red, and it originated from NOAA AR3679.
Find a SWAP movie of the event here: https://proba2.sidc.be/swap/movies/20240523_swap_movie.mp4.
Noticeable Solar Events
| DAY | BEGIN | MAX | END | LOC | XRAY | OP | 10CM | TYPE | Cat | NOAA |
| 21 | 1919 | 1931 | 1939 | S5W48 | M1.9 | 1N | VI/1 | 6 | 3679 | |
| 22 | 0302 | 0313 | 0323 | S6W52 | M1.5 | SN | 6 | 3679 | ||
| 22 | 0338 | 0404 | 0422 | M2.3 | CTM/1VI/1 | 3683 | ||||
| 22 | 1351 | 1405 | 1412 | S6W55 | M1.2 | SF | 6 | 3679 | ||
| 23 | 0205 | 0216 | 0226 | M4.2 | 6 | 3679 | ||||
| 23 | 0403 | 0429 | 0454 | S9W18 | M1.7 | SF | VI/2 | 6 | 3679 | |
| 23 | 1003 | 1008 | 1014 | M1.0 | ||||||
| 23 | 1248 | 1320 | 1344 | S9W65 | M2.5 | SF | VI/2 | 6 | 3679 | |
| 23 | 1553 | 1558 | 1603 | M1.0 | 17 | 3689 | ||||
| 24 | 0628 | 0706 | 0721 | S7W81 | M1.4 | SF | III/2 | 6 | 3679 | |
| 24 | 0751 | 0801 | 0808 | S9W81 | M1.0 | SF | 6 | 3679 | ||
| 24 | 2005 | 2025 | 2036 | M1.4 | 6 | 3679 |
| LOC: approximate heliographic location | TYPE: radio burst type |
| XRAY: X-ray flare class | Cat: Catania sunspot group number |
| OP: optical flare class | NOAA: NOAA active region number |
| 10CM: peak 10 cm radio flux |
Geomagnetic Observations in Belgium

Local K-type magnetic activity index for Belgium based on data from Dourbes (DOU) and Manhay (MAB). Comparing the data from both measurement stations allows to reliably remove outliers from the magnetic data. At the same time the operational service availability is improved: whenever data from one observatory is not available, the single-station index obtained from the other can be used as a fallback system.
Both the two-station index and the single station indices are available here: http://ionosphere.meteo.be/geomagnetism/K_BEL/
Review of Ionospheric Activity
NEW! The time series below illustrates (in green) the VTEC deviation from normal quiet behaviour.


VTEC time series at 3 locations in Europe from 20 May 2024 till 26 May 2024
The top figure shows the time evolution of the Vertical Total Electron Content (VTEC) (in red) during the last week at three locations:
a) in the northern part of Europe(N 61deg E 5deg)
b) above Brussels(N 50.5deg, E 4.5 deg)
c) in the southern part of Europe(N 36 deg, E 5deg)
This top figure also shows (in grey) the normal ionospheric behaviour expected based on the median VTEC from the 15 previous days.
The time series below shows the VTEC difference (in green) and relative difference (in blue) with respect to the median of the last 15 days in the North, Mid (above Brussels) and South of Europe. It thus illustrates the VTEC deviation from normal quiet behaviour.
The VTEC is expressed in TECu (with TECu=10^16 electrons per square meter) and is directly related to the signal propagation delay due to the ionosphere (in figure: delay on GPS L1 frequency).
The Sun's radiation ionizes the Earth's upper atmosphere, the ionosphere, located from about 60km to 1000km above the Earth's surface.The ionization process in the ionosphere produces ions and free electrons. These electrons perturb the propagation of the GNSS (Global Navigation Satellite System) signals by inducing a so-called ionospheric delay.
See http://stce.be/newsletter/GNSS_final.pdf for some more explanations; for more information, see https://gnss.be/SpaceWeather
The SIDC Space Weather Briefing
The forecaster on duty presented the SIDC briefing that gives an overview of space weather from May 20 to 26.
The pdf of the presentation can be found here: https://www.stce.be/briefings/20240527_SWbriefing.pdf
STCE Activities
Courses and presentations with the Sun-Space-Earth system and Space Weather as the main theme. We provide occasions to get submerged in our world through educational, informative and instructive activities.
* June 7, STCE seminar, Ground level enhancements: probing conditions of the geospace environment
* June 9, Public presentation Total Eclipse of the Sun, Helios, Averbode, Belgium
* June 13, STCE seminar, Solar Prominence Eruptions: Insights from UV Imaging with EUI/FSI
* June 25, Solar physics and Space Weather: predictions and services, online course - Registrations are open
* June 27, STCE annual meeting, Brussels, Belgium
* June 28, public presentation Help! Het stormt in de ruimte!?, Wetenschappelijke middagen, Brussels, Belgium
* July 7, public presentation Totale zonsverduistering op vraag, Proba-3, de eclips-satelliet , Zonnekijkdagen, Genk, Belgium
* Sep 27 and 28, STCE at the Wisenight Science festival in the Planetarium, Brussel, https://wisenight.eu/
* Sep 30 - Oct 3, STCE Space Weather Introductory Course, Brussels, Belgium - Registrations are open https://events.spacepole.be/event/204/
* Nov 25 - 27, STCE course: Space Weather impacts on ionospheric wave propagation, focus on GNSS and HF, Brussels, Belgium - Registrations are open, https://events.spacepole.be/event/206/
* Dec 5-6, STCE Course Space Weather impacts on aviation, Brussels, Belgium - Registrations are open, https://events.spacepole.be/event/205/
To register for a course or lecture, check the page of the STCE Space Weather Education Center: https://www.stce.be/SWEC
If you want your event in the STCE newsletter, contact us: stce_coordination at stce.be