- Table of Content
- 1.Return of the ...
- 2.STCE supervise...
- 3.PROBA2 Observa...
- 4.Review of spac...
- 5.International ...
- 6.Noticeable Sol...
- 7.Geomagnetic Ob...
- 8.The SIDC Space...
- 9.Courses, prese...
2. STCE supervises Ethiopian PhD succesfully
3. PROBA2 Observations (27 May 2024 - 2 Jun 2024)
4. Review of space weather
5. International Sunspot Number by SILSO
6. Noticeable Solar Events
7. Geomagnetic Observations in Belgium
8. The SIDC Space Weather Briefing
9. Courses, presentations and activities
Return of the King!
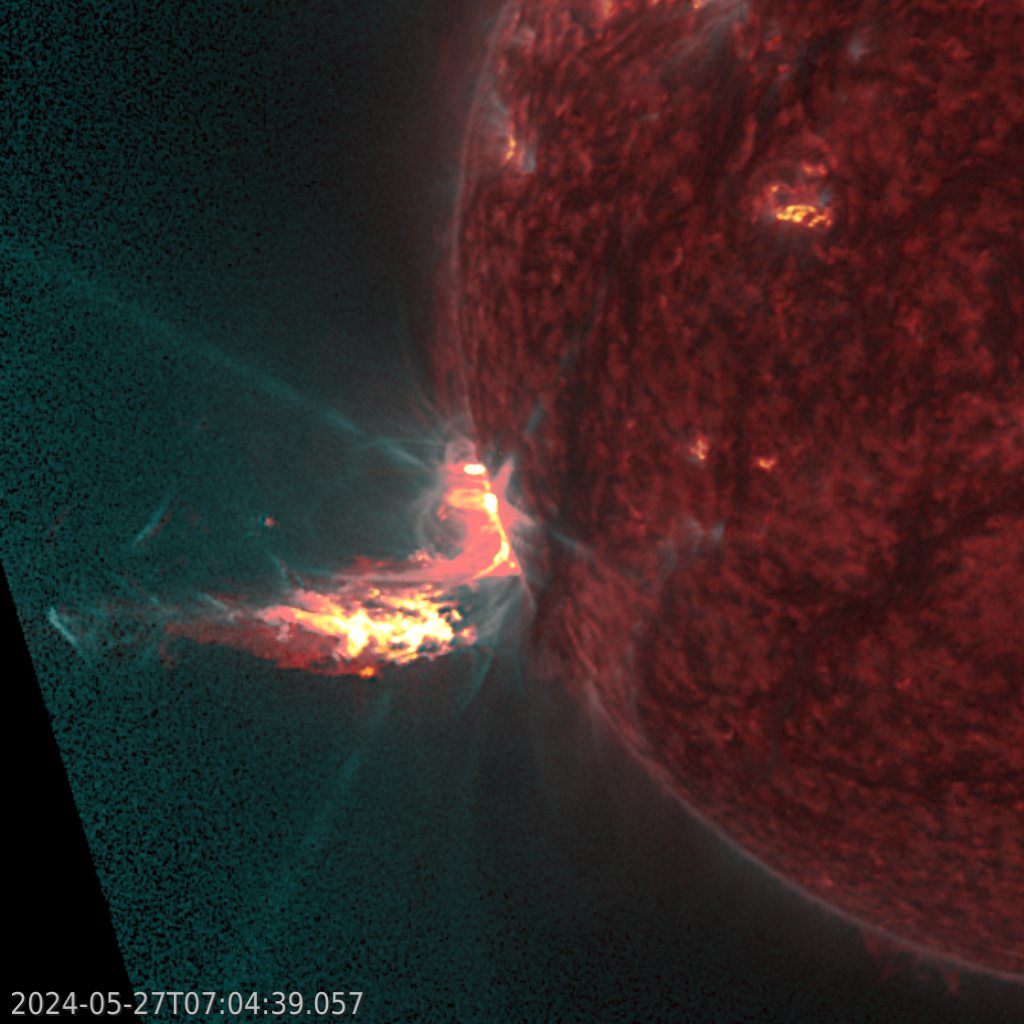
NOAA 3664 was one of the most flare-productive active regions in decades, dominating space weather during the first 2 weeks of May and resulting in the extreme geomagnetic storm of 10-11 May. Two weeks later, after its farside transit on the Sun and while the region was still behind the southeast solar limb, it showed it hadn't lost its flare potential by generating an X2.8 flare on 27 May peaking at 07:08UTC. This X-class event as well as the 4 other X-class flares it subsequently produced, have been discussed in the STCE newsflash at https://www.stce.be/news/705/welcome.html Further updates on space weather activity related to this active region, now numbered as NOAA 3697, have been and will be added there. The image underneath is a combination of extreme ultraviolet images (GOES/SUVI 131 and 304) showing the X2.8 flare at very hot (blue colour) and relatively "cold" (red color) temperatures.
STCE supervises Ethiopian PhD succesfully
On May 30, 2024, Abdisa Kawo Koji successfully defended his doctoral thesis at the Addis Ababa University of Ethiopia and the Ethiopian Space Science and Technology Institute. The thesis entitled "Analysis of atmospheric water vapor in Ethiopia based on GPS observations, global reanalyses, and regional climate models," was supervised by Roeland Van Malderen (RMI, promoter, funded by STCE) and Eric Pottiaux (Royal Observatory of Belgium, co-promoter, funded by STCE). Bert Van Schaeybroeck (RMI) also shared his expertise in regional climate modeling.
From GPS measurements to water vapor
Water vapor is an important greenhouse gas and, in the context of a warming climate, it is therefore very important that it is observed in detail over as many places on Earth as possible. In Abdisa's doctoral thesis, GPS observations, among others, are used to measure the amount of water vapor in the atmosphere. Indeed, the GPS signal from the satellite is delayed (and refracted) on its way to the receiver on the ground by e.g. the water vapor in the atmosphere. These "errors" on the GPS signal must be corrected for precise position determination, but hence provide a measure of the total amount of water vapor in the atmosphere. In his doctoral thesis, Abdisa first compared these GPS water vapor measurements in Ethiopia with recalculations using a numerical weather prediction model (a so-called reanalysis). Then the variation, both in space and time, of the total amount of water vapor in the atmosphere over Ethiopia was studied. Depending on the location, a clear, identical, seasonal variation in the amount of water vapor was observed in both data sets, with a noticeable agreement with the seasonal cycle of precipitation observations at those locations.
The second part of the PhD compared atmospheric water vapor from available regional climate models over Ethiopia with GPS measurements and reanalysis output. The climate models are able to represent well the spatial patterns of water vapor in the mountainous region, but also the increase of water vapor during heavy precipitation events. In a next step, the regional climate models were used to look at future projections of the amounts of water vapor in Ethiopia under a warming climate. As there is a clear link between temperature, total water vapor and precipitation, the relationship between extreme precipitation and the total amount of water vapor available in the atmosphere was also studied, as well as the link between expected temperature and water vapor increases. For example, it was found that the amount of water vapor over Ethiopia increases by 7 percentage per degree of warming, see Figure below.
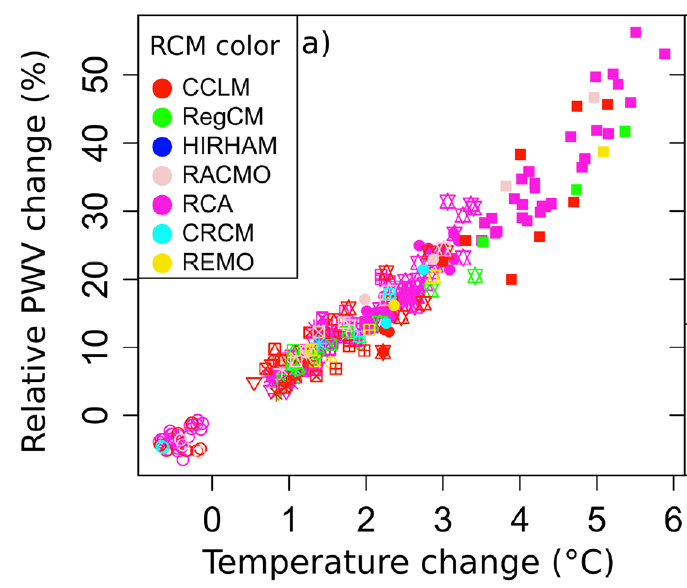
Relationship between the relative change in total water vapor (vertical axis, in percentage) and temperature change (horizontal axis, in Celsius degree) for different regional climate models (different colors) and different future scenarios (different symbols). From the slope of linear regression line through these different points, it can be derived that the amount of water vapor increases about 7 percent for every 1 degree increase in temperature over Ethiopia.
STCE would like to warmly congratulate Abdisa on obtaining his PhD and wishes him success in his future career!
Further reading
The PhD thesis is largely based on the following two peer-reviewed publications:
* Koji, A. K.; Van Malderen, R.; Pottiaux, E.; Van Schaeybroeck, B. Understanding the Present-Day Spatiotemporal Variability of Precipitable Water Vapor over Ethiopia: A Comparative Study between ERA5 and GPS. Remote Sens. 2022, 14, 686: https://doi.org/10.3390/rs14030686
* Kawo, A., Van Schaeybroeck, B., Van Malderen, R., and Pottiaux, E. Precipitable water vapor in regional climate models over Ethiopia: model evaluation and climate projections. Clim Dyn (2023): https://doi.org/10.1007/s00382-023-06855-y
PROBA2 Observations (27 May 2024 - 2 Jun 2024)
Solar Activity
Solar flare activity fluctuated from low to very high during the week.
In order to view the activity of this week in more detail, we suggest to go to the following website from which all the daily (normal and difference) movies can be accessed: https://proba2.oma.be/ssa
This page also lists the recorded flaring events.
A weekly overview movie (SWAP week 740) can be found here: https://proba2.sidc.be/swap/data/mpg/movies/weekly_movies/weekly_movie_2024_05_27.mp4.
Details about some of this week's events can be found further below.
If any of the linked movies are unavailable they can be found in the P2SC movie repository here: https://proba2.oma.be/swap/data/mpg/movies/.
Monday May 27
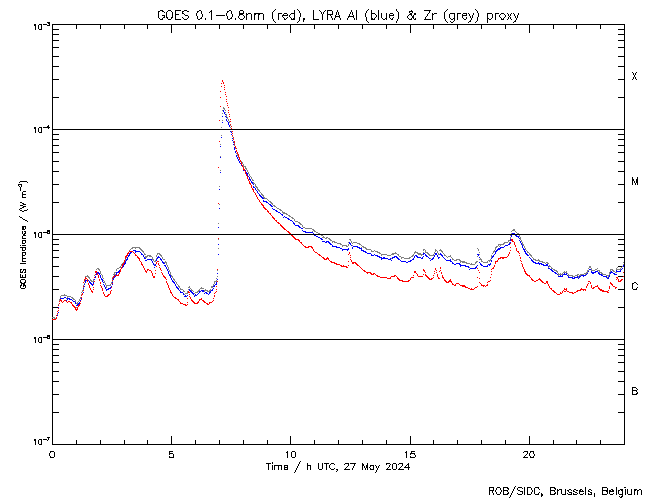
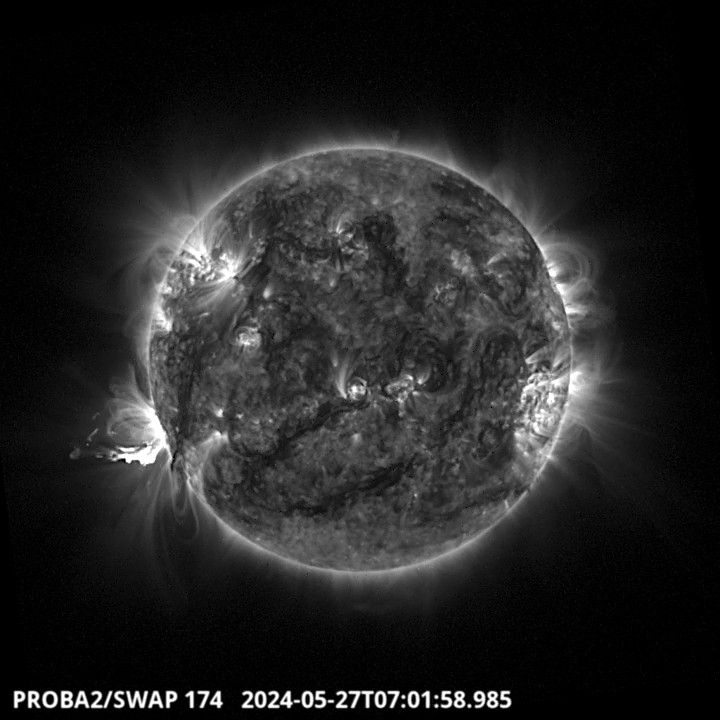
The largest flare of this week was an X2.8, and it was observed by LYRA (top panel) and SWAP (bottom panel, the associated eruption). The flare peaked on 2024-May-27 at 07:08 UT. It occurred close to the equator at the eastern limb, and it originated from NOAA AR3697. This active region was initially AR3664, the source region of the CMEs which impacted Earth on May 12, producing auroras visible even in Belgium. This region completed a solar rotation and reappeared on the eastern limb of the Sun, as AR3697, and was the origin of all five X-flares of this week.
Find a SWAP movie of the event here: https://proba2.sidc.be/swap/movies/20240527_swap_movie.mp4.
Review of space weather
Solar Active Regions (ARs) and flares
Solar flaring activity was moderate to high for most of the week. There was a total of 15 numbered active regions observed on the visible solar disk. NOAA AR 3697 (Catania region 28) was the most complex region (magnetic field configuration beta-gamma-delta) and dominated the flaring activity, producing multiple M-class and five X-class flares. The largest of which was an X2.8 flare with peak time 07:08 UTC on May 27. This flare originated beyond the south-east limb before the region was visible on disk. After the region rotated onto the disk it continued to produce X-class flares, although these were all around the X1 level. NOAA AR 3691 also produced M-class flaring activity but began to decay in the second half of the week.
The remaining regions on disk were simple and produced C-class flares or were quiet.
Coronal mass ejections
Multiple Halo Coronal Mass Ejections were observed during the week. Of these, two CMEs were analysed to have a possible Earth directed component. The first was a partial halo CME that was observed in the LASCO-C2 chronograph imagery at 14:48 UTC May 29. The CME was related to an X1.4 flare with peak time 14:37 UTC May 29, from NOAA AR 3397. A glancing blow was predicted to arrive at Earth on June 1 but was not observed. Secondly, a CME directed to the south-east, seen from 20:00 UTC June 01 in LASCO-C2 data, likely associated with the M7.3 flare with peak time 19:39 UTC June 01, was predicted to have an Earth directed component with a possible arrival on June 04.
Coronal Holes
A small positive polarity coronal hole in the northern hemisphere began to transit the central meridian on May 29.
Proton flux levels
The greater than 10 MeV GOES proton flux was below the 10pfu threshold for the entire week.
Electron fluxes at GEO
The greater than 2 MeV electron flux remained below the 1000 pfu threshold. The 24h electron fluence was at nominal levels.
Solar wind
The solar wind was slow for most of the week with its speed decreasing from values around 420 km/s at the start of the week to around 310 km/s by the end. The magnetic field was stable around 5nT for most of the week, with a weak magnetic structure visible on May 30 and 31 where the magnetic field strength increased to values around 10 nT with sustained periods of negative Bz and a minimum value of Bz of -8nT.
Geomagnetism
Geomagnetic conditions were mostly quiet to unsettled, with an isolated minor geomagnetic storms globally and active geomagnetic conditions locally (NOAA Kp 5- and Local K Bel 4) on May 31 in response to the extended period of negative Bz.
International Sunspot Number by SILSO
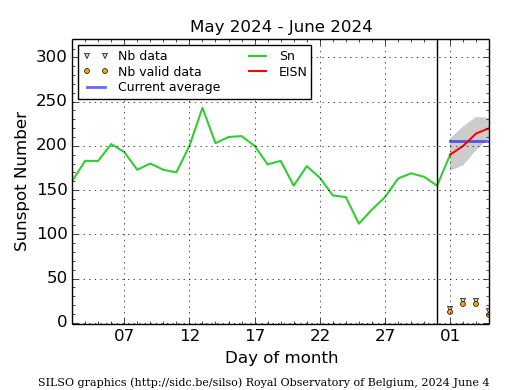
The daily Estimated International Sunspot Number (EISN, red curve with shaded error) derived by a simplified method from real-time data from the worldwide SILSO network. It extends the official Sunspot Number from the full processing of the preceding month (green line), a few days more than one solar rotation. The horizontal blue line shows the current monthly average. The yellow dots give the number of stations that provided valid data. Valid data are used to calculate the EISN. The triangle gives the number of stations providing data. When a triangle and a yellow dot coincide, it means that all the data is used to calculate the EISN of that day.
Noticeable Solar Events
| DAY | BEGIN | MAX | END | LOC | XRAY | OP | 10CM | TYPE | Cat | NOAA |
| 27 | 0649 | 0708 | 0725 | X2.8 | III/2II/3IV/1 | 3697 | ||||
| 29 | 0057 | 0106 | 0112 | S18E71 | M1.3 | SF | 28 | 3697 | ||
| 29 | 0633 | 0645 | 0658 | S20E68 | M1.4 | SF | 28 | 3697 | ||
| 29 | 1109 | 1121 | 1126 | N26E30 | M1.8 | 2N | 27 | 3695 | ||
| 29 | 1245 | 1255 | 1306 | S21E71 | M2.5 | 1N | 28 | 3697 | ||
| 29 | 1411 | 1437 | 1538 | S21E66 | X1.4 | 2B | II/2CTM/2III/2IV/1 | 28 | 3697 | |
| 29 | 1815 | 1828 | 1832 | N28E12 | M2.7 | 2B | VI/1 | 22 | 3691 | |
| 29 | 1832 | 1841 | 1845 | N28E12 | M5.7 | 2B | 22 | 3691 | ||
| 30 | 0649 | 0713 | 0746 | N28E7 | M1.0 | 1F | 22 | 3691 | ||
| 31 | 1106 | 1120 | 1130 | S21E57 | M1.0 | 1N | 28 | 3697 | ||
| 31 | 2152 | 2203 | 2209 | S17E32 | X1.1 | 2B | III/1 | 28 | 3697 | |
| 01 | 0826 | 0848 | 0858 | X1.4 | 28 | 3697 | ||||
| 01 | 1824 | 1836 | 1849 | S17E24 | X1.0 | 2B | CTM/1 | 28 | 3697 | |
| 01 | 1903 | 1939 | 2028 | M7.3 | II/2 | 28 | 3697 | |||
| 02 | 0441 | 0450 | 0505 | M1.2 | 28 | 3697 | ||||
| 02 | 0840 | 0850 | 0856 | S19E14 | M2.0 | SF | 28 | 3697 |
| LOC: approximate heliographic location | TYPE: radio burst type |
| XRAY: X-ray flare class | Cat: Catania sunspot group number |
| OP: optical flare class | NOAA: NOAA active region number |
| 10CM: peak 10 cm radio flux |
Geomagnetic Observations in Belgium
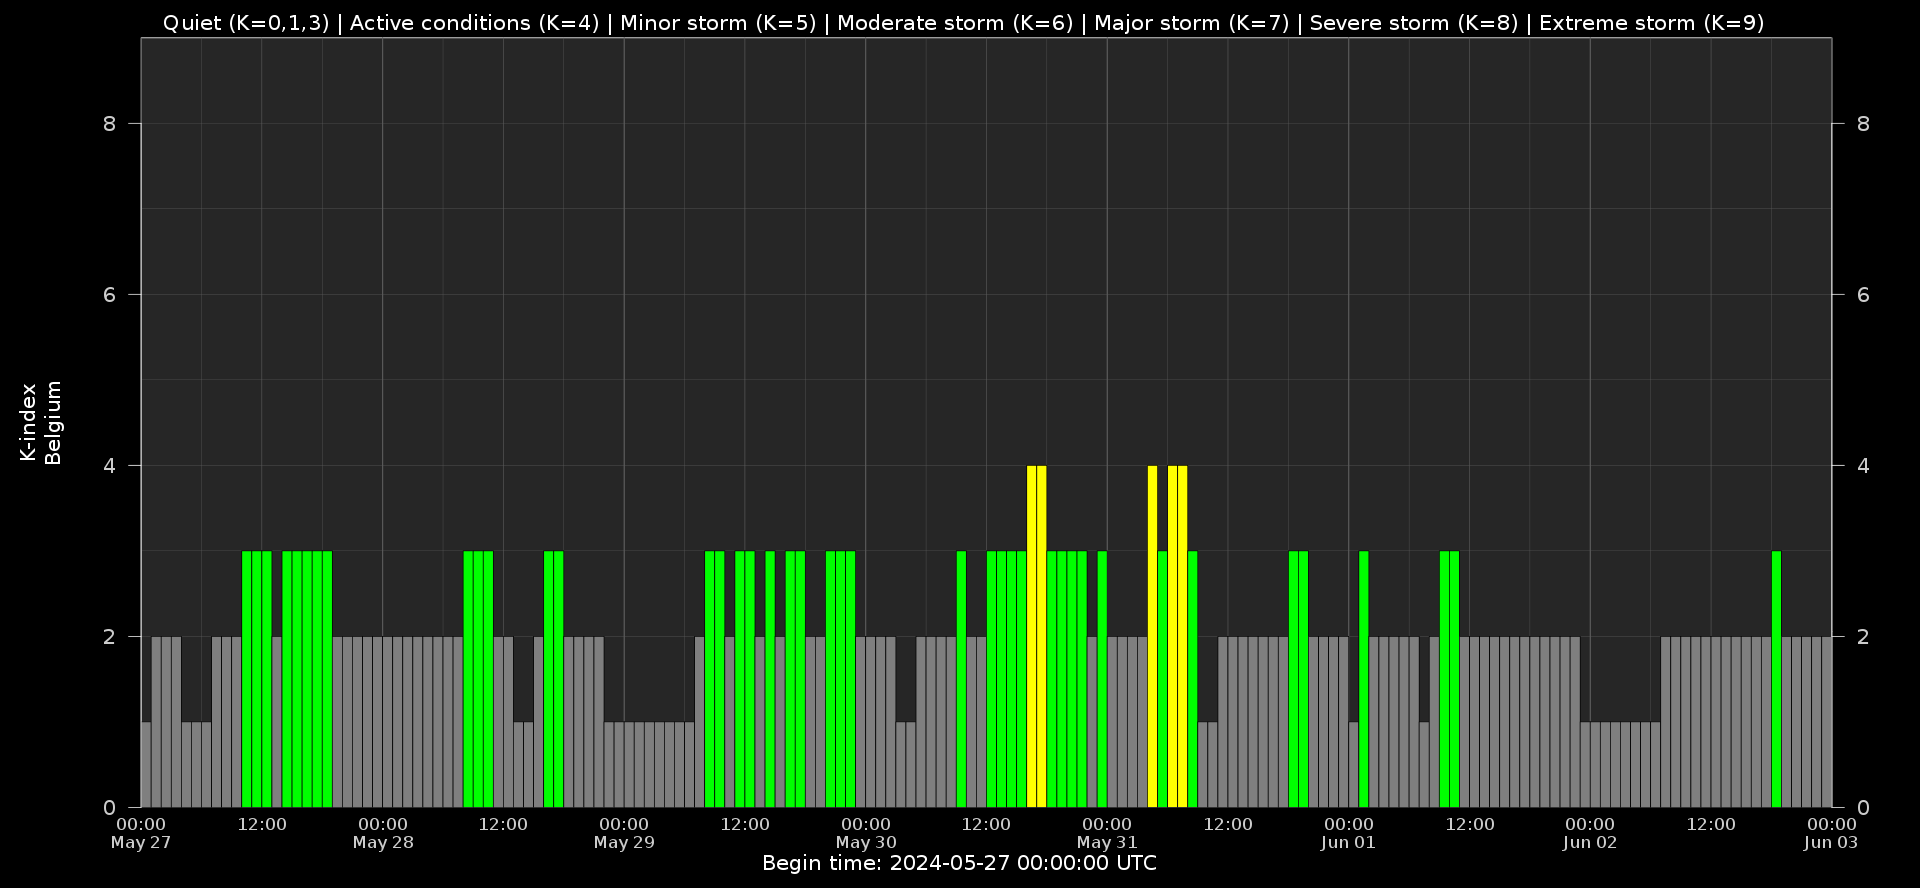
Local K-type magnetic activity index for Belgium based on data from Dourbes (DOU) and Manhay (MAB). Comparing the data from both measurement stations allows to reliably remove outliers from the magnetic data. At the same time the operational service availability is improved: whenever data from one observatory is not available, the single-station index obtained from the other can be used as a fallback system.
Both the two-station index and the single station indices are available here: http://ionosphere.meteo.be/geomagnetism/K_BEL/
The SIDC Space Weather Briefing
The forecaster on duty presented the SIDC briefing that gives an overview of space weather from May 27 to June 2.
The pdf of the presentation can be found here: https://www.stce.be/briefings/20240603_SWbriefing.pdf
Courses, presentations and activities
Courses and presentations with the Sun-Space-Earth system and Space Weather as the main theme. We provide occasions to get submerged in our world through educational, informative and instructive activities.
* June 9, Public presentation Total Eclipse of the Sun, Helios, Averbode, Belgium
* June 13, STCE seminar, Solar Prominence Eruptions: Insights from UV Imaging with EUI/FSI
* June 25, Solar physics and Space Weather: predictions and services, online course - Registrations are open
* June 27, STCE annual meeting, Brussels, Belgium
* June 28, public presentation Help! Het stormt in de ruimte!?, Wetenschappelijke middagen, Brussels, Belgium
* July 7, public presentation Totale zonsverduistering op vraag, Proba-3, de eclips-satelliet , Zonnekijkdagen, Genk, Belgium
* Sep 27 and 28, STCE at the Wisenight Science festival in the Planetarium, Brussel, https://wisenight.eu/
* Sep 30 - Oct 3, STCE Space Weather Introductory Course, Brussels, Belgium - Registrations are open https://events.spacepole.be/event/204/
* Nov 25 - 27, STCE course: Space Weather impacts on ionospheric wave propagation, focus on GNSS and HF, Brussels, Belgium - Registrations are open, https://events.spacepole.be/event/206/
* Dec 5-6, STCE Course Space Weather impacts on aviation, Brussels, Belgium - Registrations are open, https://events.spacepole.be/event/205/
To register for a course or lecture, check the page of the STCE Space Weather Education Center: https://www.stce.be/SWEC
If you want your event in the STCE newsletter, contact us: stce_coordination at stce.be