- Table of Content
- 1.Hpo
- 2.Proba-3 at Hel...
- 3.PROBA2 Observa...
- 4.Review of spac...
- 5.International ...
- 6.Noticeable Sol...
- 7.Geomagnetic Ob...
- 8.The SIDC Space...
- 9.Review of Iono...
- 10.STCE Seminars,...
2. Proba-3 at Helios
3. PROBA2 Observations (10 Jun 2024 - 16 Jun 2024)
4. Review of space weather
5. International Sunspot Number by SILSO
6. Noticeable Solar Events
7. Geomagnetic Observations in Belgium
8. The SIDC Space Weather Briefing
9. Review of Ionospheric Activity
10. STCE Seminars, Lectures and Courses
Hpo
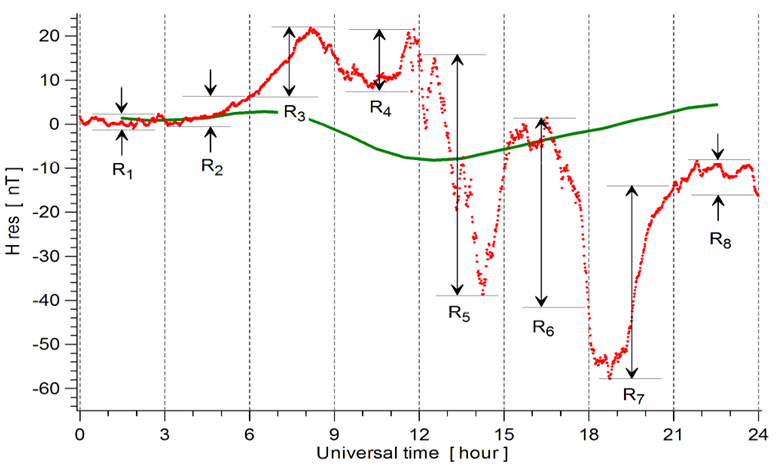
The Kp index (https://www.stce.be/educational/classification#geomag ) is one of the most popular parameters to measure planetary geomagnetic activity. It is derived from local K indices evaluated at 13 subauroral observatories from both northern and southern hemispheres (ISGI map - https://isgi.unistra.fr/indices_kp.php ). Each K index is derived for a specific observatory from the maximum fluctuations of the horizontal components observed on a magnetogram during a 3-hour interval, evaluated as the difference between the maximum positive and negative deviations (range "R") with respect to a reference curve, which essentially reflects the local diurnal variation at the observatory (see the illustration underneath - Stankov et al. 2010 - http://ionosphere.meteo.be/sites/ionosphere.meteo.be/files/documentation/publications/Team-Reports/STR-RMI-2010-01_K-LOGIC.pdf ). The local K index expresses geomagnetic activity on a scale of 0-9 at each observatory for a given 3-hourly interval of the UT day (00-03, 03-06, ... , 21-24 UT). K is designed to have a similar frequency distribution regardless of the observatory, and thus it does not depend on latitude (see e.g. Regi et al. 2020 https://gi.copernicus.org/articles/9/105/2020/ for an example). K indices are converted to standardized Ks indices, which take into account the influence of seasonal and UT biases. Kp is the average of the 13 Ks indices expressed in thirds (0o, 0+, 1-, 1o, 1+, 2-, ... , 9o), thus it represents planetary, rather than local, geomagnetic activity. The complete time series of the definitive Kp index exists since 1932 and is available from the Kp website at the Deutsches GeoForschungsZentrum GFZ Potsdam (https://kp.gfz-potsdam.de/en/ ). Kp is a historical parameter that is widely used in the space physics community, as it is known to be a good proxy of the solar wind energy input into the magnetosphere-ionosphere-thermosphere system.
Nonetheless, as with any parameter, the Kp index has also its drawbacks. First of all, Kp cannot resolve temporal features within 3 hours. The onset of a geomagnetic disturbance determined by Kp could be off from the actual onset by up to 3 hr. This could be an issue if Kp is used in a geospace model, because the state of the magnetosphere, ionosphere and thermosphere can change significantly within the 3-hour interval. Also, such a time interval is much larger than the characteristic times of many localized ionospheric phenomena that are of particular interest to many users. A workaround is to provide more regular updates of the K index, as is done with the K Belgium index http://ionosphere.meteo.be/geomagnetism/K_BEL/ which provides K values every hour, based on the disturbances observed during the previous 3 hours (Verhulst et al. 2021 - https://agupubs.onlinelibrary.wiley.com/doi/10.1029/2020SW002709 ). The second major limitation of Kp is its upper limit at 9o. Kp is not able to quantify geomagnetic activity once it reaches 9o. Extreme geomagnetic storms involving Kp = 9o are not necessarily equally strong in terms of geomagnetic disturbance. Here, one of the workarounds is to look at other, open-ended geomagnetic parameters such as the Disturbance storm-time index (Dst - https://www.stce.be/educational/classification#geomag ), keeping in mind of course that these are different geomagnetic parameters representing different aspects of the disturbed geomagnetic field.
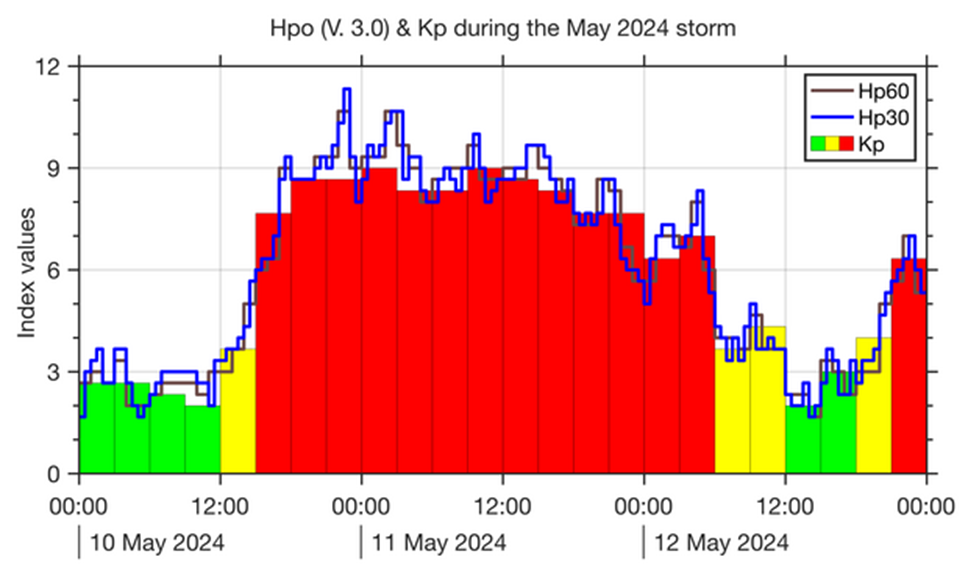
Enter Hpo, not to be confused with the chemical formula for water H2O, the pay television network HBO, or the Star Wars droid C-3PO. Hpo is a group of Kp-like indices, where "H" stands for half-hourly or hourly, "p" for planetary, and "o" for open-ended. Developed by researchers at GFZ under the EU Horizon 2020 project, this fairly recent geomagnetic index is designed to represent planetary geomagnetic activity in a similar manner as Kp but with a higher time resolution and without an upper limit, to overcome the aforementioned limitations of Kp. It comes in 2 varieties depending the time interval it is based on: Hp30 concerns a 30 minutes time interval, and Hp60 a 60 minutes time interval. Hpo uses the same 1-min data from the same 13 subauroral observatories as the Kp, and has a similar but not identical philosophy in deriving the Hp30 and Hp60 values (for details, see Yamazaki et al. 2022 - https://agupubs.onlinelibrary.wiley.com/doi/epdf/10.1029/2022GL098860 ). Just as Kp, they are also expressed in thirds, but continue after 9o, e.g. 9+, 10-, 10o, 10+,... with no limit at all. The data are already available on the dedicated GFZ Potsdam website (https://www.gfz-potsdam.de/en/hpo-index ; near-real time at https://kp.gfz-potsdam.de/en/hp30-hp60 ), and have just recently been extended back to 1985 (version V3.0: Yamazaki et al. 2024 (preprint) - https://doi.org/10.22541/essoar.171838396.68563140/v1 ). The Hp30 and Hp60 values have been calculated for the recent 10-12 May geomagnetic storm and arrive at respective maximum values of 11+ and 11- This is shown in the above plot, which also includes the Kp index for comparison purposes. This brings the May 2024 storm into the Top 5 of strongest geomagnetic storms of the last 40 years, with the 13-14 March 1989 storm of course taking the top spot with a maximum for Hp30 and Hp60 of respectively 13+ and 13-.
It is now waiting for the results of the calculation of the Hpo indices for great historical storms such as in September 1859, May 1921 or March 1946. Indeed, as written in the Yamazaki et al. (2024) preprint, though the minimum Dst value is known for these storms, it may not accurately predict the magnitude of geomagnetic activity as measured by Hpo which aligns more closely with Kp as well as with the solar wind coupling functions. Thus, though estimating Hpo for historical storms might not be a simple task, the obtained values could sketch a more complete picture of what happened in geospace during these important, individual events.
Proba-3 at Helios
Helios, a section of VVS (Vereniging voor Sterrenkunde) in Averbode, Belgium invited the STCE to talk about Proba-3, the eclipse maker on demand.
The setting, the abbey of Averbode was great but above all, the group was super-enthusiastic. 3 hours were easily filled.
.jpg)
PROBA2 Observations (10 Jun 2024 - 16 Jun 2024)
Solar Activity
Solar flare activity fluctuated from low to high during the week.
In order to view the activity of this week in more detail, we suggest to go to the following website from which all the daily (normal and difference) movies can be accessed: https://proba2.oma.be/ssa
This page also lists the recorded flaring events.
A weekly overview movie can be found here (SWAP week 742). https://proba2.sidc.be/swap/data/mpg/movies/weekly_movies/weekly_movie_2024_06_10.mp4
Details about some of this week’s events can be found further below.
If any of the linked movies are unavailable they can be found in the P2SC movie repository here
Monday June 10
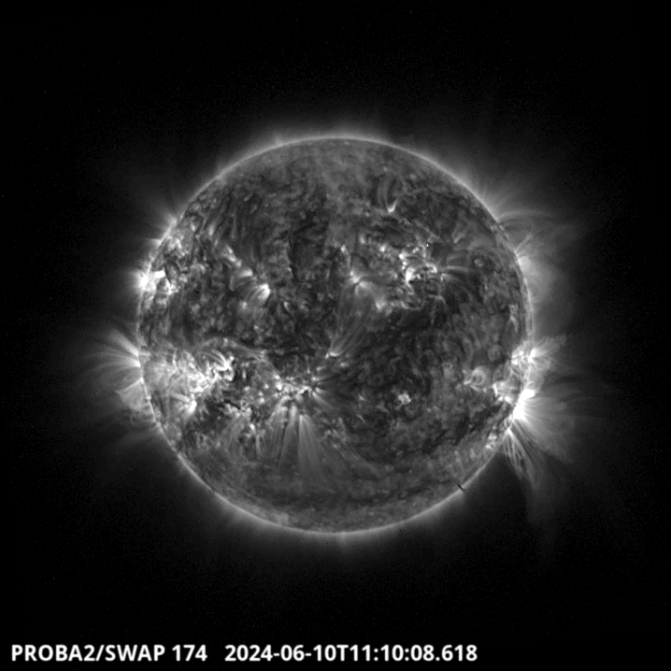
The biggest flare of the week is a X1.5 which has been produced around 11:08 by the NOAA active
region 3697 located on the South West limb of the solar disk.
Find a SWAP movie of the event here. https://proba2.sidc.be/swap/movies/20240610_swap_movie.mp4
Thursday Jun 14
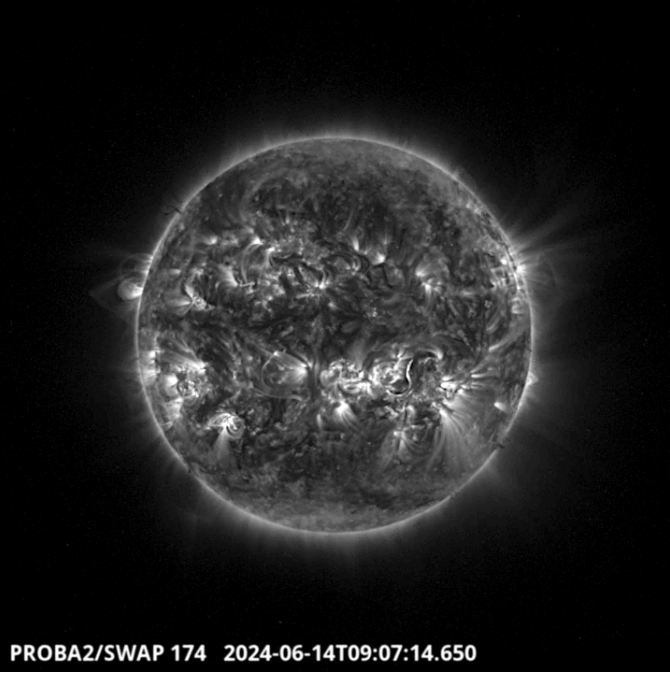
A S-shaped structure erupted around 9:07 UT in the South-West part of the solar disk.
Find a SWAP movie of the event here. https://proba2.sidc.be/swap/movies/20240614_swap_movie.mp4
Review of space weather
Solar Active Regions (ARs) and flares
Solar flaring activity was high on June 10, when an X1.5 flare from NOAA AR 3697 was recorded. For the rest of the week, the solar flaring activity was moderate, with few M-class flares and multiple C-class flares. The most complex active regions were NOAA AR 3697 and NOAA AR 3712. NOAA AR 3697 (beta-gamma-delta) rotated beyond the west limb early this week, but still exhibited flaring activity. NOAA AR 3712 evolved to beta-gamma-delta on June 15 and produced C- and M-class flares.
Coronal mass ejections
Multiple Coronal Mass Ejections (CMEs) were recorded.
Two partial halo CMEs, associated with flaring activity from NOAA 3697 were observed in SOHO/LASCO-C2 around 11:00 UTC and around 18:36 UTC on June 10 respectively. The source region was behind the west limb and no impact on Earth was recorded for both cases.
A partial halo CME was observed in SOHO/LASCO-C around 23:36 UTC on June 10 , associated with a prominence eruption in the south-west quadrant. No impact on Earth was recorded.
An asymmetric halo CME was first detected in SOHO/LASCO-C2 around 22:43 on June 11. A Type II radio burst reported at 22:51 UTC on June 11, was most likely associated with this CME. No impact on Earth was recorded.
A faint partial halo CME was first detected around 23:32 UTC on June 12 in SOHO/LASCO-C2. It was most probably associated with the M1.2 flare from NOAA AR 3711. The shock from the ICME arrival at Earth was recorded around 11:05 UTC on June 15.
Another CME was observed in SOHO/LASCO-C2 data around 12:11 UTC on June 15. It was most likely associated with a filament eruption observed in SDO/AIA 304 data around 11:20 UTC on June 15, in the south-east quadrant.
Coronal Holes
Three coronal holes have crossed the central meridian. The first was an east-west elongated, negative polarity coronal hole in the south hemisphere that fully crossed the central meridian on June 11. The second was a small, negative polarity coronal hole in the southern hemisphere that crossed the central meridian on June 10. The third was a positive polarity coronal hole that crossed the central meridian on June 13.
Proton flux levels
The greater than 10 MeV GOES proton flux was above the 10 pfu threshold until June 09. It remained close to the threshold between 03:00 UTC on June 12 and 12:00 UTC on June 13, when it started to decrease again. It returned to background levels late on June 15.
Electron fluxes at GEO
Over the past week, the greater than 2 MeV electron flux as measured by GOES 16 and GOES 18 remained below the 1000 pfu threshold. The 24-hour electron fluence was at nominal levels throughout the week.
Solar wind
Two shocks were detected in the solar wind data.
The first one, associated with the CME observed on June 08, was detected around 16:50 UTC on June 10. The interplanetary magnetic field jumped from 6 nT to 15 nT, the solar wind speed jumped from 345 km/s to 440 km/s and increased up to 480 km/s. The solar wind density at the shock increased from 4 ppcc to 15 ppcc.
The second shock, associated with the CME recorded on June 12, was detected around 11:05 on June 15. The interplanetary magnetic field jumped from 6 nT to 14 nT, the solar wind speed jumped from 360 km/s to 437 km/s and increased up to 460 km/s. The solar wind density at the shock increased from 3.8 ppcc to 9.9 ppcc.
Geomagnetism
Geomagnetic conditions reached globally and locally active levels (NOAA Kp from 0 to 4+ and K Bel from 0 to 4) in response to the ICME arrival on June 10. Geomagnetic conditions reached globally minor storm levels (NOAA Kp 5+) and locally active levels (K BEL 4) in response to the ICME arrival on June 15.
International Sunspot Number by SILSO

The daily Estimated International Sunspot Number (EISN, red curve with shaded error) derived by a simplified method from real-time data from the worldwide SILSO network. It extends the official Sunspot Number from the full processing of the preceding month (green line), a few days more than one solar rotation. The horizontal blue line shows the current monthly average. The yellow dots give the number of stations that provided valid data. Valid data are used to calculate the EISN. The triangle gives the number of stations providing data. When a triangle and a yellow dot coincide, it means that all the data is used to calculate the EISN of that day.
Noticeable Solar Events
| DAY | BEGIN | MAX | END | LOC | XRAY | OP | 10CM | TYPE | Cat | NOAA |
| 10 | 0558 | 0609 | 0616 | M3.3 | 28 | 3697 | ||||
| 10 | 1018 | 1058 | 1103 | M5.3 | F | II/2I/2 | 28 | 3697 | ||
| 10 | 1320 | 1329 | 1335 | M1.3 | F | 28 | 3697 | |||
| 10 | 1811 | 1840 | 1918 | M9.5 | II/1I/1I/1 7 | 28 | 3697 | |||
| 10 | 0938 | 1006 | 1018 | M2.2 | 28 | 3697 | ||||
| 12 | 2224 | 2246 | 2335 | M1.2 | N | 49 | 3711 | |||
| 13 | 1634 | 1645 | 1655 | S16E59 | M3.2 | 1N | 3713 | |||
| 14 | 0414 | 0432 | 0443 | M2.4 | 51 | 3712 | ||||
| 15 | 0600 | 0627 | 0643 | M1.3 | 51 | 3712 |
| LOC: approximate heliographic location | TYPE: radio burst type |
| XRAY: X-ray flare class | Cat: Catania sunspot group number |
| OP: optical flare class | NOAA: NOAA active region number |
| 10CM: peak 10 cm radio flux |
Geomagnetic Observations in Belgium

Local K-type magnetic activity index for Belgium based on data from Dourbes (DOU) and Manhay (MAB). Comparing the data from both measurement stations allows to reliably remove outliers from the magnetic data. At the same time the operational service availability is improved: whenever data from one observatory is not available, the single-station index obtained from the other can be used as a fallback system.
Both the two-station index and the single station indices are available here: http://ionosphere.meteo.be/geomagnetism/K_BEL/
The SIDC Space Weather Briefing
The forecaster on duty presented the SIDC briefing that gives an overview of space weather from June 9 to 16.
The pdf of the presentation: https://www.stce.be/briefings/20240617_SWbriefing.pdf
Review of Ionospheric Activity


VTEC time series at 3 locations in Europe from 10 Jun 2024 till 16 Jun 2024
The top figure shows the time evolution of the Vertical Total Electron Content (VTEC) (in red) during the last week at three locations:
a) in the northern part of Europe(N 61deg E 5deg)
b) above Brussels(N 50.5deg, E 4.5 deg)
c) in the southern part of Europe(N 36 deg, E 5deg)
This top figure also shows (in grey) the normal ionospheric behaviour expected based on the median VTEC from the 15 previous days.
The time series below shows the VTEC difference (in green) and relative difference (in blue) with respect to the median of the last 15 days in the North, Mid (above Brussels) and South of Europe. It thus illustrates the VTEC deviation from normal quiet behaviour.
The VTEC is expressed in TECu (with TECu=10^16 electrons per square meter) and is directly related to the signal propagation delay due to the ionosphere (in figure: delay on GPS L1 frequency).
The Sun's radiation ionizes the Earth's upper atmosphere, the ionosphere, located from about 60km to 1000km above the Earth's surface.The ionization process in the ionosphere produces ions and free electrons. These electrons perturb the propagation of the GNSS (Global Navigation Satellite System) signals by inducing a so-called ionospheric delay.
See http://stce.be/newsletter/GNSS_final.pdf for some more explanations; for more information, see https://gnss.be/SpaceWeather
STCE Seminars, Lectures and Courses
Courses and presentations with the Sun-Space-Earth system and Space Weather as the main theme. We provide occasions to get submerged in our world through educational, informative and instructive activities.
* June 25, Solar physics and Space Weather: predictions and services, online course - Registrations are open
* June 27, STCE annual meeting, Brussels, Belgium
* June 28, public presentation Help! Het stormt in de ruimte!?, Wetenschappelijke middagen, Brussels, Belgium
* July 7, public presentation Totale zonsverduistering op vraag, Proba-3, de eclips-satelliet , Zonnekijkdagen, Genk, Belgium
* Sep 27, STCE at the Wisenight Science festival in the Planetarium, Brussel, https://wisenight.eu/
* Sep 30 - Oct 3, STCE Space Weather Introductory Course, Brussels, Belgium - Registrations are open https://events.spacepole.be/event/204/
* Nov 25 - 27, STCE course: Space Weather impacts on ionospheric wave propagation, focus on GNSS and HF, Brussels, Belgium - Registrations are open, https://events.spacepole.be/event/206/
* Dec 5-6, STCE Course Space Weather impacts on aviation, Brussels, Belgium - Registrations are open, https://events.spacepole.be/event/205/
To register for a course or lecture, check the page of the STCE Space Weather Education Center: https://www.stce.be/SWEC
If you want your event in the STCE newsletter, contact us: stce_coordination at stce.be