- Table of Content
- 1.Impressive eru...
- 2.STCE Annual Me...
- 3.Seeing both si...
- 4.Topical Issue ...
- 5.International ...
- 6.PROBA2 Observa...
- 7.Noticeable Sol...
- 8.Geomagnetic Ob...
- 9.Review of Iono...
- 10.The SIDC Space...
- 11.Upcoming Activ...
2. STCE Annual Meeting
3. Seeing both sides of the Sun at once
4. Topical Issue "Severe SWx events of May 2024 and their impacts"
5. International Sunspot Number by SILSO
6. PROBA2 Observations
7. Noticeable Solar Events
8. Geomagnetic Observations in Belgium
9. Review of Ionospheric Activity
10. The SIDC Space Weather Briefing
11. Upcoming Activities
Impressive eruption
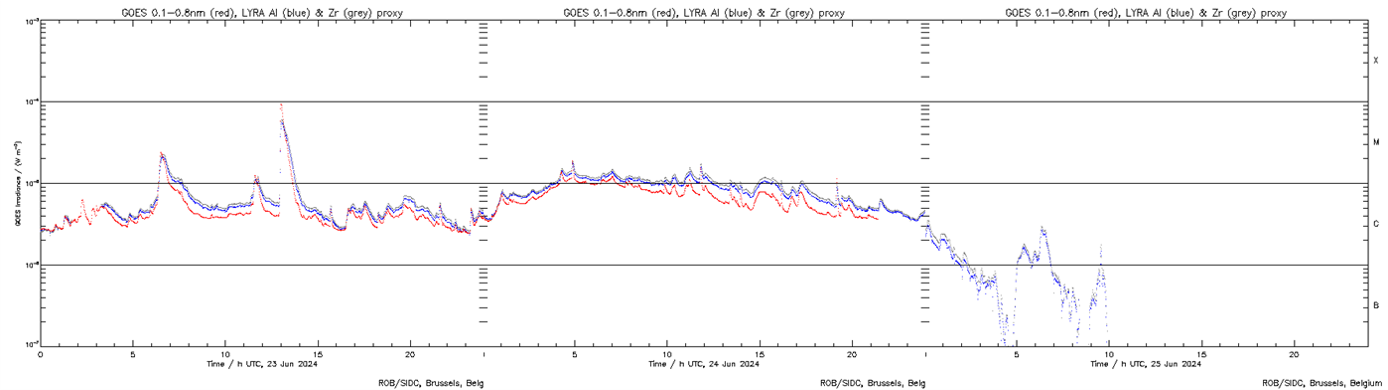
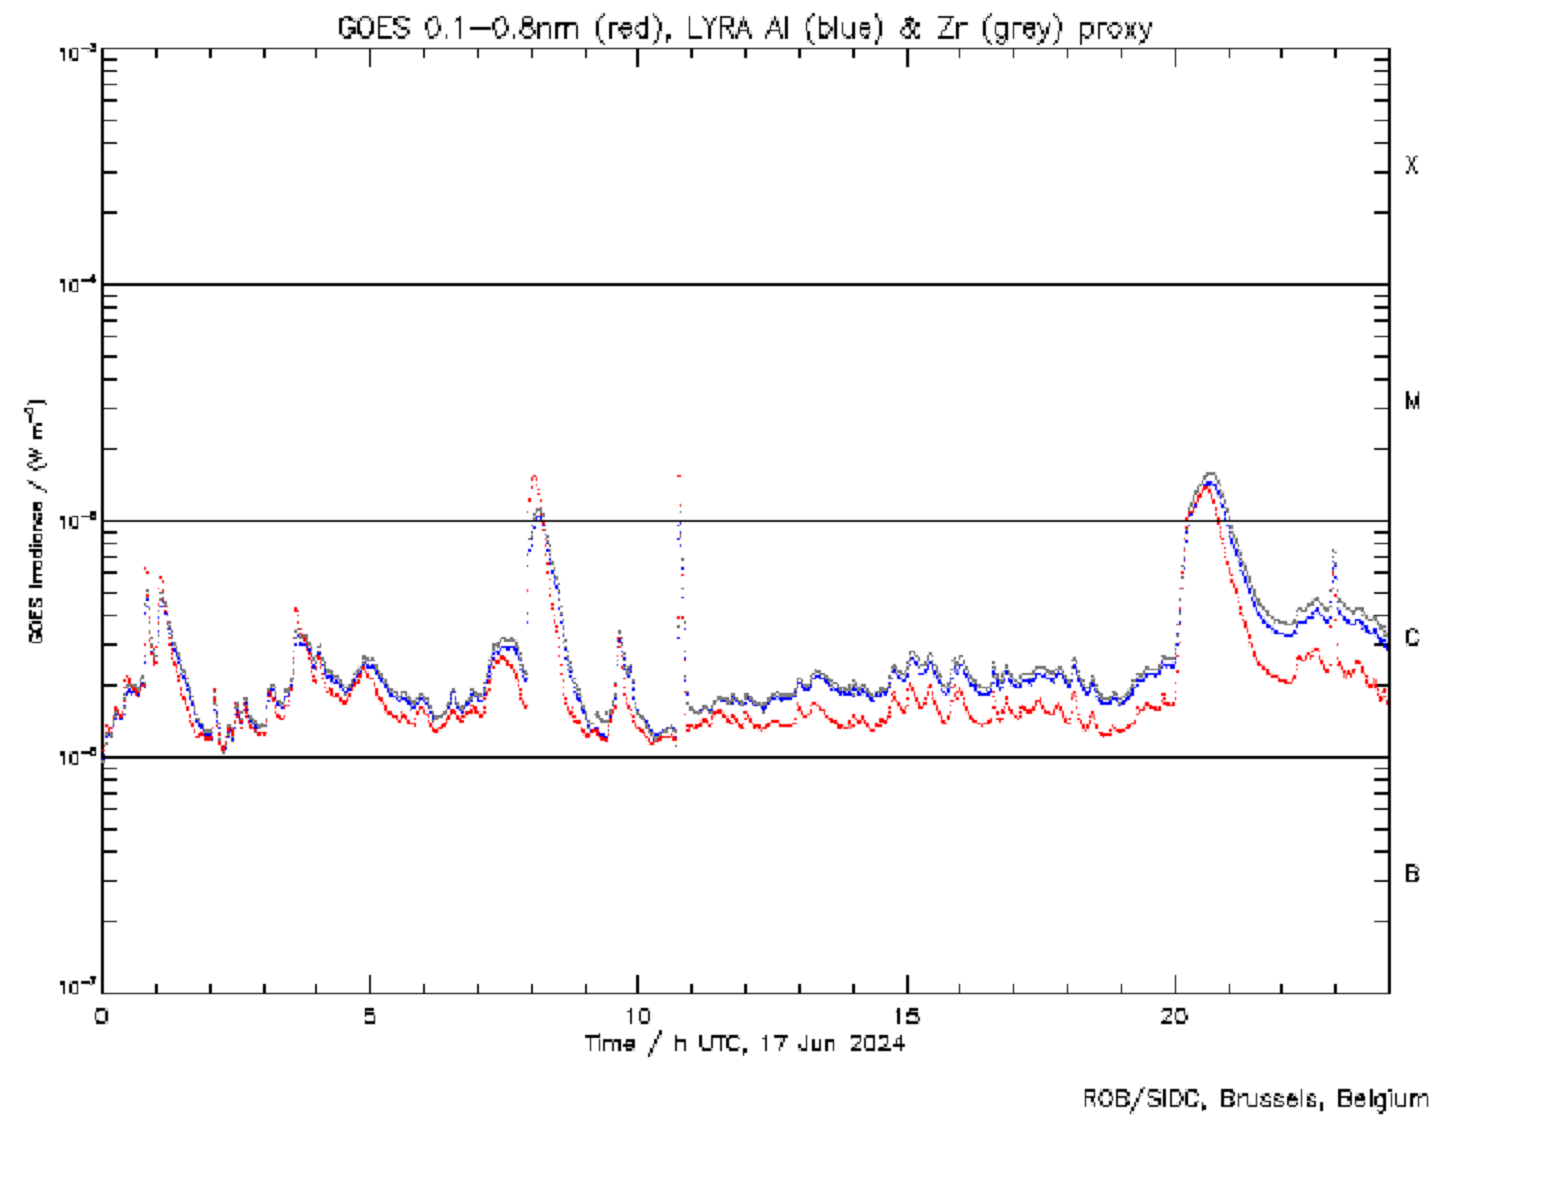
An impressive eruption took place over the Sun's southwest limb on 24 June. The source was NOAA 3712, but there were interactions with the other nearby big group NOAA 3713 as well. In soft x-ray (GOES - https://www.swpc.noaa.gov/products/goes-x-ray-flux ) and in UV (PROBA2/LYRA - https://proba2.sidc.be/ssa ), the eruption seems to have started late on 23 June, peaking around 05 UTC on 24 June around the M1 level, and lasting for the better part of that day (see the combined GOES and PROBA2 chart underneath). On itself, this flare was not registered by GOES as it evolved too slowly. The spikes on the overall evolution result from other, more short-lived eruptions in NOAA 3712 and 3713, NOAA 3716 (another big region close to the northwest limb) and the returning old sunspot group NOAA 3664 (near the southeast limb ; 3rd appearance). As the sunspot complex NOAA 3712/3713 rotated further onto the farside of the Sun, one can see also the soft x-ray and UV background flux quickly dropping early on 25 June.
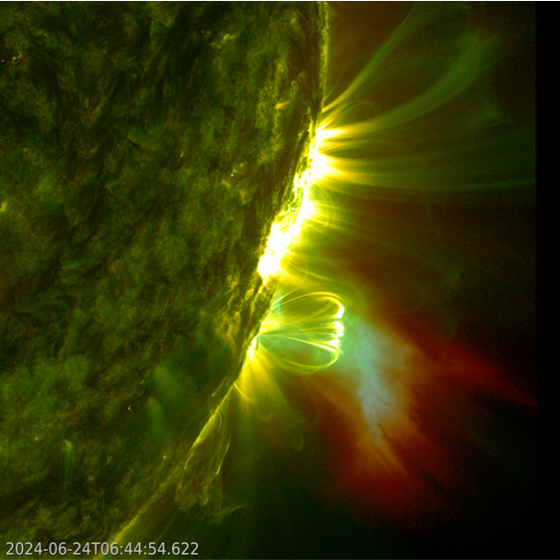
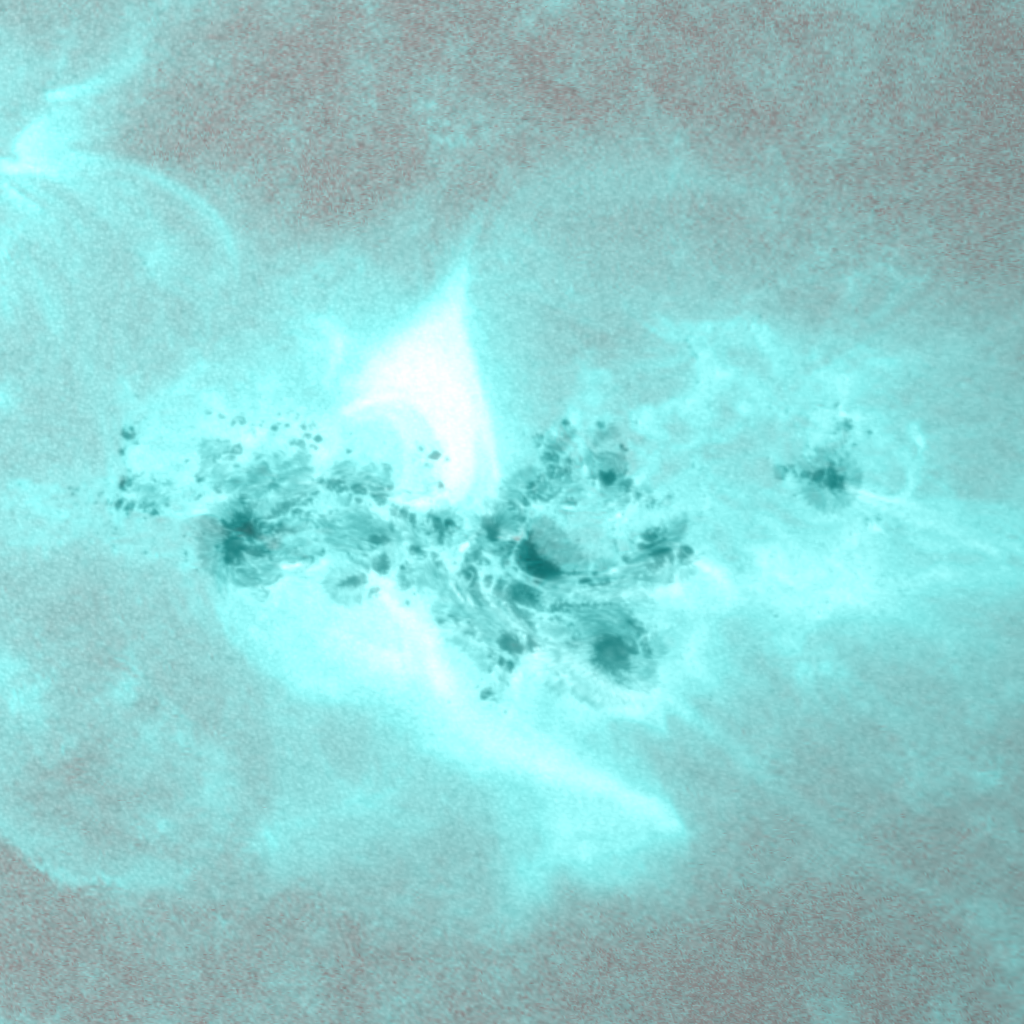
The imagery below shows the eruption in extreme ultraviolet (EUV), with SDO/AIA 171 (http://sdo.gsfc.nasa.gov/data/aiahmi/ ) showing temperatures around 700.000 degrees (yellowish green), and AIA 131 showing the much hotter parts of the eruption at multi-million degrees (orange-reddish colours). The image underneath shows the area around the time of flare maximum, when also the hottest portion (reddish) was the most extensive. The hottest parts of the flare suggest the presence of supra-arcade downflows (SAD). These features have been discussed in detail in this STCE newsitem (https://www.stce.be/news/630/welcome.html ), providing also many more examples of SADs. The post-eruption coronal loops that can be seen growing in height, eventually towered at least 182.000 km over the solar surface, that is half the Earth-Moon distance. They were still visible early on 25 June.
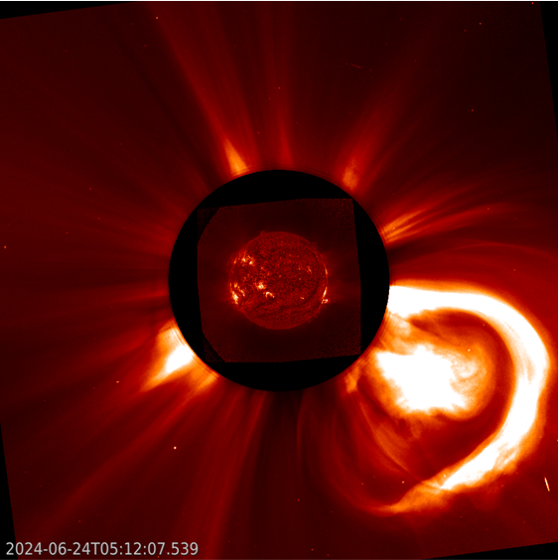
A partial halo coronal mass ejection (CME) was associated with this eruption, directed to the southwest. The SIDC forecaster (https://www.sidc.be/ ) has analyzed this CME, and came to the conclusion that it has no earth-directed component in view of the source location. The imagery underneath combines EUV imagery by SUVI 304 (GOES - https://www.swpc.noaa.gov/products/goes-solar-ultraviolet-imager-suvi ) with white light coronagraphic images by SOHO/LASCO C2 (http://sohowww.nascom.nasa.gov/data/realtime-images.html ).
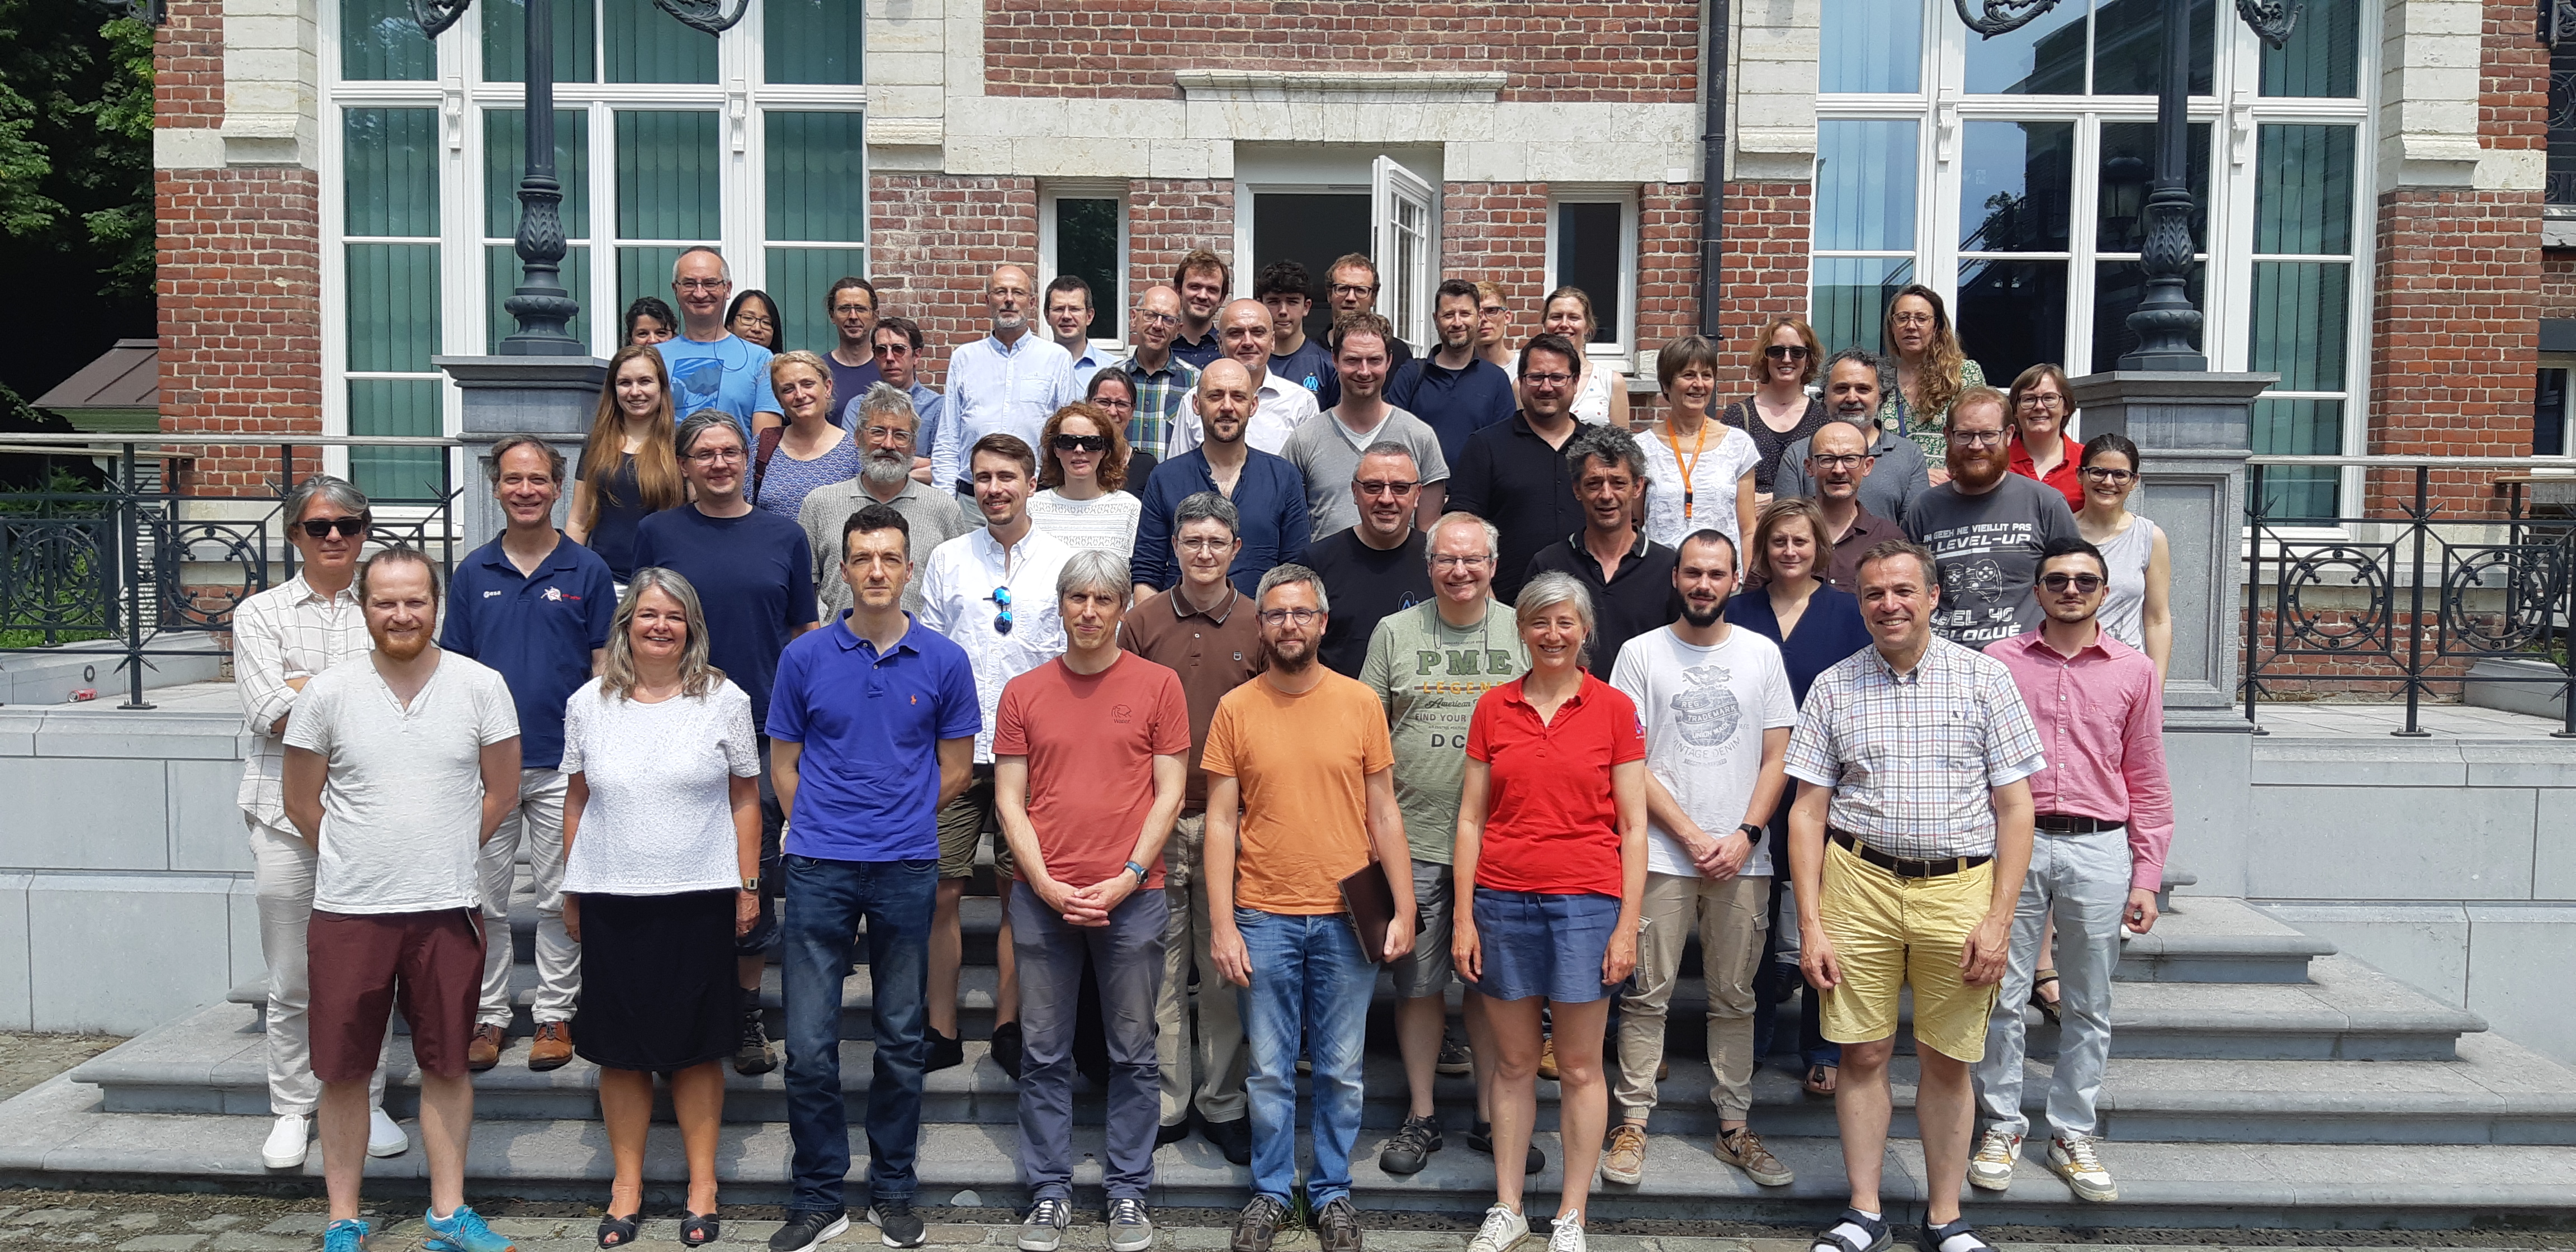
STCE Annual Meeting
This year's edition of the STCE Annual Meeting took place on June 27. We welcomed our friends at the Belgian Armed Forces as specials guests and discussed how we can collaborate even more closely.
The highlight on this annual meeting was the discussion on the Mother Day space weather storm that occurred in May. Different STCE teams showcased their observations taken both from space and on the ground. They also presented their first analysis of the impacts and highlighted how intense this high activity period was from a forecasting perspective.
This topic accentuated the strength of the STCE: our complementary observations, services and research topics culminated in a comprehensive overview of the May events. To be continued!
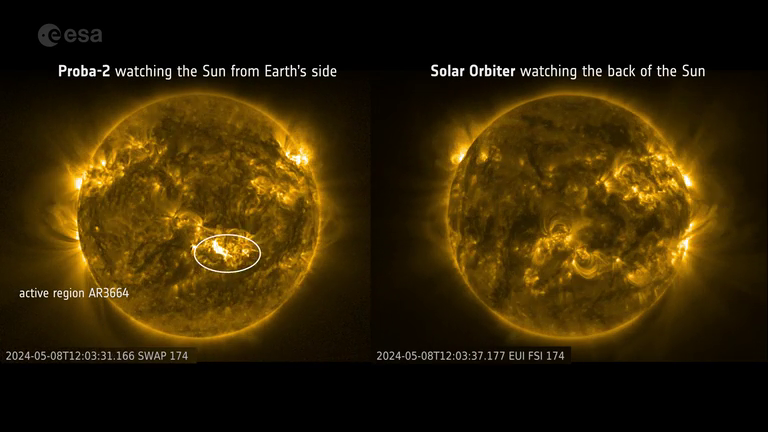
Seeing both sides of the Sun at once
The hyperactive sunspot region responsible for the beautiful auroras earlier in May was still alive and kicking when it rotated away from Earth’s view. In a stroke of good luck, Solar Orbiter happened to be in perfect position to observe this region as it continued firing on the back side of the Sun.
Video here: https://stce.be/newsletter/movies/2406_025_AR_EN.mp4
This video shows the Sun as seen from Earth orbit by the SWAP instrument onboard the Proba-2 mission on the left, and as seen from the opposite side of the Sun by the EUI telescope onboard Solar Orbiter on the right. By watching the side of the Sun facing away from Earth, Solar Orbiter has allowed us to track the monster active region AR3664 as it rotates in and out of Earth’s view.
AR3664 has been very active in May 2024, producing many powerful solar flares and sending out highly energetic particles and large amounts of material in coronal mass ejections. On 20 May Solar Orbiter saw it produce the largest solar flare of the current solar cycle (class X12).
More info here: https://www.esa.int/Science_Exploration/Space_Science/Solar_Orbiter/Can_t_stop_won_t_stop_Solar_Orbiter_shows_the_Sun_raging_on
Topical Issue "Severe SWx events of May 2024 and their impacts"
The Journal of Space Weather and Space Climate (JSWSC - https://www.swsc-journal.org/ ) opens a Topical Issue "Severe space weather events of May 2024 and their impacts", deadline 28 February 2025.
The space weather events of May 2024 were in many aspects the strongest of the last two decades, as indicated by comprehensive measurements and impacts recorded worldwide. This series of events was initiated by the solar active region NOAA 3664, which gave rise to numerous large flares, some having exceeded the X5 level, and associated moderately large fast coronal mass ejections (CMEs). Many of them were Earth-directed and several exceeded 1000 km/s launch speed.
Due to the rapid succession and varying launch speeds, several CMEs merged and interacted as they travelled through the interplanetary medium, leading to enhanced effects on the Earth's space environment. They gave rise to a geomagnetic storm commencing on 10 May which rose to the G5 level persisting through subsequent days with observable auroras at low magnetic latitudes (well below 50 degrees) in both hemispheres.
These space weather conditions resulted in strong radio blackouts, a moderate solar energetic particle event, including GLE 74 early on 11 May 2024, and radiation-belt enhancements throughout the following days.
Reports from around the globe suggest impacts on critical national infrastructures. Also, a degradation of GNSS systems' performance was clearly seen across several countries.
This topical issue welcomes submissions focusing on these events, across various domains which include, but are not limited to, observations, simulations/modeling, and impacts, that cover all aspects of these severe space weather events throughout the first half of May 2024.
Manuscripts must be submitted via the JSWSC online submission tool. Guidelines for submission of papers are found on the JSWSC website under the tab "Instruction for Authors" (https://www.swsc-journal.org/author-information/instructions-for-authors ).
Deadline: 28 February 2025
All manuscripts will be peer-reviewed according to the quality standards of international scientific journals. The type of contributions must fit the style of JSWSC. All manuscripts should contain enough new insight, present the results against a properly referenced background of existing work, and present adequate evidence that supports the conclusions. Accepted papers are published upon review and acceptance, without waiting for the other papers, and are freely available to everyone via the JSWSC website. JSWSC offers the possibility to include electronic material, such as animations, movies, codes and data.
Topical Editor-in-Chief (T-EiC):
- Jaroslav Urbář (urbar(at)ufa.cas.cz), Institute of Atmospheric Physics, CAS, Czech Republic
Topical Editors (TE):
- Mateja Dumbovic (mateja.dumbovic(at)geof.unizg.hr), Hvar Observatory, Faculty of Geodesy, University of Zagreb, Croatia
- Lauri Holappa (lauri.holappa(at)oulu.fi), University of Oulu, Finland
- Paolo Romano (paolo.romano(at)inaf.it), INAF - Osservatorio Astrofisico di Catania, Italy
- Iulia Chifu (iulia.chifu(at)uni-goettingen.de), University of Göttingen, Germany
- Jens Berdermann (jens.berdermann(at)dlr.de), German Aerospace Center, Germany
- Stefan Hofmeister (stefan.hofmeister(at)columbia.edu), Columbia University, USA
- Miroslav Hanzelka (hanzelka(at)gfz-potsdam.de), GFZ Potsdam, Germany
For questions regarding this Topical Issue, please, contact the T-EiC. For questions concerning the submission process, please contact the Editorial Office (jswsc(at)edpsciences.org).
International Sunspot Number by SILSO
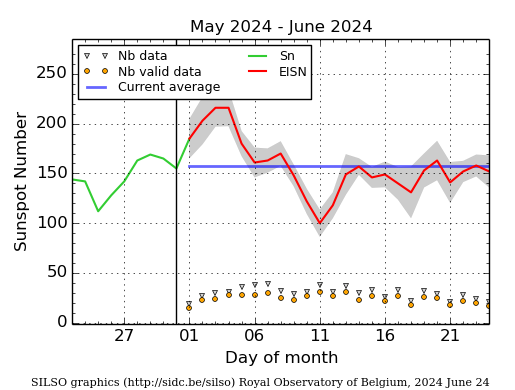
The daily Estimated International Sunspot Number (EISN, red curve with shaded error) derived by a simplified method from real-time data from the worldwide SILSO network. It extends the official Sunspot Number from the full processing of the preceding month (green line), a few days more than one solar rotation. The horizontal blue line shows the current monthly average. The yellow dots give the number of stations that provided valid data. Valid data are used to calculate the EISN. The triangle gives the number of stations providing data. When a triangle and a yellow dot coincide, it means that all the data is used to calculate the EISN of that day.
PROBA2 Observations
Solar Activity
Solar flare activity fluctuated from low to moderate during the week.
In order to view the activity of this week in more detail, we suggest to go to the following website from which all the daily (normal and difference) movies can be accessed: https://proba2.oma.be/ssa
This page also lists the recorded flaring events.
A weekly overview movie can be found here (SWAP week 743). https://proba2.sidc.be/swap/data/mpg/movies/weekly_movies/weekly_movie_2024_06_17.mp4
Details about some of this week�s events can be found further below.
If any of the linked movies are unavailable they can be found in the P2SC movie repository here https://proba2.sidc.be/swap/data/mpg/movies/
Monday Jun 17
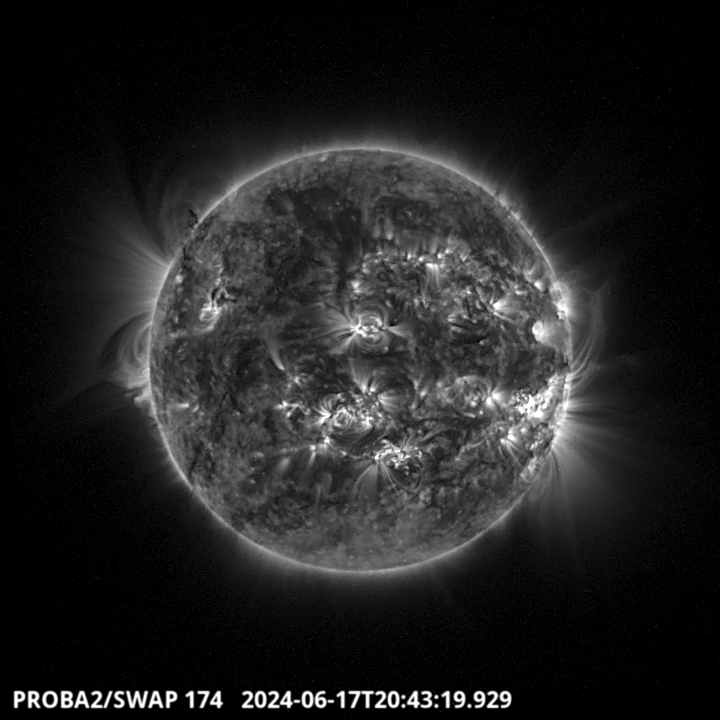
A filament erupted around 20:43 UT in the North-East part of the solar disc. It has been
registered by LYRA and SWAP instruments. Find a SWAP movie of the event here. https://proba2.sidc.be/swap/movies/20240617_swap_movie.mp4
Sunday Jun 23
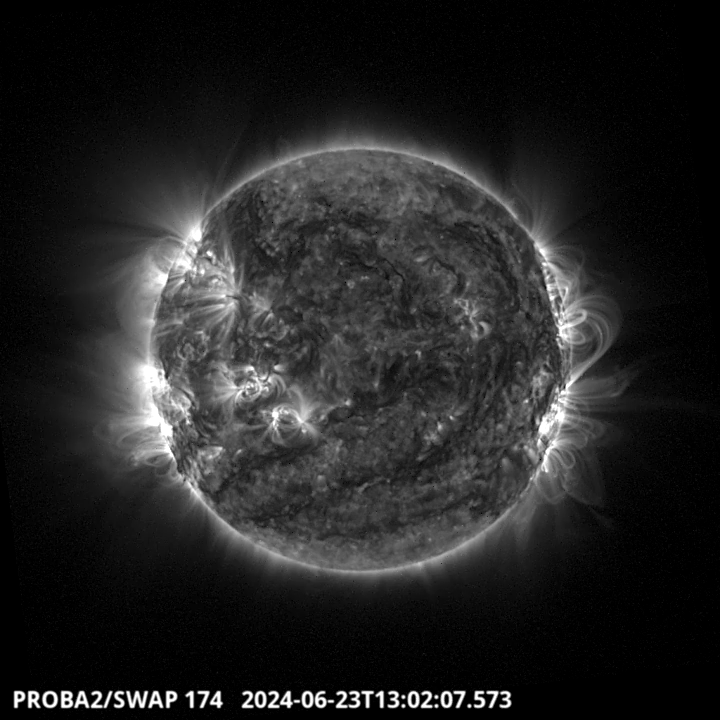
The largest flare of the week is a M9.3, it has been produced around 13:02 UT by the NOAA 3723
active region located in the South-East limb of the solar disc. Find a SWAP movie of the event here. https://proba2.sidc.be/swap/movies/20240623_swap_movie.mp4
Noticeable Solar Events
| DAY | BEGIN | MAX | END | LOC | XRAY | OP | 10CM | TYPE | Cat | NOAA |
| 17 | 0754 | 0804 | 0816 | S25W1 | M1.5 | SN | III/1 | 51 | 3712 | |
| 17 | 1042 | 1046 | 1050 | S26W13 | M1.5 | 1B | CTM/2II/2 | 51 | 3712 | |
| 17 | 1957 | 2035 | 2056 | S10W52 | M1.3 | 1F | VI/1 | 49 | 3711 | |
| 18 | 1114 | 1123 | 1133 | S28W20 | M2.4 | 1N | 51 | 3712 | ||
| 18 | 1211 | 1220 | 1226 | M1.1 | III/1 | 51 | 3712 | |||
| 19 | 0615 | 0638 | 0658 | S24W28 | M1.1 | SF | III/2VI/1 | 3711 | ||
| 20 | 1509 | 1518 | 1522 | M1.1 | 3719 | |||||
| 20 | 2300 | 2316 | 2320 | S14E57 | M5.7 | 1B | 3719 | |||
| 22 | 0422 | 0438 | 0447 | M1.2 | ||||||
| 22 | 0843 | 0855 | 0908 | N10W62 | M2.8 | 1F | 3716 | |||
| 22 | 1100 | 1106 | 1110 | S5E46 | M1.0 | SF | 3720 | |||
| 23 | 0616 | 0630 | 0648 | N9W72 | M2.4 | 1N | 3716 | |||
| 23 | 1126 | 1137 | 1150 | S25W84 | M1.2 | SF | 3712 | |||
| 23 | 1251 | 1301 | 1311 | S17E74 | M9.3 | 1N | 3723 |
| LOC: approximate heliographic location | TYPE: radio burst type |
| XRAY: X-ray flare class | Cat: Catania sunspot group number |
| OP: optical flare class | NOAA: NOAA active region number |
| 10CM: peak 10 cm radio flux |
Geomagnetic Observations in Belgium
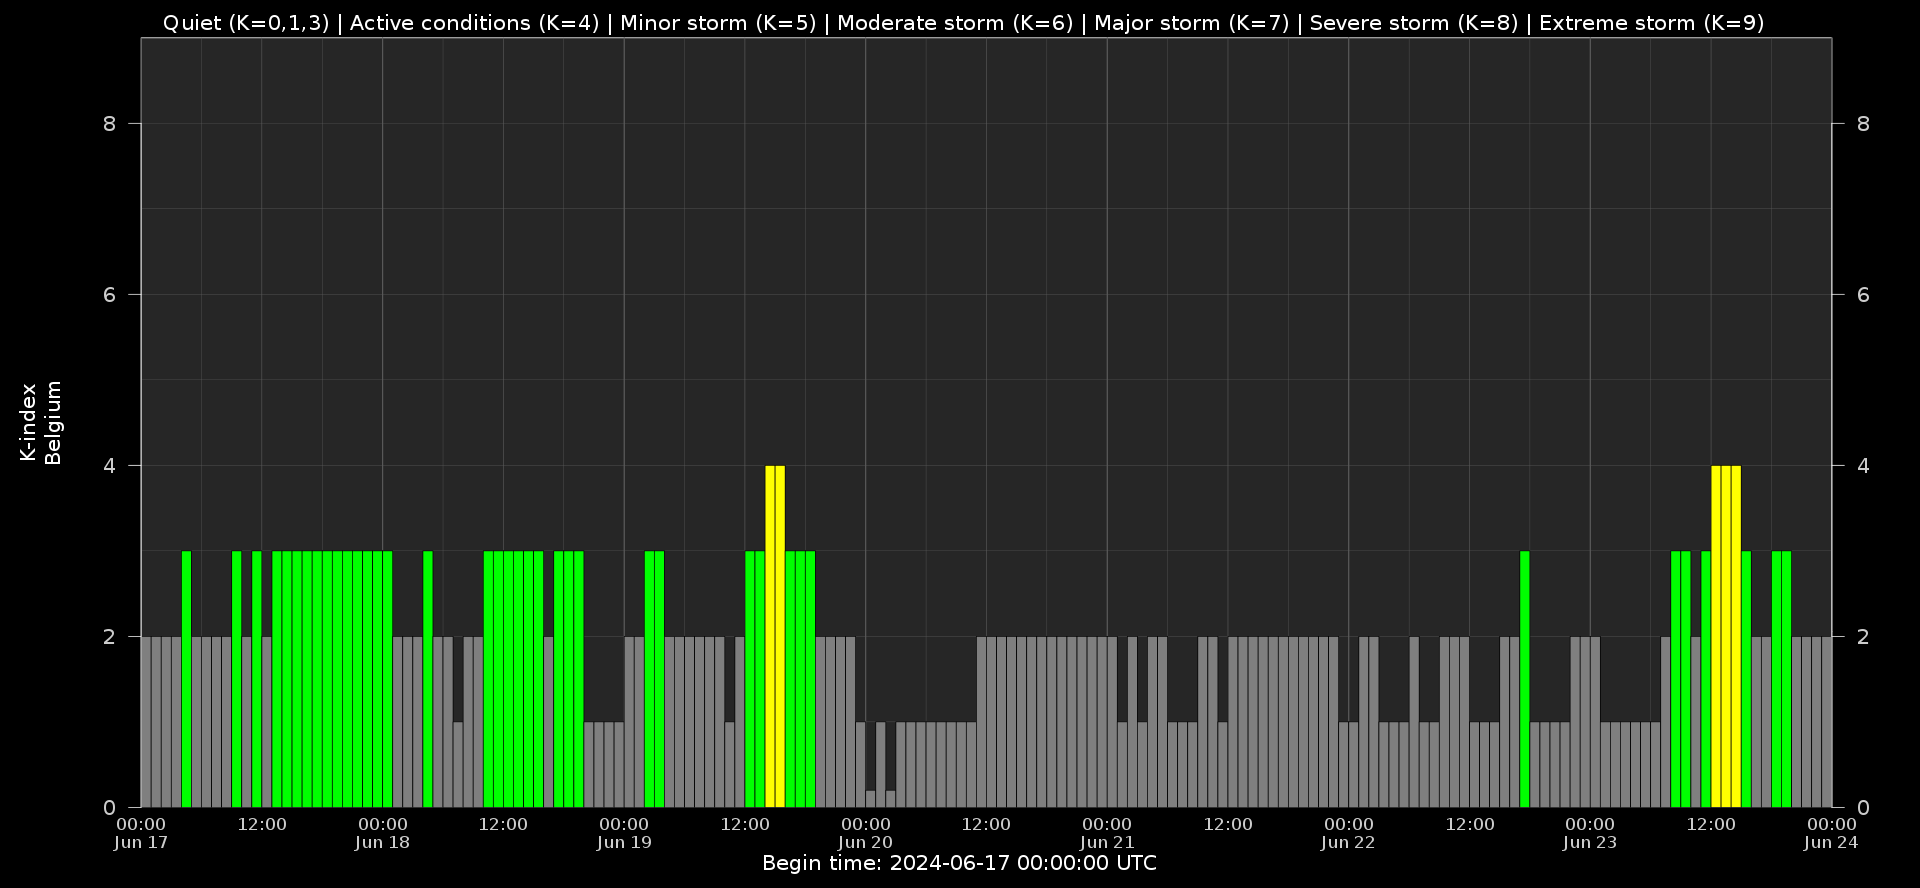
Local K-type magnetic activity index for Belgium based on data from Dourbes (DOU) and Manhay (MAB). Comparing the data from both measurement stations allows to reliably remove outliers from the magnetic data. At the same time the operational service availability is improved: whenever data from one observatory is not available, the single-station index obtained from the other can be used as a fallback system.
Both the two-station index and the single station indices are available here: http://ionosphere.meteo.be/geomagnetism/K_BEL/
Review of Ionospheric Activity
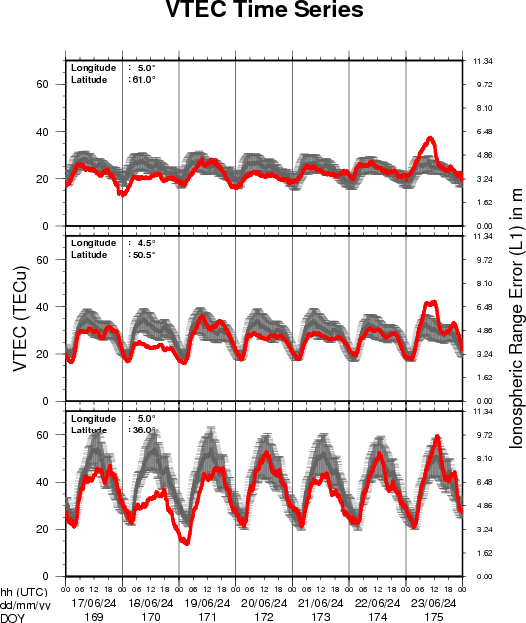
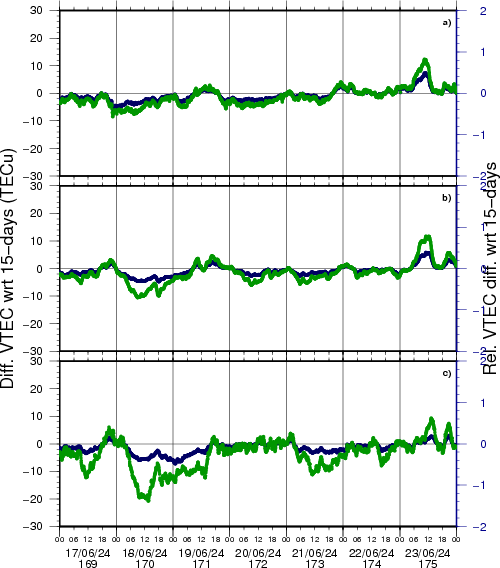
VTEC time series at 3 locations in Europe from 17 Jun 2024 till 23 Jun 2024
The top figure shows the time evolution of the Vertical Total Electron Content (VTEC) (in red) during the last week at three locations:
a) in the northern part of Europe(N 61deg E 5deg)
b) above Brussels(N 50.5deg, E 4.5 deg)
c) in the southern part of Europe(N 36 deg, E 5deg)
This top figure also shows (in grey) the normal ionospheric behaviour expected based on the median VTEC from the 15 previous days.
The time series below shows the VTEC difference (in green) and relative difference (in blue) with respect to the median of the last 15 days in the North, Mid (above Brussels) and South of Europe. It thus illustrates the VTEC deviation from normal quiet behaviour.
The VTEC is expressed in TECu (with TECu=10^16 electrons per square meter) and is directly related to the signal propagation delay due to the ionosphere (in figure: delay on GPS L1 frequency).
The Sun's radiation ionizes the Earth's upper atmosphere, the ionosphere, located from about 60km to 1000km above the Earth's surface.The ionization process in the ionosphere produces ions and free electrons. These electrons perturb the propagation of the GNSS (Global Navigation Satellite System) signals by inducing a so-called ionospheric delay.
See http://stce.be/newsletter/GNSS_final.pdf for some more explanations; for more information, see https://gnss.be/SpaceWeather
The SIDC Space Weather Briefing
The forecaster on duty presented the SIDC briefing that gives an overview of space weather from June 17 to 23.
The pdf of the presentation can be found here: https://www.stce.be/briefings/20240624_SWbriefing.pdf
Upcoming Activities
Courses and presentations with the Sun-Space-Earth system and Space Weather as the main theme. We provide occasions to get submerged in our world through educational, informative and instructive activities.
* June 28, public presentation Help! Het stormt in de ruimte!?, Wetenschappelijke middagen, Brussels, Belgium
* July 7, public presentation Totale zonsverduistering op vraag, Proba-3, de eclips-satelliet , Zonnekijkdagen, Genk, Belgium
* Sep 27, STCE at the Wisenight Science festival in the Planetarium, Brussel, https://wisenight.eu/
* Sep 30 - Oct 3, STCE Space Weather Introductory Course, Brussels, Belgium - Registrations are open https://events.spacepole.be/event/204/
* Nov 25 - 27, STCE course: Space Weather impacts on ionospheric wave propagation, focus on GNSS and HF, Brussels, Belgium - Registrations are open, https://events.spacepole.be/event/206/
* Dec 5-6, STCE Course Space Weather impacts on aviation, Brussels, Belgium - Registrations are open, https://events.spacepole.be/event/205/
To register for a course or lecture, check the page of the STCE Space Weather Education Center: https://www.stce.be/SWEC
If you want your event in the STCE newsletter, contact us: stce_coordination at stce.be