- Table of Content
- 1.An X12 flare o...
- 2.STCE Annual me...
- 3.Review of spac...
- 4.International ...
- 5.Noticeable Sol...
- 6.PROBA2 Observa...
- 7.Geomagnetic Ob...
- 8.The SIDC Space...
- 9.Review of Iono...
- 10.Lectures, cour...
2. STCE Annual meeting revisited
3. Review of space weather
4. International Sunspot Number by SILSO
5. Noticeable Solar Events
6. PROBA2 Observations (24 Jun 2024 - 30 Jun 2024)
7. Geomagnetic Observations in Belgium
8. The SIDC Space Weather Briefing
9. Review of Ionospheric Activity
10. Lectures, courses and presentations
An X12 flare on the Sun's farside
NOAA 3664 was rounding the southwest solar limb on 14 May when it produced the strongest solar flare so far this solar cycle (SC25), an X8.7 (see this STCE newsitem at https://www.stce.be/news/700/welcome.html ). At that time, it was already the third X-class event in less than 24 hours, so the source region clearly did not show signs of quieting down. Instead, during the subsequent days, more coronal mass ejections (CMEs) could be seen appearing from behind the west limb, a clear indication that NOAA 3664 continued its eruptive activity while transiting the farside of the Sun.
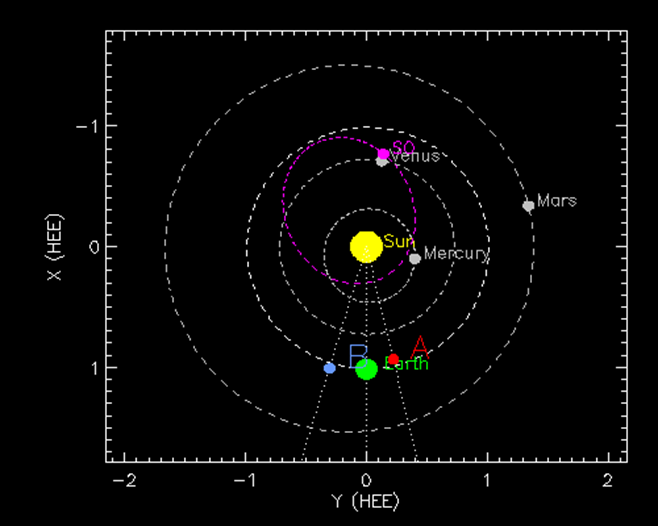
As such, the active region rotated into view of the solar telescopes on board Solar Orbiter, which was located on the other side of the Sun as seen from Earth. The map above shows the position of the Earth ("Earth", green), Solar orbiter ("SO", magenta), and STEREO-A ("A", red) with respect to the Sun. On 20 May, NOAA 3664 was located almost diametrically opposed to the Earth, and on the central meridian of the Sun as seen from Solar Orbiter. Around 05 UTC on 20 May, the region produced a strong solar flare, as observed with the Full Sun Imager (FSI ; Rochus et al. 2020: https://doi.org/10.1051/0004-6361/201936663 ) on board Solar Orbiter. The images underneath were taken using the 17.4 nm filter (FSI 174) and show the flare near its peak (left). The flare doesn't look that spectacular, but this is due entirely to the design of the instrument that basically prevents the blooming pattern that can often be seen in flare imagery from e.g. SDO and STEREO (see this STCE newsitem at https://www.stce.be/news/499/welcome.html ), and thus allows for a much more detailed study of the flaring region. The flare got accompanied by an impressive and wide coronal dimming, as can be discerned in the two images to the right which are from before (03:20UTC, upper right) and after the solar flare (06:00UTC, lower right). The dimming is truly astonishing in the online movie (https://www.stce.be/news/712/welcome.html ).

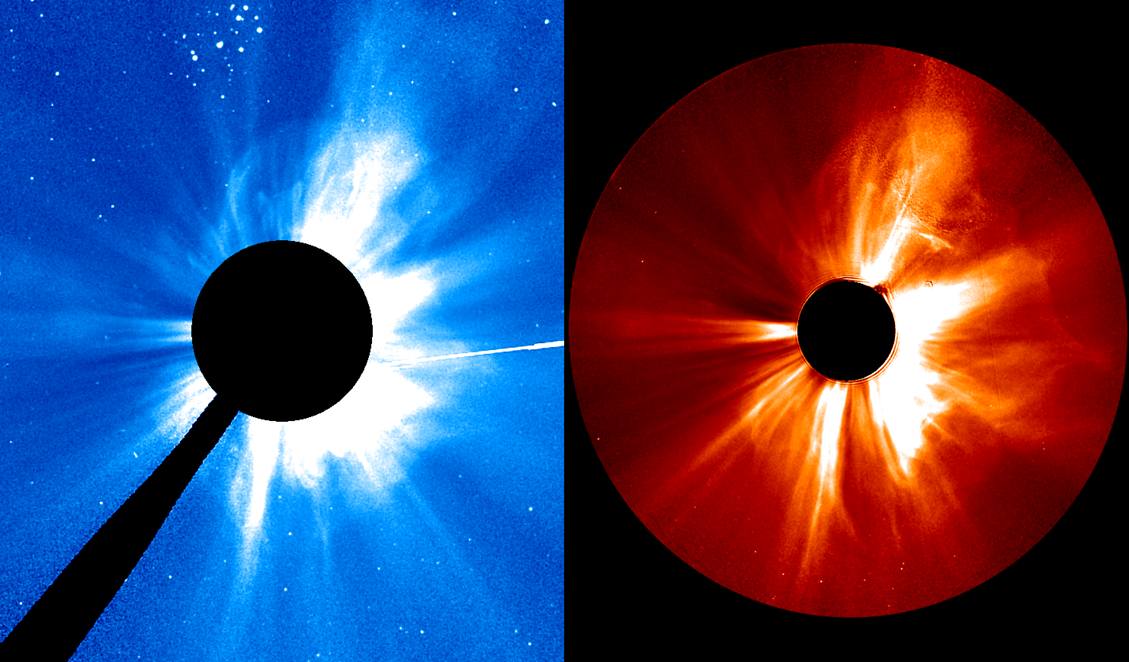
The strong flare was associated with a small enhancement of the proton flux observed by the GOES around Earth, despite the poor magnetic connection between NOAA 3664 (farside) and Earth (see the space weather briefing in the STCE Newsletter of 31 May - https://www.stce.be/newsletter/pdf/2024/STCEnews20240531.pdf ). An impressive halo coronal mass ejection (CME) was observed by coronagraphs on board SOHO (left) and STEREO-A (right), as shown in the imagery underneath. CACTus (https://www.sidc.be/cactus/ ) reported a plane-of-the-sky speed for this CME of 750 km/s, obviously directed away from the Earth. Note that STEREO-A is preceding Earth by about 13 degrees.
With NOAA 3664 on the farside, GOES can't make measurements of the soft x-ray (SXR ; https://www.swpc.noaa.gov/products/goes-x-ray-flux ) intensity of the flares produced by this region. Fortunately, scientists are very creative in using observations from any spacecraft that is monitoring the Sun's farside as a proxy for the GOES measurements. In this case, Solar Orbiter was on the right place. The Spectrometer Telescope for Imaging X-rays (STIX ; Krucker et al. 2020: https://doi.org/10.1051/0004-6361/201937362 ) on Solar Orbiter is a hard X-ray (HXR) imaging spectrometer, covering the energy range from 4 to 150 keV, therefore providing diagnostics of the hottest plasmas in solar flares. An "attenuator", i.e. a movable aluminum tool that can be inserted during high-rate periods (Figure 11 in Krucker et al. 2020: https://doi.org/10.1051/0004-6361/201937362 ), can be used to further limit the detectors' exposure to high fluxes of low energy flare X-rays (compared to high-energy X-rays). Hence, STIX' HXR measurements can of course not directly be compared to the GOES' SXR recordings, but given enough statistics the STIX readings can be correlated and used to provide an estimated value of the GOES SXR intensity, very similar to e.g. GOES and PROBA2/LYRA - https://proba2.sidc.be/ssa . Thus, ESA scientists (https://www.esa.int/Science_Exploration/Space_Science/Solar_Orbiter/Can_t_stop_won_t_stop_Solar_Orbiter_shows_the_Sun_raging_on ) concluded that, based on the STIX observations shown underneath (STIX data Center: https://datacenter.stix.i4ds.net/view/ql/lightcurves ), the eruption in NOAA 3664 reached an estimated GOES SXR intensity between X5.8 and X25, with X12 the most likely value. This would make it the strongest solar flare so far this solar cycle (SC25), and brings it into the Top 30 of strongest solar flares observed since 1976 when the GOES measurements started.

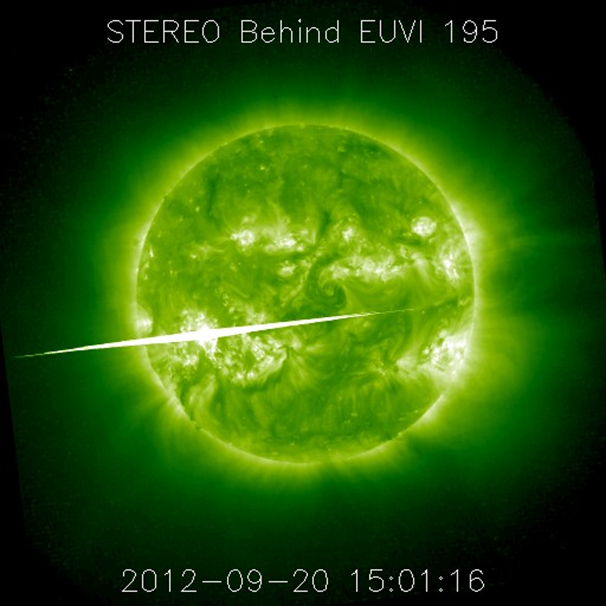
The situation is very similar as during SC24, when on 20 September 2012 a very powerful flare was detected by the STEREO-B spacecraft on the Sun's farside. Various analyses (Nitta et al. 2013 - https://link.springer.com/article/10.1007/s11207-013-0307-7 ; Chertok et al. 2015 - https://link.springer.com/article/10.1007/s11207-015-0738-4 ) suggest that this flare had an estimated GOES intensity of X12, within a range of X6-X18 (uncorrected, downscaled GOES-values, see the NGDC/NOAA bulletin at https://www.ngdc.noaa.gov/stp/satellite/goes/index.html ). This would basically make it the strongest solar flare of SC24, the largest -by GOES observed- being the X9.3 flare on 6 September 2017 (STCE newsitem at https://www.stce.be/news/402/welcome.html ). The imagery underneath shows extreme ultraviolet images of the 20 September 2012 flare taken by STEREO-B/EUVI 195.
STCE Annual meeting revisited
Relive the STCE Annual meeting by going through the presentations: https://events.spacepole.be/event/203/
Click on the paper clips in the time table.
Thanks to Ronald, Emilien, Dries, Daan, Marius, Sabrina, Hervé, Nicolas, Danislav, Viviane, Tobias, Mark, Yana - (almost) in order of appearance
Review of space weather
Regions
Solar flaring activity over the past week was moderate until June 25, then decreased to low levels for the rest of the week. There were 20 active regions visible throughout the week. A total of 48 C-class flares and 7 M-class flares were recorded. The largest flare of the period was an impulsive M9.3 flare, peaking at 13:01 UTC on June 23, associated with NOAA AR 3723. This region corresponds to the return of NOAA AR 3697, which produced several X-flares in previous rotations. The M9.3 flare originated beyond the southeast limb before the region rotated onto the visible side of the solar disk. After the region rotated onto the disk, it produced one M-class flare (M1.0 flare, peaking at 12:45 UTC on June 25) and several C-class flares. NOAA AR 3712, which rotated over the west limb at the beginning of the week, produced two M-class flares (M1.3 and M1.8, peaking at 04:17 UTC and 04:52 UTC on June 24). Low M-class flaring activity was also produced by NOAA AR 3713 (M1.5 and M1.1, peaking at 11:48 and 19:10 UTC on June 24) and 3720 (M1.1, peaking at 11:13 on June 24).
Coronal Mass Ejections
The solar surface was streaked with filaments. Four filament eruptions resulted in the detection of coronal mass ejections (CMEs) with an Earth-directed component. The first was associated to a large filament in the southeast quadrant around 02:00 UTC on June 25, which produced a partial halo CME, directed primarily to the west from Earth's perspective. This CME was first detected by LASCO/C2 coronagraph data at 05:24 UTC on June 25. Two smaller filament eruptions were seen in SDO/AIA 304 later on June 25: at 11:37 UTC in the southeast quadrant and at 22:18 UTC near the disc center. The associated CMEs came into the view of SOHO/LASCO-C2 from 13:25 UTC on June 25 and 00:00 UTC on June 26. Finally, a halo CME was observed by the coronagraph LASCO/C2 at 16:00 UTC on June 29. This CME was directed primarily to the southwest from Earth's perspective and was associated with a large filament eruption in the southwestern quadrant around 15:12 UTC on June 29.
Coronal Holes
No Coronal Hole crossings of the central solar meridian were observed during the past week.
Solar Protons near Earth
The greater than 10 MeV GOES proton flux remained at nominal levels throughout the week.
Electrons in the outer radiation belt
The greater than 2 MeV electron flux, as measured by the GOES-16 satellite, remained below the 1000 pfu threshold through the week. The 24 hour electron fluence was at normal levels.
Solar Wind
The solar wind parameters indicated a near slow solar wind regime at the beginning of the week. Solar wind conditions became slightly enhanced from around 09:10 UTC on June 28, likely registering the arrival of the CMEs of June 25. The total magnetic field reached a maximum of 30 nT with a minimum Bz of -24 nT, and the solar wind speed ranged between 360 km/s and 500 km/s. The magnetic field was oriented towards the Sun (i.e. the negative sector) until June 28, after which it switched and was directed away from the Sun.
Geomagnetism
Geomagnetic activity was at quiet to unsettled levels at the beginning of the week. The geomagnetic conditions reached severe storm levels globally (NOAA Kp 8-) between 12:00 and 15:00 UTC on June 28 due to the prolonged period of negative Bz following the ICME arrival. Locally, moderate storm conditions were observed over Belgium (K-Bel = 6) between 12:00 and 18:00 UTC on June 28. For the remaining part of the week, geomagnetic conditions were mostly at quiet to unsettled levels.
International Sunspot Number by SILSO
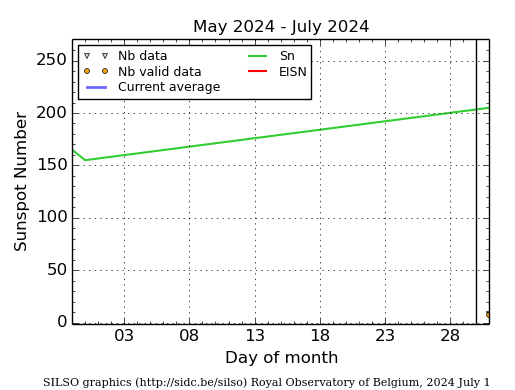
The daily Estimated International Sunspot Number (EISN, red curve with shaded error) derived by a simplified method from real-time data from the worldwide SILSO network. It extends the official Sunspot Number from the full processing of the preceding month (green line), a few days more than one solar rotation. The horizontal blue line shows the current monthly average. The yellow dots give the number of stations that provided valid data. Valid data are used to calculate the EISN. The triangle gives the number of stations providing data. When a triangle and a yellow dot coincide, it means that all the data is used to calculate the EISN of that day.
Noticeable Solar Events
| DAY | BEGIN | MAX | END | LOC | XRAY | OP | 10CM | TYPE | Cat | NOAA |
| 24 | 0408 | 0417 | 0423 | M1.3 | 3712 | |||||
| 24 | 0445 | 0452 | 0456 | M1.8 | 3712 | |||||
| 24 | 1144 | 1148 | 1153 | M1.5 | 52 | 3713 | ||||
| 24 | 1109 | 1113 | 1115 | S5E18 | M1.1 | 1F | 58 | 3720 | ||
| 24 | 1902 | 1910 | 1914 | M1.1 | 52 | 3713 | ||||
| 25 | 1226 | 1245 | 1306 | S18E58 | M1.0 | SF | 66 | 3723 |
| LOC: approximate heliographic location | TYPE: radio burst type |
| XRAY: X-ray flare class | Cat: Catania sunspot group number |
| OP: optical flare class | NOAA: NOAA active region number |
| 10CM: peak 10 cm radio flux |
PROBA2 Observations (24 Jun 2024 - 30 Jun 2024)
Solar Activity
Solar flare activity fluctuated from low to moderate during the week.
In order to view the activity of this week in more detail, we suggest to go to the following website from which all the daily (normal and difference) movies can be accessed: https://proba2.oma.be/ssa
This page also lists the recorded flaring events.
A weekly overview movie (SWAP week 744) can be found here: https://proba2.sidc.be/swap/data/mpg/movies/weekly_movies/weekly_movie_2024_06_24.mp4.
Details about some of this week's events can be found further below.
If any of the linked movies are unavailable they can be found in the P2SC movie repository here: https://proba2.oma.be/swap/data/mpg/movies/.
Monday June 24
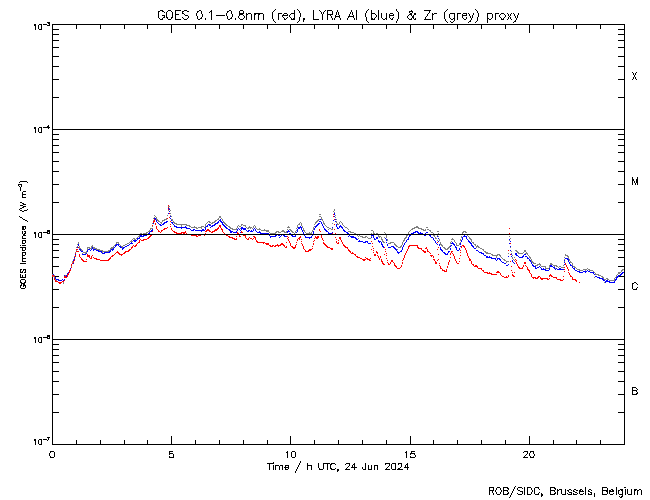

The largest flare of this week was an M1.8, and it was observed by LYRA (top panel) and SWAP (bottom panel). The flare peaked on 2024-Jun-24 at 04:52 UT. It occurred at the south-western limb, originating from NOAA AR3712.
Find a SWAP movie of the event here: https://proba2.sidc.be/swap/movies/20240624_swap_movie.mp4.
Geomagnetic Observations in Belgium
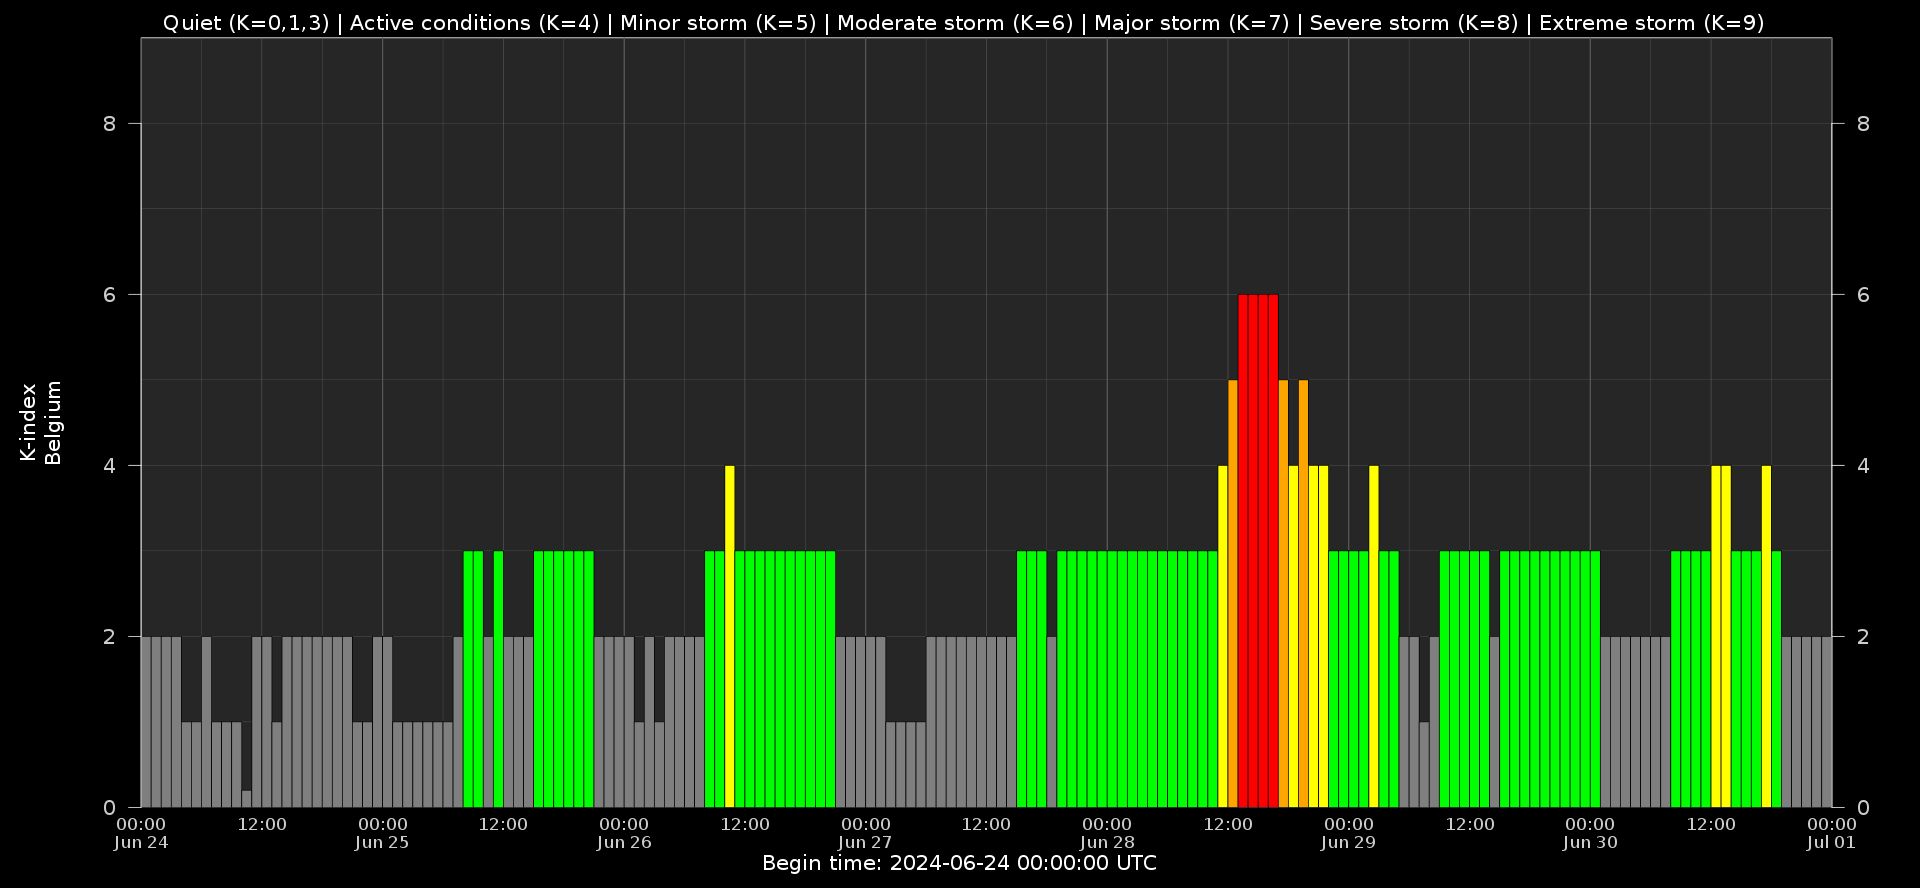
Local K-type magnetic activity index for Belgium based on data from Dourbes (DOU) and Manhay (MAB). Comparing the data from both measurement stations allows to reliably remove outliers from the magnetic data. At the same time the operational service availability is improved: whenever data from one observatory is not available, the single-station index obtained from the other can be used as a fallback system.
Both the two-station index and the single station indices are available here: http://ionosphere.meteo.be/geomagnetism/K_BEL/
The SIDC Space Weather Briefing
The Space Weather Briefing presented by the forecaster on duty from June 23 to 30.
The pdf of the presentation can be found here: https://www.stce.be/briefings/20240701_SWbriefing.pdf
Review of Ionospheric Activity
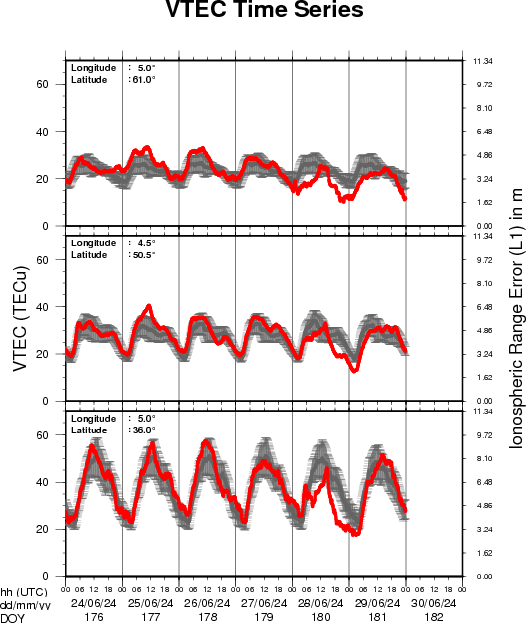
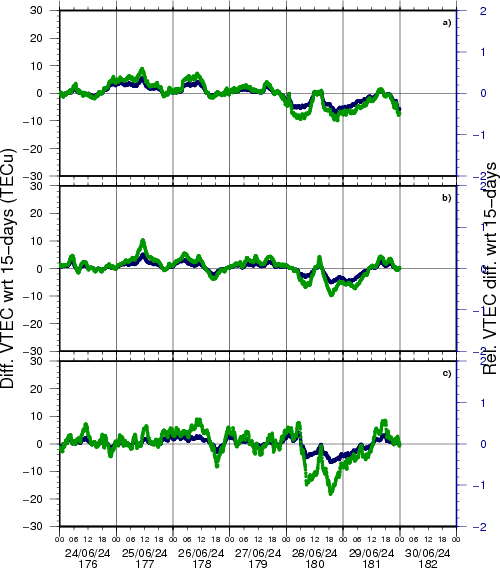
VTEC time series at 3 locations in Europe from 24 Jun 2024 till 30 Jun 2024
The top figure shows the time evolution of the Vertical Total Electron Content (VTEC) (in red) during the last week at three locations:
a) in the northern part of Europe(N 61deg E 5deg)
b) above Brussels(N 50.5deg, E 4.5 deg)
c) in the southern part of Europe(N 36 deg, E 5deg)
This top figure also shows (in grey) the normal ionospheric behaviour expected based on the median VTEC from the 15 previous days.
The time series below shows the VTEC difference (in green) and relative difference (in blue) with respect to the median of the last 15 days in the North, Mid (above Brussels) and South of Europe. It thus illustrates the VTEC deviation from normal quiet behaviour.
The VTEC is expressed in TECu (with TECu=10^16 electrons per square meter) and is directly related to the signal propagation delay due to the ionosphere (in figure: delay on GPS L1 frequency).
The Sun's radiation ionizes the Earth's upper atmosphere, the ionosphere, located from about 60km to 1000km above the Earth's surface.The ionization process in the ionosphere produces ions and free electrons. These electrons perturb the propagation of the GNSS (Global Navigation Satellite System) signals by inducing a so-called ionospheric delay.
See http://stce.be/newsletter/GNSS_final.pdf for some more explanations; for more information, see https://gnss.be/SpaceWeather
Lectures, courses and presentations
Courses and presentations with the Sun-Space-Earth system and Space Weather as the main theme. We provide occasions to get submerged in our world through educational, informative and instructive activities.
* June 28, public presentation Help! Het stormt in de ruimte!?, Wetenschappelijke middagen, Brussels, Belgium
* July 7, public presentation Totale zonsverduistering op vraag, Proba-3, de eclips-satelliet , Zonnekijkdagen, Genk, Belgium
* Sep 27, STCE at the Wisenight Science festival in the Planetarium, Brussel, https://wisenight.eu/
* Sep 30 - Oct 3, STCE Space Weather Introductory Course, Brussels, Belgium - Registrations are open https://events.spacepole.be/event/204/
* Nov 25 - 27, STCE course: Space Weather impacts on ionospheric wave propagation, focus on GNSS and HF, Brussels, Belgium - Registrations are open, https://events.spacepole.be/event/206/
* Dec 5-6, STCE Course Space Weather impacts on aviation, Brussels, Belgium - Registrations are open, https://events.spacepole.be/event/205/
To register for a course or lecture, check the page of the STCE Space Weather Education Center: https://www.stce.be/SWEC
If you want your event in the STCE newsletter, contact us: stce_coordination at stce.be