- Table of Content
- 1.X1 flare in NO...
- 2.Review of spac...
- 3.Noticeable Sol...
- 4.International ...
- 5.PROBA2 Observa...
- 6.Geomagnetic Ob...
- 7.The SIDC Space...
- 8.Review of Iono...
- 9.Lectures and c...
2. Review of space weather
3. Noticeable Solar Events
4. International Sunspot Number by SILSO
5. PROBA2 Observations (8 Jul 2024 - 14 Jul 2024)
6. Geomagnetic Observations in Belgium
7. The SIDC Space Weather Briefing
8. Review of Ionospheric Activity
9. Lectures and courses
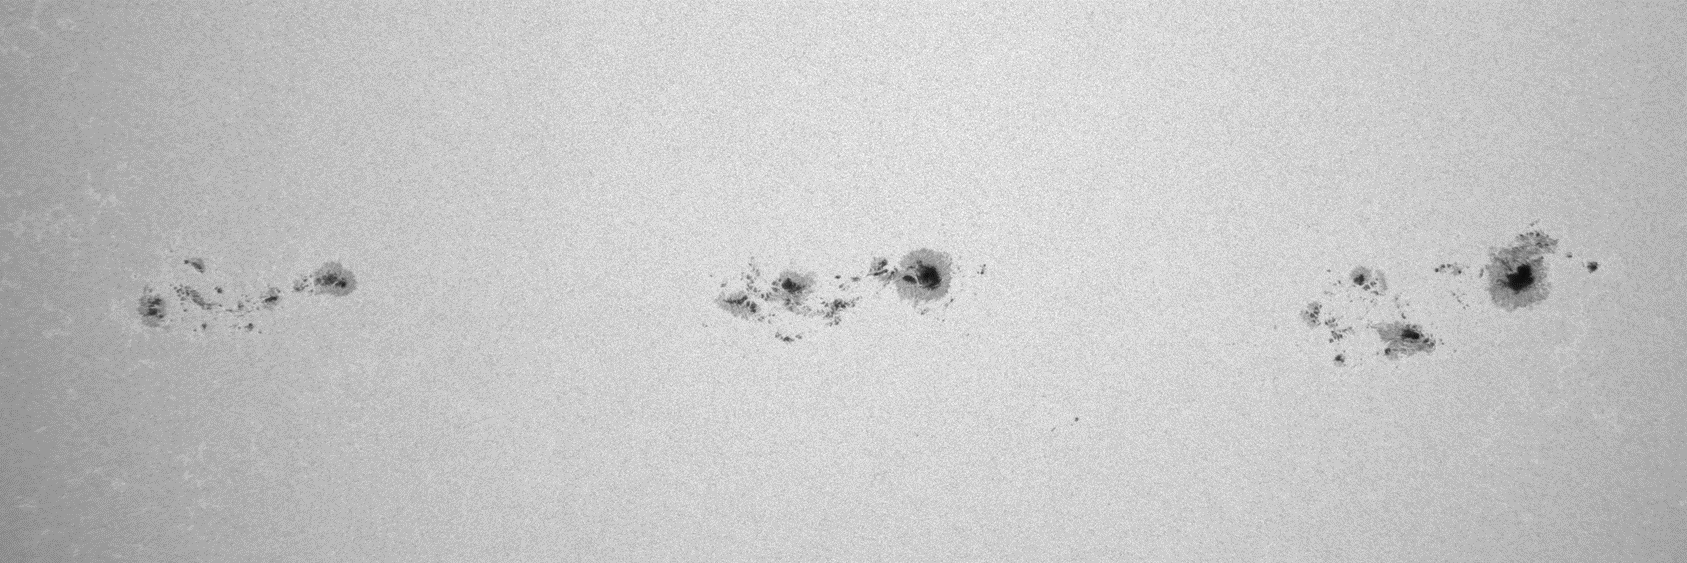
X1 flare in NOAA 3738
NOAA 3738 was the largest and most complex sunspot group visible on the solar disk during the past week. At the beginning of the week, its sunspot area was barely more than the total surface area of the Earth, but a week later on 13 and 14 July its area had increased to over 6 times the Earth's surface area. The SDO/AIA image underneath shows the evolution of NOAA 3738 in white light (SDO/HMI - http://sdo.gsfc.nasa.gov/data/aiahmi/ ) on 7, 10 and 13 July. A movie is available in the online newsflash at https://www.stce.be/news/714/welcome.html
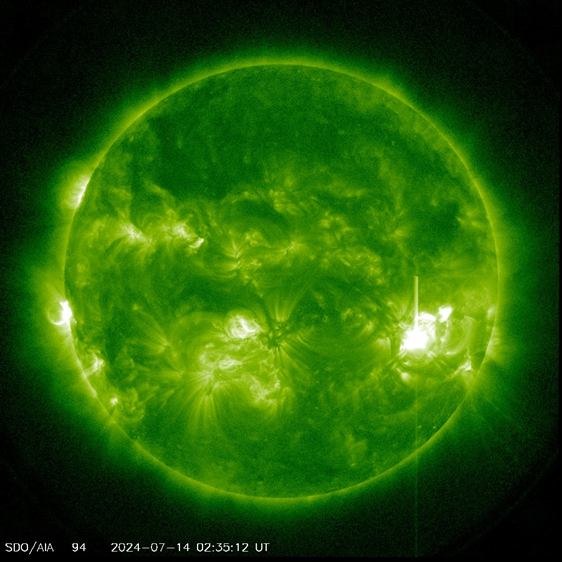
The growth of NOAA 3738 came in spurts, and so was flaring activity. From 13 July onwards, a new episode of enhanced solar flare activity started, eventually culminating in an X1.2 flare that peaked on 14 July at 02:34UTC. The location was in the trailing portion of this active region, whereas the other flares produced by NOAA 3738 took place near the main leading sunspot, where some magnetic delta structure had developed. The extreme ultraviolet imagery underneath is from SDO/AIA 094 near the time of the flare's peak.
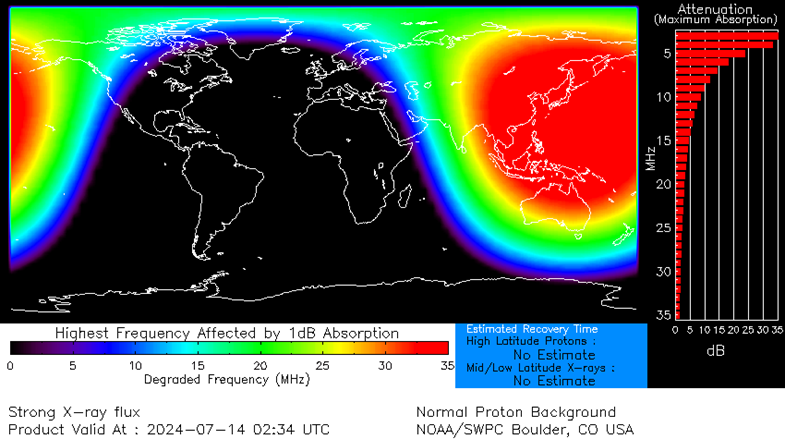
The eruption apparently was not associated with coronal dimming or a coronal mass ejection (CME). Space weather effects from the x-ray flares were limited to some minor disturbances of HF Com on the Earth's dayside, i.e. over the western portion of the Pacific Ocean, Australia, Southeast Asia, China and Japan (DRAP - https://www.swpc.noaa.gov/products/d-region-absorption-predictions-d-rap ; map underneath). Magnetometer stations in these locations recorded a small solar flare effect of about 5 nT (Intermagnet (BGS)). An advisory for disturbed HF Com was sent to the civil aviation through PECASUS (https://pecasus.eu/ ). The flare itself was associated with radio bursts on various frequencies at and above 2 GHz (NOAA/USAF network). NOAA 3738 is expected to produce further M-class flaring with a chance on another X-class flare.
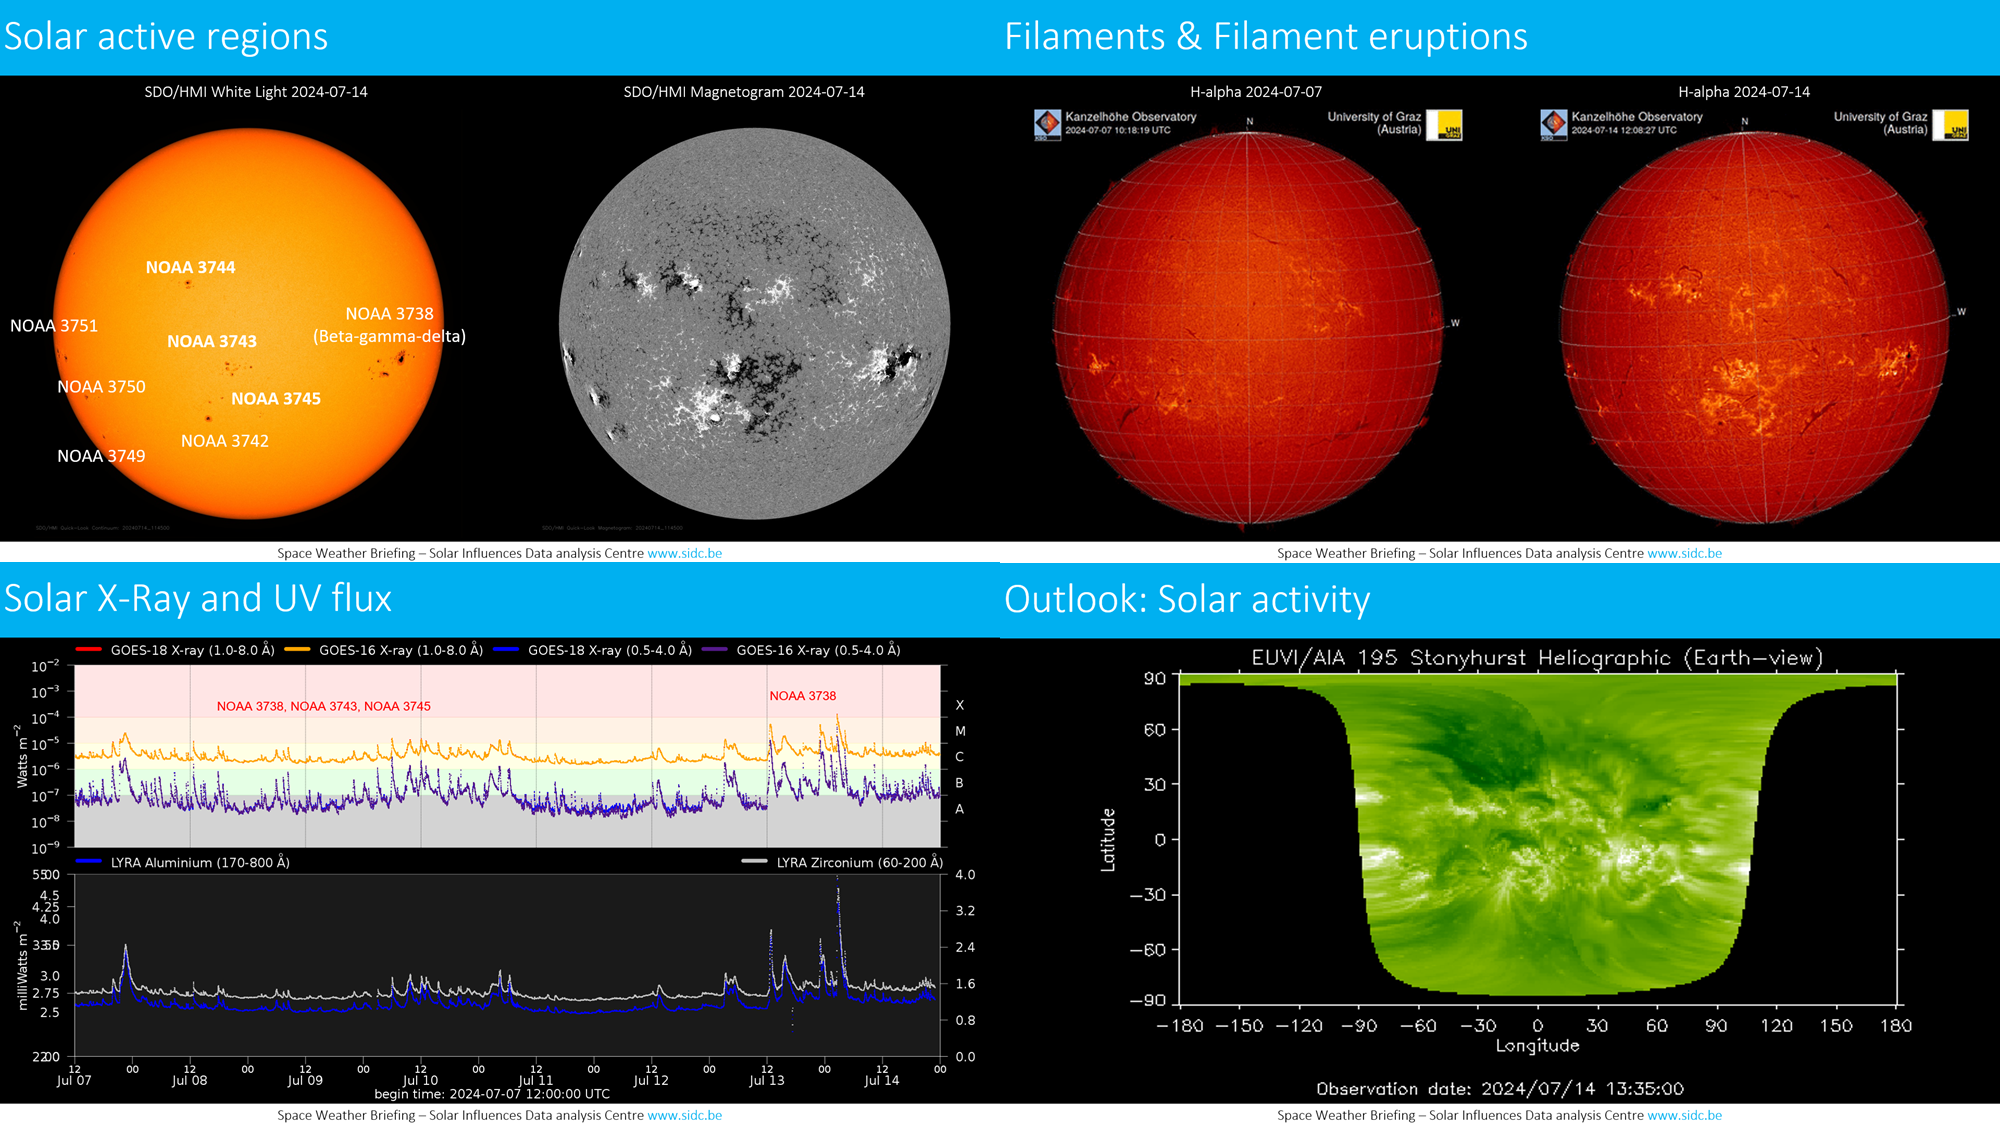
Review of space weather
Solar Active Regions (ARs) and flares
The solar flaring activity over the past week was at low to high levels with almost daily M-class flaring and an X1.2 flare with start time 02:23 UTC, peak time 02:34 UTC, end time 02:48 UTC on July 14. There were over thirteen numbered and several unnumbered active regions on the visible solar disc. The largest and most complex region throughout the entire week was NOAA AR 3738, which started as magnetic type beta-gamma and evolved towards the end of the week to magnetic type beta-gamma-delta. This region was the main driver of most of the flaring activity throughout the week. NOAA AR 3743 (beta-gamma), NOAA AR 3745 (beta) and NOAA AR 3751 (beta) also contributed to the moderate levels of activity with isolated low M-class flaring.
Coronal mass ejections
There were multiple filament and prominence eruptions, including a fast partial halo coronal mass ejection (CME) detected in the LASCO/C2 coronagraph imagery starting at 21:24 UTC on July 10. None of these events were expected to have an Earth-directed component and there were no other CME arrival forecasted, nor detected throughout the week.
Coronal holes
Multiple negative polarity coronal holes and one long and patchy positive polarity coronal hole have crossed the central meridian throughout the week.
Proton flux levels
The greater than 10 MeV proton flux was at nominal levels throughout the entire week.
Electron fluxes at GEO
The greater than 2 MeV electron flux as measured by GOES 16 and GOES 18 was below the 1000 pfu threshold throughout the entire week. The electron fluence was at nominal levels throughout the entire week.
Solar wind at L1
The solar wind conditions throughout the entire week were mostly indicative of nominal slow solar wind conditions with velocities below 445 km/s. Slight enhancements in the solar wind data possibly indicative of a connection to negative polarity coronal holes were registered on July 08 and July 09 with the interplanetary magnetic field reaching almost 11 nT and a minimum Bz component reaching -8.5 nT. A connection to a positive polarity coronal was expected on July 13 and July 14 when the interplanetary magnetic field registered a rotation and the phi angle started switching from the negative to the positive sector. Despite that there were no clear signatures of a high speed stream arrival and the solar wind remained at slow solar wind regime.
Geomagnetism
The geomagnetic conditions were at globally quiet to unsettled levels on July 08 and remained quiet throughout the rest of the week. The local geomagnetic conditions over Belgium started at quiet to active levels on July 08 and continued at quiet to unsettled levels throughout the week.
Noticeable Solar Events
| DAY | BEGIN | MAX | END | LOC | XRAY | OP | 10CM | TYPE | Cat | NOAA |
| 08 | 1234 | 1241 | 1246 | S23E78 | M1.1 | SF | ||||
| 10 | 0544 | 0559 | 0609 | S10E21 | M1.5 | SN | 85 | 3738 | ||
| 10 | 0926 | 0945 | 0953 | S10E10 | M1.3 | SF | 85 | 3738 | ||
| 10 | 1144 | 1204 | 1217 | S10E1 | M1.4 | 1F | 85 | 3738 | ||
| 10 | 1251 | 1304 | 1313 | S10E1 | M1.1 | 1F | 85 | 3738 | ||
| 10 | 1525 | 1537 | 1546 | S8E3 | M1.0 | SF | 85 | 3738 | ||
| 11 | 0403 | 0417 | 0437 | S8E9 | M1.2 | SF | 94 | 3745 | ||
| 11 | 0617 | 0625 | 0632 | M1.2 | 85 | 3738 | ||||
| 13 | 0255 | 0318 | 0336 | M1.4 | 85 | 3738 | ||||
| 13 | 1221 | 1242 | 1258 | M5.3 | /1 29I/1 | 85 | 3738 | |||
| 13 | 1459 | 1530 | 1541 | M1.8 | 5 | 3747 | ||||
| 13 | 1541 | 1544 | 1548 | M1.9 | 5 | 3747 | ||||
| 13 | 1925 | 1930 | 1934 | M1.0 | F | 85 | 3738 | |||
| 13 | 2244 | 2301 | 2312 | M5.0 | 85 | 3738 | ||||
| 14 | 0105 | 0116 | 0131 | M1.7 | 85 | 3738 | ||||
| 14 | 0223 | 0234 | 0248 | X1.2 | II/2 | 85 | 3738 | |||
| 14 | 0405 | 0413 | 0418 | M3.0 | F | I/2II/1 | 85 | 3738 | ||
| 14 | 1016 | 1020 | 1024 | M1.0 | F | 85 | 3738 | |||
| 14 | 2050 | 2057 | 2103 | M1.0 | 85 | 3738 |
| LOC: approximate heliographic location | TYPE: radio burst type |
| XRAY: X-ray flare class | Cat: Catania sunspot group number |
| OP: optical flare class | NOAA: NOAA active region number |
| 10CM: peak 10 cm radio flux |
International Sunspot Number by SILSO

The daily Estimated International Sunspot Number (EISN, red curve with shaded error) derived by a simplified method from real-time data from the worldwide SILSO network. It extends the official Sunspot Number from the full processing of the preceding month (green line), a few days more than one solar rotation. The horizontal blue line shows the current monthly average. The yellow dots give the number of stations that provided valid data. Valid data are used to calculate the EISN. The triangle gives the number of stations providing data. When a triangle and a yellow dot coincide, it means that all the data is used to calculate the EISN of that day.
PROBA2 Observations (8 Jul 2024 - 14 Jul 2024)
Solar Activity
Solar flare activity fluctuated from low to high during the week.
In order to view the activity of this week in more detail, we suggest to go to the following website from which all the daily (normal and difference) movies can be accessed: https://proba2.oma.be/ssa
This page also lists the recorded flaring events.
A weekly overview movie (SWAP week 746) can be found here: https://proba2.sidc.be/swap/data/mpg/movies/weekly_movies/weekly_movie_2024_07_08.mp4.
Details about some of this week's events can be found further below.
If any of the linked movies are unavailable they can be found in the P2SC movie repository here: https://proba2.oma.be/swap/data/mpg/movies/.
Sunday July 14
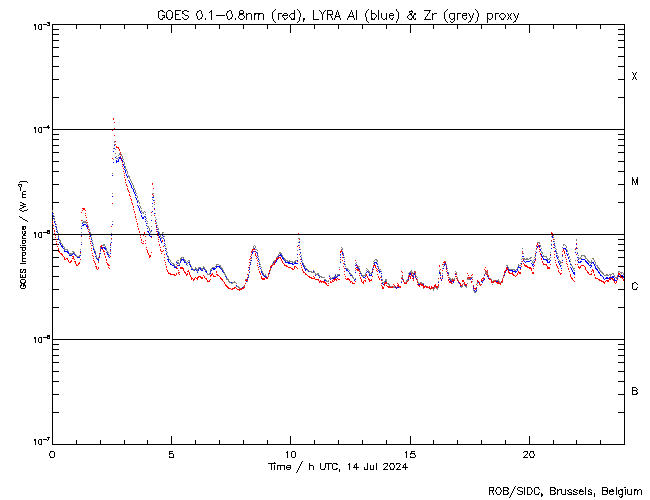
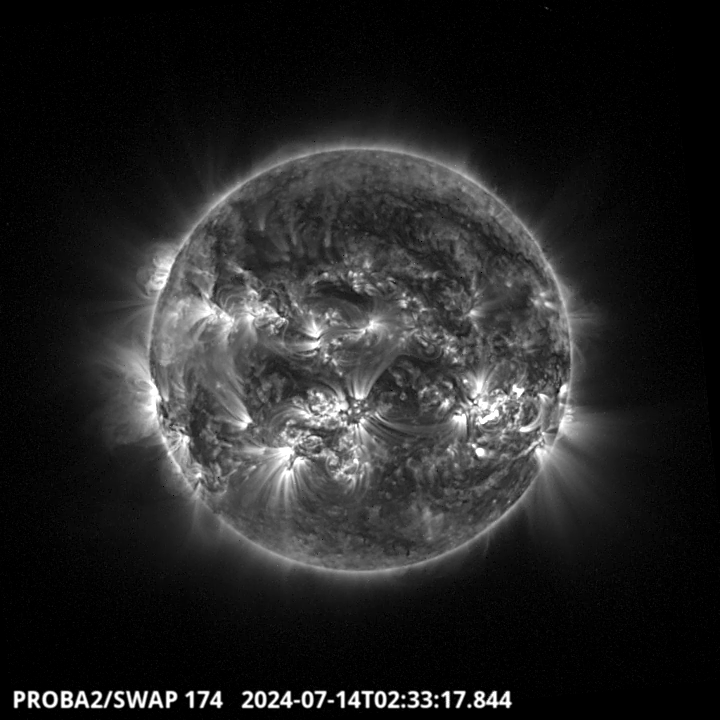
The largest flare of this week was an X1.2, and it was observed by LYRA (top panel) and SWAP (bottom panel). The flare peaked on 2024-Jul-14 at 02:34 UT. It occurred in the south-western quadrant, originating from NOAA AR3738.
Find a SWAP movie of the event here: https://proba2.sidc.be/swap/movies/20240714_swap_movie.mp4.
Geomagnetic Observations in Belgium

Local K-type magnetic activity index for Belgium based on data from Dourbes (DOU) and Manhay (MAB). Comparing the data from both measurement stations allows to reliably remove outliers from the magnetic data. At the same time the operational service availability is improved: whenever data from one observatory is not available, the single-station index obtained from the other can be used as a fallback system.
Both the two-station index and the single station indices are available here: http://ionosphere.meteo.be/geomagnetism/K_BEL/
The SIDC Space Weather Briefing
The forecaster on duty presented the SIDC briefing that gives an overview of space weather from July 7 to July 14.
The pdf of the presentation can be found here: https://www.stce.be/briefings/20240715_SWbriefing.pdf
Review of Ionospheric Activity
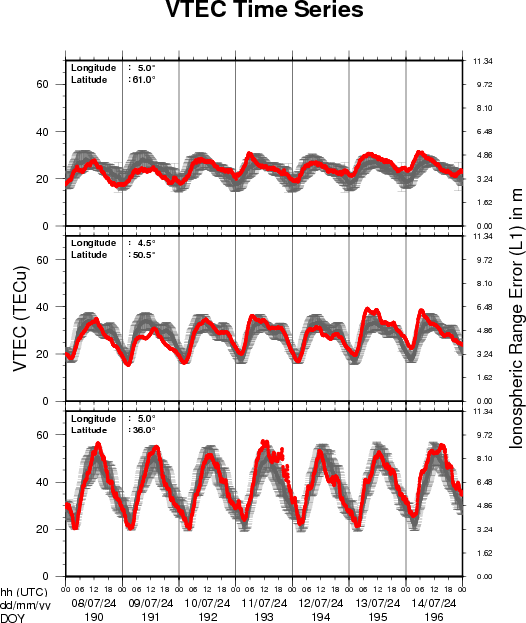

VTEC time series at 3 locations in Europe from 8 Jul 2024 till 14 Jul 2024
The top figure shows the time evolution of the Vertical Total Electron Content (VTEC) (in red) during the last week at three locations:
a) in the northern part of Europe(N 61deg E 5deg)
b) above Brussels(N 50.5deg, E 4.5 deg)
c) in the southern part of Europe(N 36 deg, E 5deg)
This top figure also shows (in grey) the normal ionospheric behaviour expected based on the median VTEC from the 15 previous days.
The time series below shows the VTEC difference (in green) and relative difference (in blue) with respect to the median of the last 15 days in the North, Mid (above Brussels) and South of Europe. It thus illustrates the VTEC deviation from normal quiet behaviour.
The VTEC is expressed in TECu (with TECu=10^16 electrons per square meter) and is directly related to the signal propagation delay due to the ionosphere (in figure: delay on GPS L1 frequency).
The Sun's radiation ionizes the Earth's upper atmosphere, the ionosphere, located from about 60km to 1000km above the Earth's surface.The ionization process in the ionosphere produces ions and free electrons. These electrons perturb the propagation of the GNSS (Global Navigation Satellite System) signals by inducing a so-called ionospheric delay.
See http://stce.be/newsletter/GNSS_final.pdf for some more explanations; for more information, see https://gnss.be/SpaceWeather
Lectures and courses
Courses and presentations with the Sun-Space-Earth system and Space Weather as the main theme. We provide occasions to get submerged in our world through educational, informative and instructive activities.
* Sep 27, STCE at the Wisenight Science festival in the Planetarium, Brussel, https://wisenight.eu/
* Sep 30 - Oct 3, STCE Space Weather Introductory Course, Brussels, Belgium - Registrations are open https://events.spacepole.be/event/204/
* Nov 25 - 27, STCE course: Space Weather impacts on ionospheric wave propagation, focus on GNSS and HF, Brussels, Belgium - Registrations are open, https://events.spacepole.be/event/206/
* Dec 5-6, STCE Course Space Weather impacts on aviation, Brussels, Belgium - Registrations are open, https://events.spacepole.be/event/205/
To register for a course or lecture, check the page of the STCE Space Weather Education Center: https://www.stce.be/SWEC
If you want your event in the STCE newsletter, contact us: stce_coordination at stce.be