- Table of Content
- 1.High sunspot n...
- 2.Review of spac...
- 3.Noticeable Sol...
- 4.International ...
- 5.PROBA2 Observa...
- 6.Geomagnetic Ob...
- 7.The SIDC Space...
- 8.Review of Iono...
- 9.Lectures and c...
2. Review of space weather
3. Noticeable Solar Events
4. International Sunspot Number by SILSO
5. PROBA2 Observations (15 Jul 2024 - 21 Jul 2024)
6. Geomagnetic Observations in Belgium
7. The SIDC Space Weather Briefing
8. Review of Ionospheric Activity
9. Lectures and courses
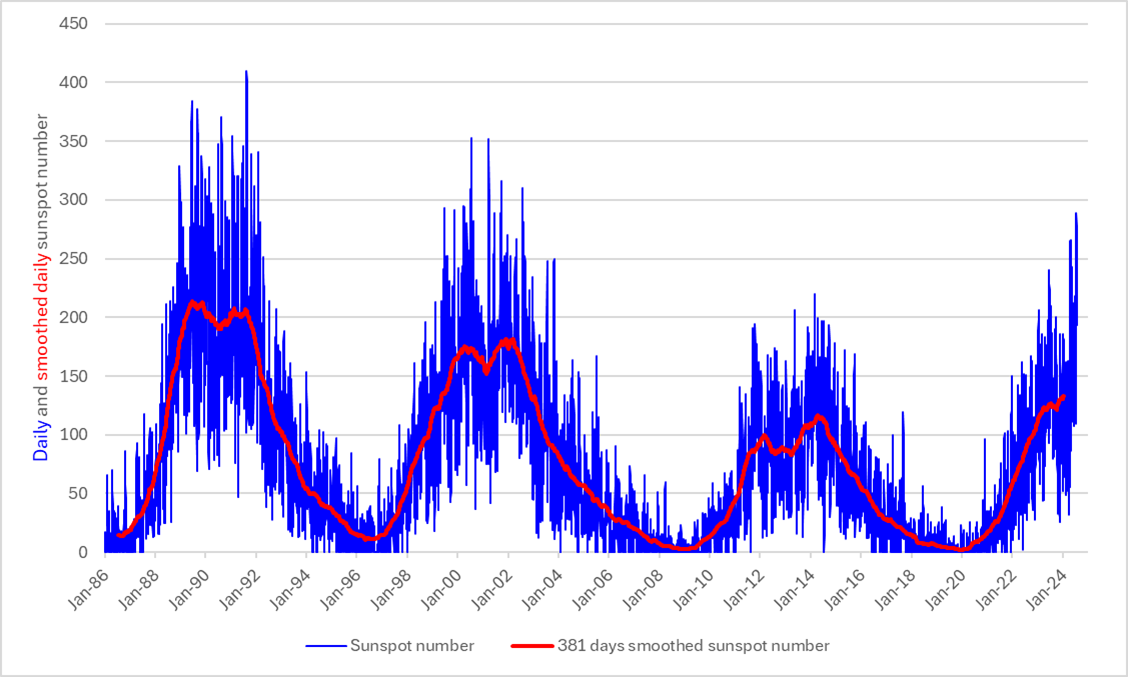
High sunspot numbers
Last week's sunspot numbers were the highest so far during solar cycle 25 (SC25). The preliminary sunspot number reached values around 285 from 16 till 18 July. We have to go back to July 2002 to find higher values, when sunspot numbers varied between 290 and 310 (SILSO - https://www.sidc.be/SILSO/home ). The graph underneath shows the daily and smoothed daily sunspot number from 1986 (SC22) onwards. The 381 days smoothed value is simply the average value of 381 days of sunspot numbers, with 381 days corresponding to 14 solar rotations or about 12.5 months, showing the overall evolution of the solar cycle. Of note is the very low sunspot activity during the previous SC24, when sunspot numbers exceeded the 200-level on only a handful of days. The graph makes it also clear that sunspot numbers can reach much higher values, such as e.g. on 21 and 22 August 1991 when the sunspot number Sn was above 400. Since the start of the daily archiving by SILSO (1818 - present), the highest sunspot numbers recorded were in August 1870 (528 on the 26th) and in December 1957 (503 on 24-25th). In more than 200 years of near-continuous observations, only 5 days had a sunspot number in excess of 500. So far, the highest daily sunspot number during the 21st century was on 27 March 2001 (352).
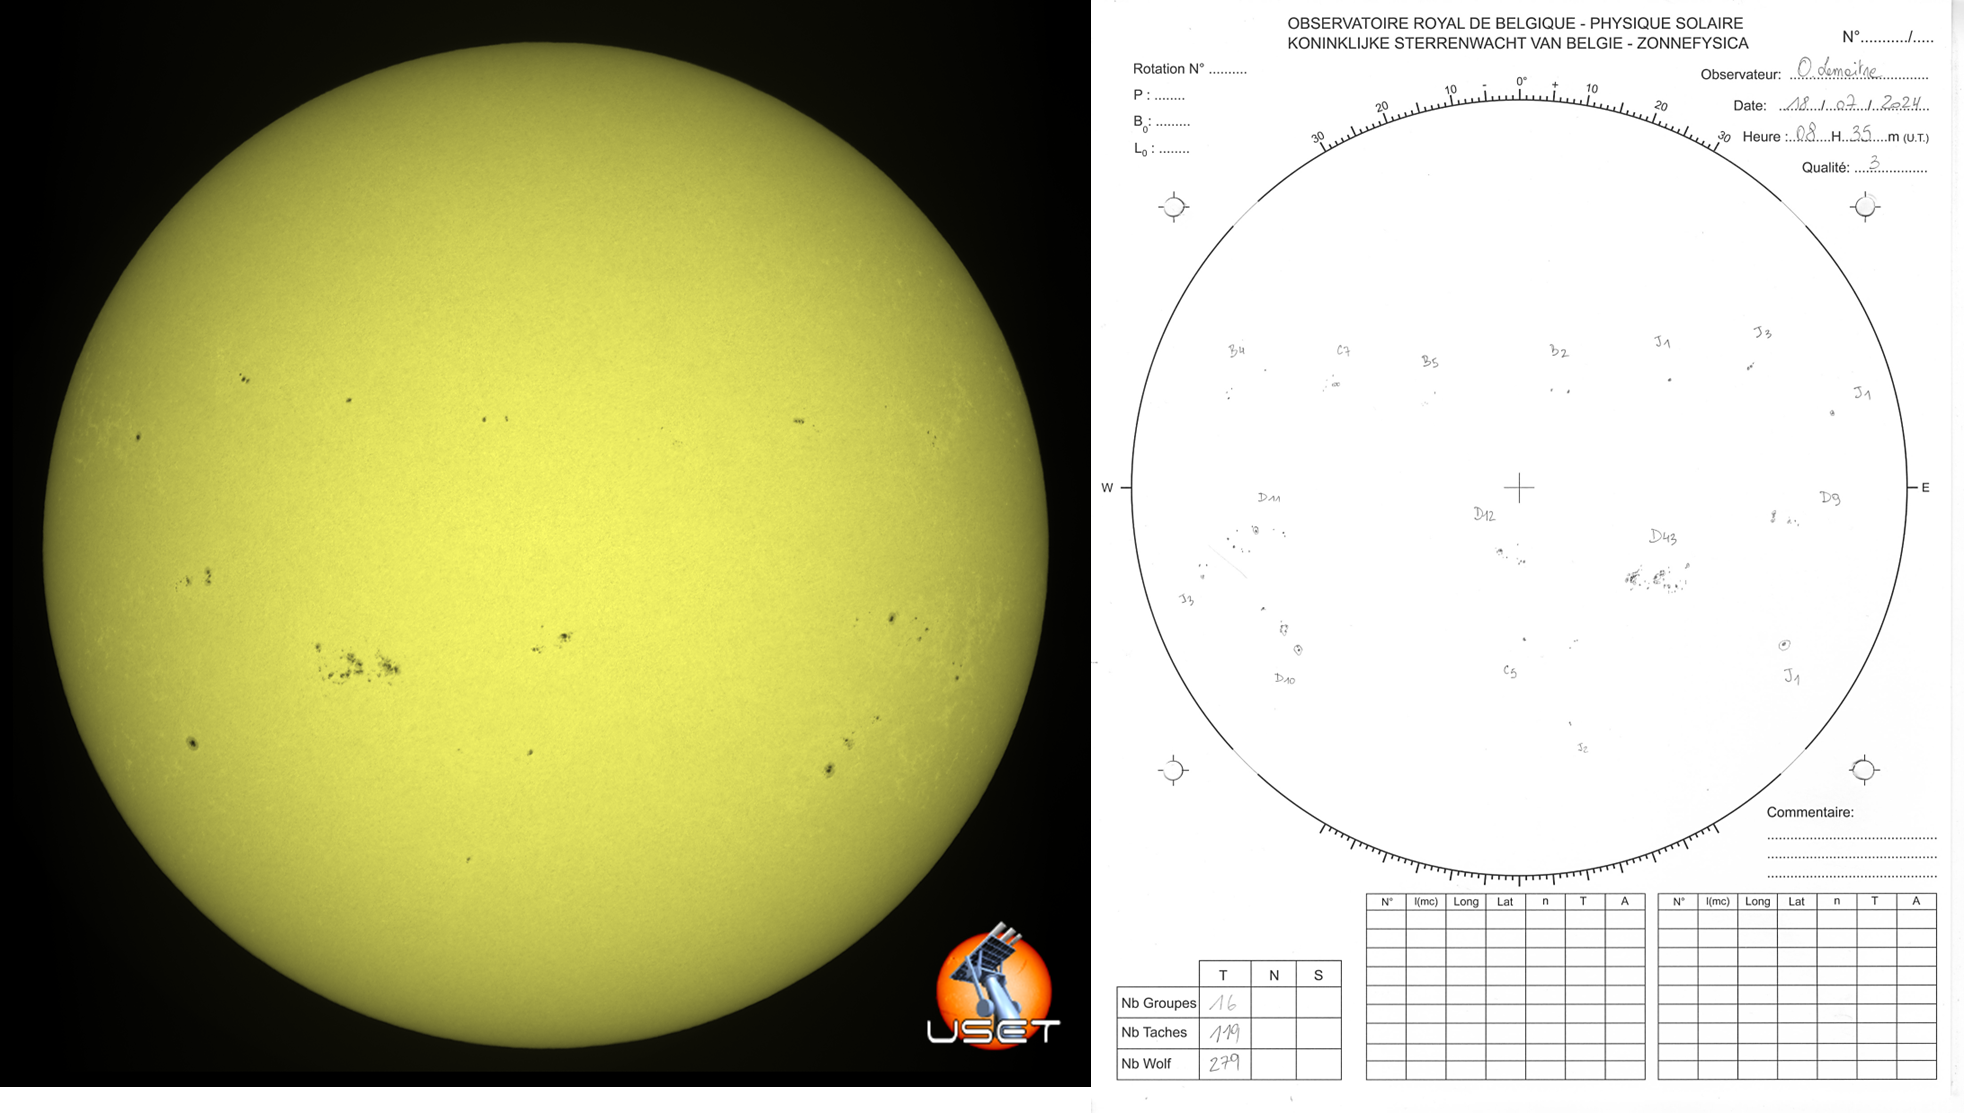
The mostly sunny weather in Belgium during July allowed the solar observers of the SIDC (https://www.sidc.be/ ) to monitor the Sun almost every day with their solar telescopes (USET , Uccle Solar Equatorial Table - https://www.sidc.be/uset/ ). Underneath are an image and a drawing (side reversed) made by the SIDC observers on 18 July, when the preliminary Sn was at its highest (289). The image and the drawing reveal 16 sunspot groups, and the observer penciled 119 dark spots, good for a total sunspot number of 279 (= 10x16 + 119). It's a coincidence that the USET sunspot number and the preliminary Sn correspond so well for this day, as Sn is of course an average of several observers (31 for that day) who use different telescopes and different observing methods rescaled to the reference observer (Sn version 2.0: https://www.sidc.be/SILSO/newdataset ).
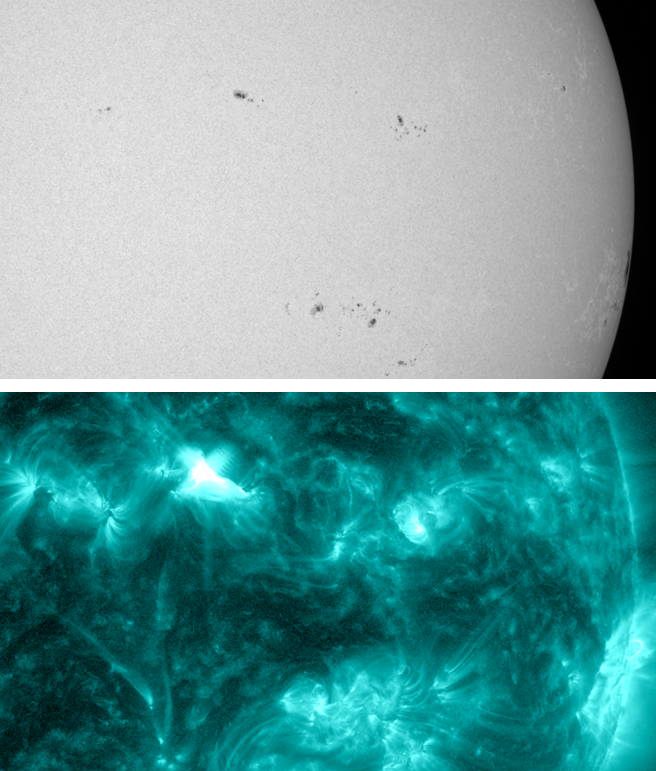
Nearly 2 dozen of M-class flares were produced during last week, mostly by the larger and more complex sunspot regions such as NOAA 3738 (4 M- and 1 X-class flare - https://www.stce.be/news/714/welcome.html) and 3751 (5). Despite the relatively small size of some of the sunspot groups, they were also contributing to the M-class flaring activity. The image (SDO - http://sdo.gsfc.nasa.gov/data/aiahmi/ ) underneath shows small active region NOAA 3744 in white light at the time (22:06UTC on 16 July) that an M1.9 flare took place in this region (extreme ultraviolet). NOAA 3744 and NOAA 3753 -another small region- produced 5 M-class flares each.
Review of space weather
Solar Active Regions (ARs) and flares
Last week's solar flaring activity was at moderate levels except on 16 July when high levels were registered. The only X-class flare of the week was an X1.9 on 16 July at 13:26 UTC associated with NOAA AR 3738 (magnetic type Beta-Gamma-Delta, Catania sunspot group 85). The strongest M-class flare of the week, an M5.0, was produced by NOAA AR 3743 on 17 July at 06:39 UTC. NOAA AR 3744 (magnetic type Beta, Catania sunspot group 96) was the source of five M-class flares, the first being an M1.4 on 16 July at 03:01 UTC and the last an M3.2 on 21 July at 23:28 UTC. M-class flares were also emitted by NOAA AR 3751 (magnetic type Beta until 18 July, Beta-Gamma-Delta since, Catania sunspot group 12), NOAA AR 3753 (magnetic type Beta, Catania sunspot group 8), NOAA AR 3757 (magnetic type Beta, Catania sunspot group 20), and NOAA AR 3758 (magnetic type Beta, Catania sunspot group 93).
Coronal mass ejections
No earth-directed, halo or partial halo, coronal mass ejections (CME) were observed during the period.
Coronal holes
A northern coronal hole (CH) with negative polarity crossed the central meridian between 15 and 18 July.
Proton flux levels
The greater than 10 MeV proton flux was at nominal levels over the last week.
Electron fluxes at GEO
The greater than 2 MeV electron flux, as measured by the GOES-16 satellite, was at nominal levels during the last week. The 24h electron fluence was at very low levels throughout last week.
Solar wind at L1
During the last week, the solar wind (SW) conditions were typical of the slow SW regime, with the exception of a glancing blow from a coronal mass ejection (CME) that lasted from 16 to 17 July. For the 15 July, the SW speed was between 270 and 330 km/s, the total interplanetary magnetic field (Bt) ranged between 1 and 10 nT, the North-South magnetic component (Bz) fluctuated between -5 and 6 nT, while the interplanetary magnetic field (IMF) phi angle was directed away and towards the Sun for an almost equal length of time. The disturbance caused an increase of SW speed to 420 km/s, a rise of Bt to 18 nT, a variation of Bz between -10 and 13 nT, and the IMF phi angle to be predominantly directed away from the Sun. The SW conditions returned to the slow SW regime on 18 July. The Bt ranged between 1 and 7 nT, Bz between -5 and 6 nT, and the IMF phi angle was predominantly directed away from the Sun for the rest of the period.
Geomagnetism
Global geomagnetic conditions were quiet (NOAA Kp 1- to 2+) last week with the exception of 16 July when unsettled levels (NOAA Kp 3+) were recorded. This was the result of the arrival of a glancing blow associated with a CME. The local geomagnetic conditions started last week at unsettled levels (K BEL 3) and increased to active levels (K BEL 4) as a result of the glancing blow on 16 July. They returned to active levels (K BEL 3) for the rest of the week.
Noticeable Solar Events
| DAY | BEGIN | MAX | END | LOC | XRAY | OP | 10CM | TYPE | Cat | NOAA |
| 15 | 0329 | 0345 | 0355 | M1.2 | F | 85 | 3738 | |||
| 15 | 0921 | 0937 | 1008 | S7W66 | M2.7 | SN | III/1VI/1 | 85 | 3738 | |
| 15 | 1008 | 1013 | 1019 | S8W64 | M1.9 | SF | 85 | 3738 | ||
| 16 | 0249 | 0301 | 0322 | N16E2 | M1.4 | 1N | 96 | 3744 | ||
| 16 | 0724 | 0737 | 0750 | N11W27 | M3.6 | 1B | III/1 | 8 | 3753 | |
| 16 | 1311 | 1326 | 1336 | S6W85 | X1.9 | 1B | III/1II/3IV/2 | 85 | 3738 | |
| 16 | 2106 | 2124 | 2136 | N11W34 | M1.6 | 1N | 8 | 3753 | ||
| 16 | 2146 | 2206 | 2217 | N18W10 | M1.9 | 1N | III/2II/2 | 96 | 3744 | |
| 17 | 0626 | 0639 | 0701 | S10W31 | M5.0 | 2B | III/1II/1 | 93 | 3743 | |
| 17 | 0701 | 0708 | 0713 | N9W39 | M3.4 | SF | VI/2II/1IV/1 | 93 | 3743 | |
| 17 | 0926 | 0945 | 1010 | S10W83 | M1.2 | SF | 3738 | |||
| 17 | 1940 | 1951 | 1953 | N11W46 | M1.2 | 1N | 8 | 3753 | ||
| 17 | 1953 | 1958 | 2004 | M2.0 | 8 | 3753 | ||||
| 18 | 1004 | 1014 | 1020 | S7E24 | M2.2 | SN | 12 | 3751 | ||
| 18 | 1020 | 1027 | 1031 | M2.0 | 12 | 3751 | ||||
| 19 | 0813 | 0823 | 0830 | N11W67 | M3.2 | 1F | III/1 | 8 | 3753 | |
| 19 | 1753 | 1806 | 1825 | S10E3 | M2.0 | 2N | 12 | 3751 | ||
| 19 | 2244 | 2251 | 2306 | M1.0 | 93 | 3758 | ||||
| 20 | 0710 | 0720 | 0724 | S7W3 | M1.8 | SF | 12 | 3751 | ||
| 20 | 1836 | 1849 | 1902 | N12W68 | M1.5 | 1N | VI/1 | 96 | 3744 | |
| 21 | 0346 | 0355 | 0359 | M1.4 | VI/2 | 96 | 3744 | |||
| 21 | 0828 | 0834 | 0841 | M1.5 | 12 | 3751 | ||||
| 21 | 1618 | 1631 | 1659 | M1.0 | III/2II/2 | 20 | 3757 | |||
| 21 | 2321 | 2328 | 2334 | N15W86 | M3.2 | SF | 96 | 3744 |
| LOC: approximate heliographic location | TYPE: radio burst type |
| XRAY: X-ray flare class | Cat: Catania sunspot group number |
| OP: optical flare class | NOAA: NOAA active region number |
| 10CM: peak 10 cm radio flux |
International Sunspot Number by SILSO

The daily Estimated International Sunspot Number (EISN, red curve with shaded error) derived by a simplified method from real-time data from the worldwide SILSO network. It extends the official Sunspot Number from the full processing of the preceding month (green line), a few days more than one solar rotation. The horizontal blue line shows the current monthly average. The yellow dots give the number of stations that provided valid data. Valid data are used to calculate the EISN. The triangle gives the number of stations providing data. When a triangle and a yellow dot coincide, it means that all the data is used to calculate the EISN of that day.
PROBA2 Observations (15 Jul 2024 - 21 Jul 2024)
Solar Activity
Solar flare activity fluctuated from moderate to high during the week.
In order to view the activity of this week in more detail, we suggest to go to the following website from which all the daily (normal and difference) movies can be accessed: https://proba2.oma.be/ssa
This page also lists the recorded flaring events.
A weekly overview movie (SWAP week 747) can be found here: https://proba2.sidc.be/swap/data/mpg/movies/weekly_movies/weekly_movie_2024_07_15.mp4.
Details about some of this week's events can be found further below.
If any of the linked movies are unavailable they can be found in the P2SC movie repository here: https://proba2.oma.be/swap/data/mpg/movies/.
Tuesday July 16
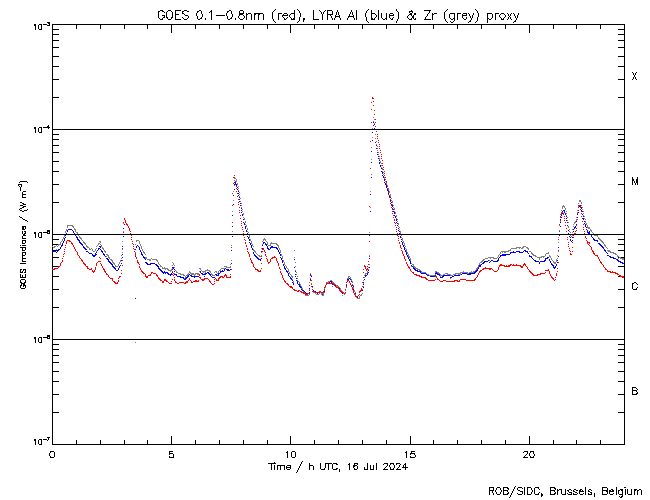
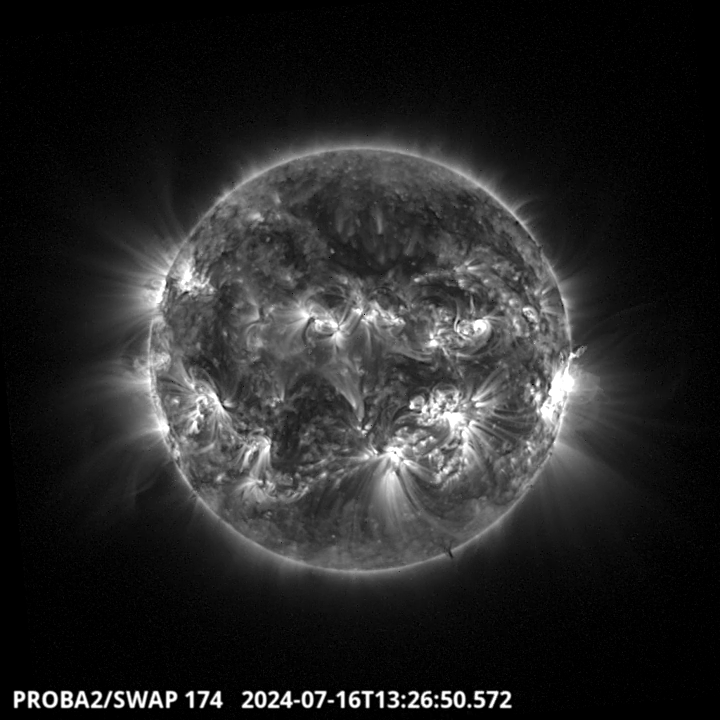
The largest flare of this week was an X1.9, and it was observed by LYRA (top panel) and SWAP (bottom panel). The flare peaked on 2024-Jul-16 at 13:26 UT. It occurred at the western limb of the Sun close to the equator, originating from NOAA AR3738.
Find a SWAP movie of the event here: https://proba2.sidc.be/swap/movies/20240716_swap_movie.mp4.
Geomagnetic Observations in Belgium

Local K-type magnetic activity index for Belgium based on data from Dourbes (DOU) and Manhay (MAB). Comparing the data from both measurement stations allows to reliably remove outliers from the magnetic data. At the same time the operational service availability is improved: whenever data from one observatory is not available, the single-station index obtained from the other can be used as a fallback system.
Both the two-station index and the single station indices are available here: http://ionosphere.meteo.be/geomagnetism/K_BEL/
The SIDC Space Weather Briefing
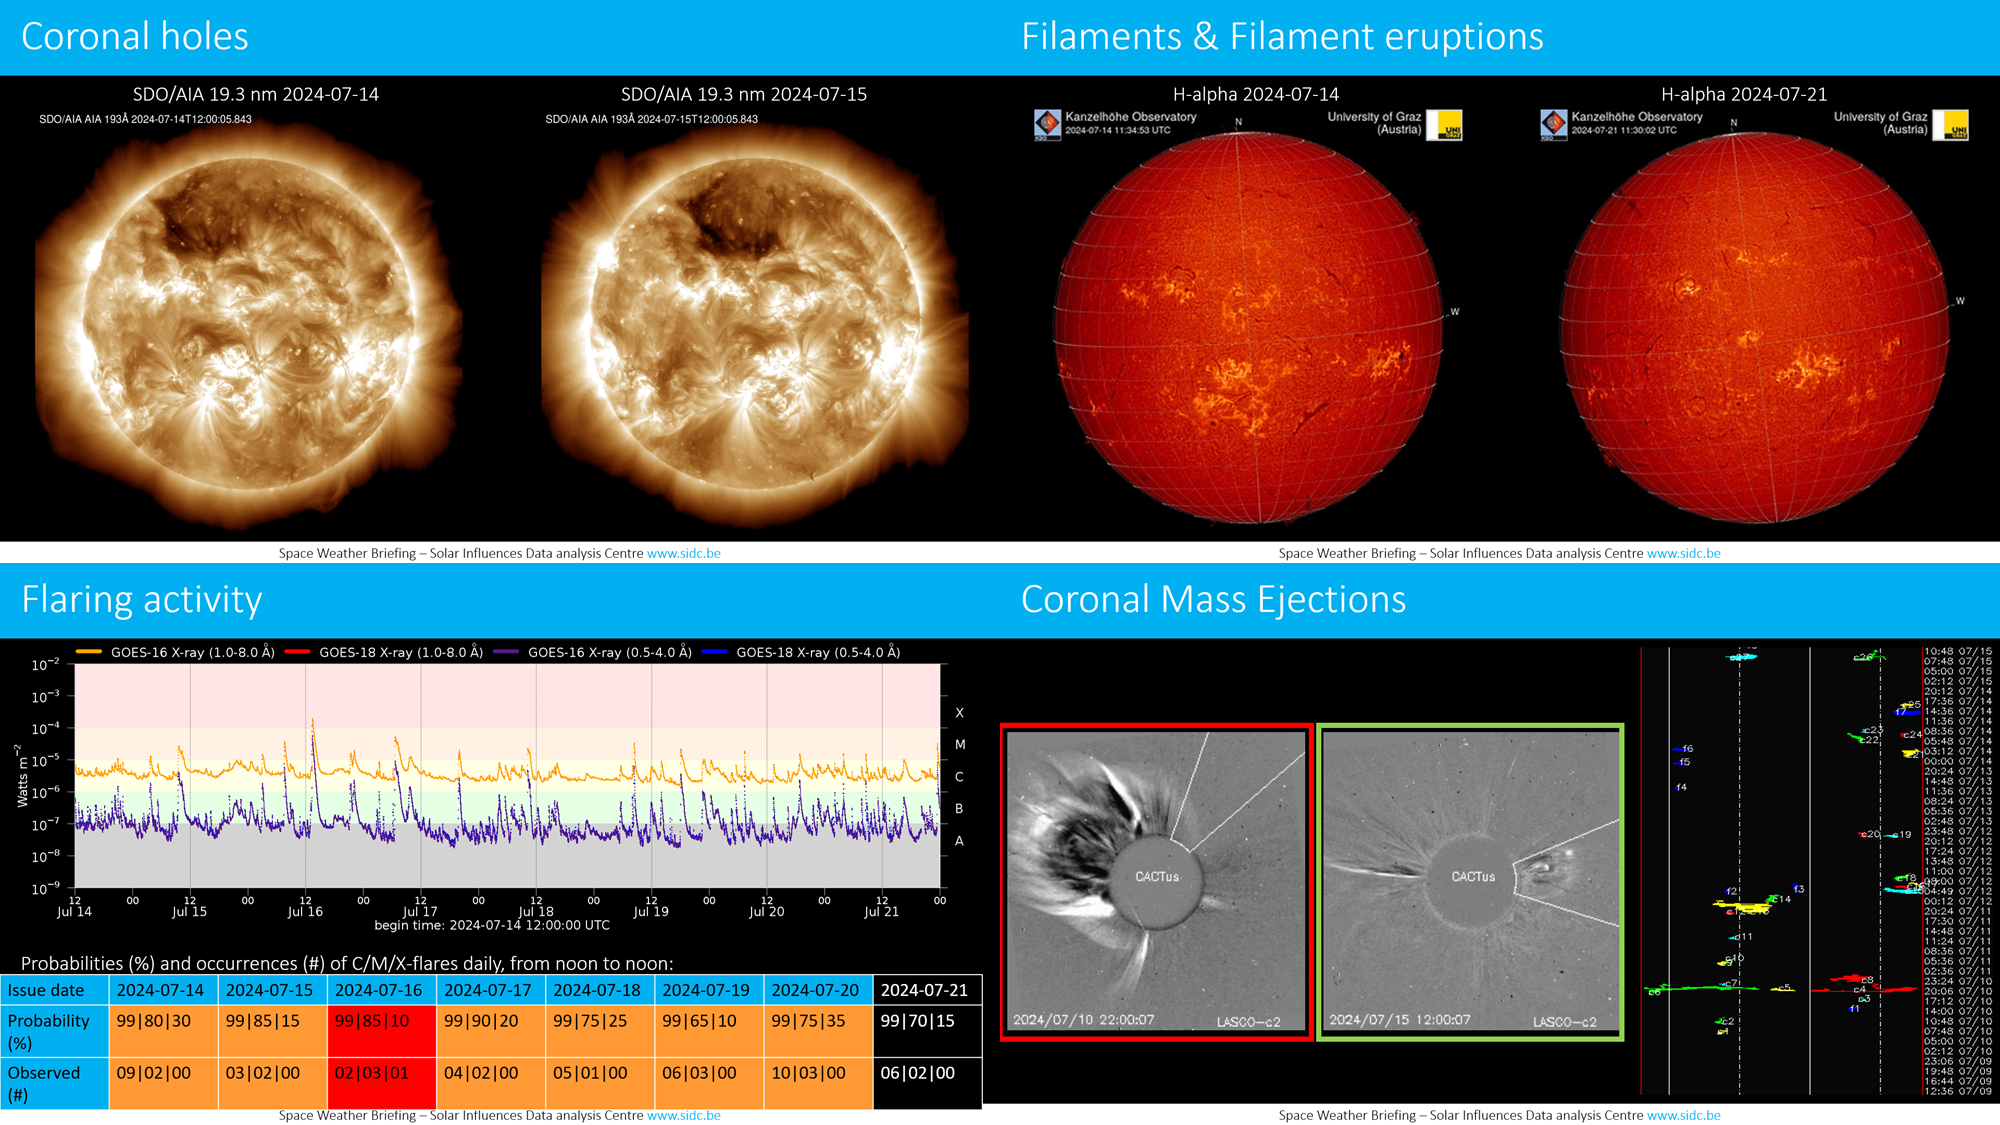
The forecaster on duty presented the SIDC briefing that gives an overview of space weather from July 14 to July 21.
The pdf of the presentation can be found here: https://www.stce.be/briefings/20240722_SWbriefing.pdf
Review of Ionospheric Activity


VTEC time series at 3 locations in Europe from 15 Jul 2024 till 21 Jul 2024
The top figure shows the time evolution of the Vertical Total Electron Content (VTEC) (in red) during the last week at three locations:
a) in the northern part of Europe(N 61deg E 5deg)
b) above Brussels(N 50.5deg, E 4.5 deg)
c) in the southern part of Europe(N 36 deg, E 5deg)
This top figure also shows (in grey) the normal ionospheric behaviour expected based on the median VTEC from the 15 previous days.
The time series below shows the VTEC difference (in green) and relative difference (in blue) with respect to the median of the last 15 days in the North, Mid (above Brussels) and South of Europe. It thus illustrates the VTEC deviation from normal quiet behaviour.
The VTEC is expressed in TECu (with TECu=10^16 electrons per square meter) and is directly related to the signal propagation delay due to the ionosphere (in figure: delay on GPS L1 frequency).
The Sun's radiation ionizes the Earth's upper atmosphere, the ionosphere, located from about 60km to 1000km above the Earth's surface.The ionization process in the ionosphere produces ions and free electrons. These electrons perturb the propagation of the GNSS (Global Navigation Satellite System) signals by inducing a so-called ionospheric delay.
See http://stce.be/newsletter/GNSS_final.pdf for some more explanations; for more information, see https://gnss.be/SpaceWeather
Lectures and courses
Courses and presentations with the Sun-Space-Earth system and Space Weather as the main theme. We provide occasions to get submerged in our world through educational, informative and instructive activities.
* Sep 27, STCE at the Wisenight Science festival in the Planetarium, Brussel, https://wisenight.eu/
* Sep 30 - Oct 3, STCE Space Weather Introductory Course, Brussels, Belgium - Registrations are open https://events.spacepole.be/event/204/
* Nov 25 - 27, STCE course: Space Weather impacts on ionospheric wave propagation, focus on GNSS and HF, Brussels, Belgium - Registrations are open, https://events.spacepole.be/event/206/
* Dec 5-6, STCE Course Space Weather impacts on aviation, Brussels, Belgium - Registrations are open, https://events.spacepole.be/event/205/
To register for a course or lecture, check the page of the STCE Space Weather Education Center: https://www.stce.be/SWEC
If you want your event in the STCE newsletter, contact us: stce_coordination at stce.be