- Table of Content
- 1.Powerful erupt...
- 2.The best of......
- 3.Review of spac...
- 4.Noticeable Sol...
- 5.International ...
- 6.PROBA2 Observa...
- 7.Geomagnetic Ob...
- 8.The SIDC Space...
- 9.Review of Iono...
- 10.Lectures and c...
2. The best of... 2023!
3. Review of space weather
4. Noticeable Solar Events
5. International Sunspot Number by SILSO
6. PROBA2 Observations (22 Jul 2024 - 28 Jul 2024)
7. Geomagnetic Observations in Belgium
8. The SIDC Space Weather Briefing
9. Review of Ionospheric Activity
10. Lectures and courses
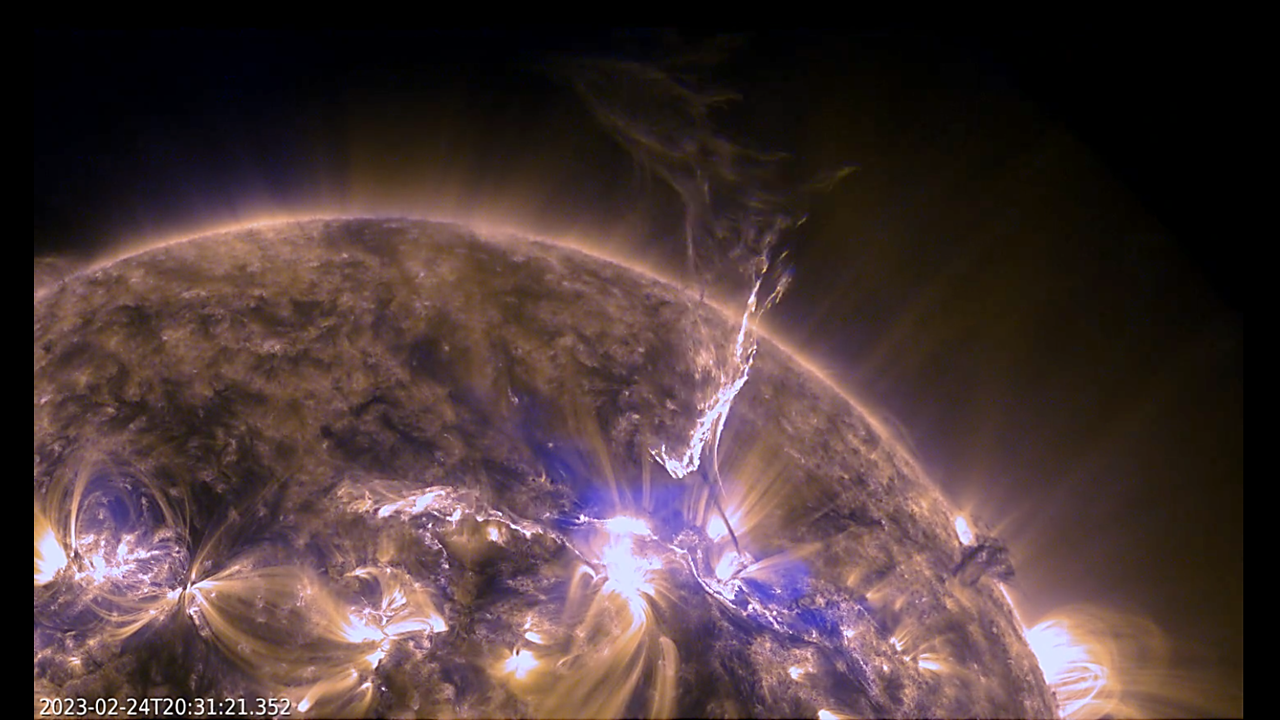
Powerful eruption on the Sun's farside
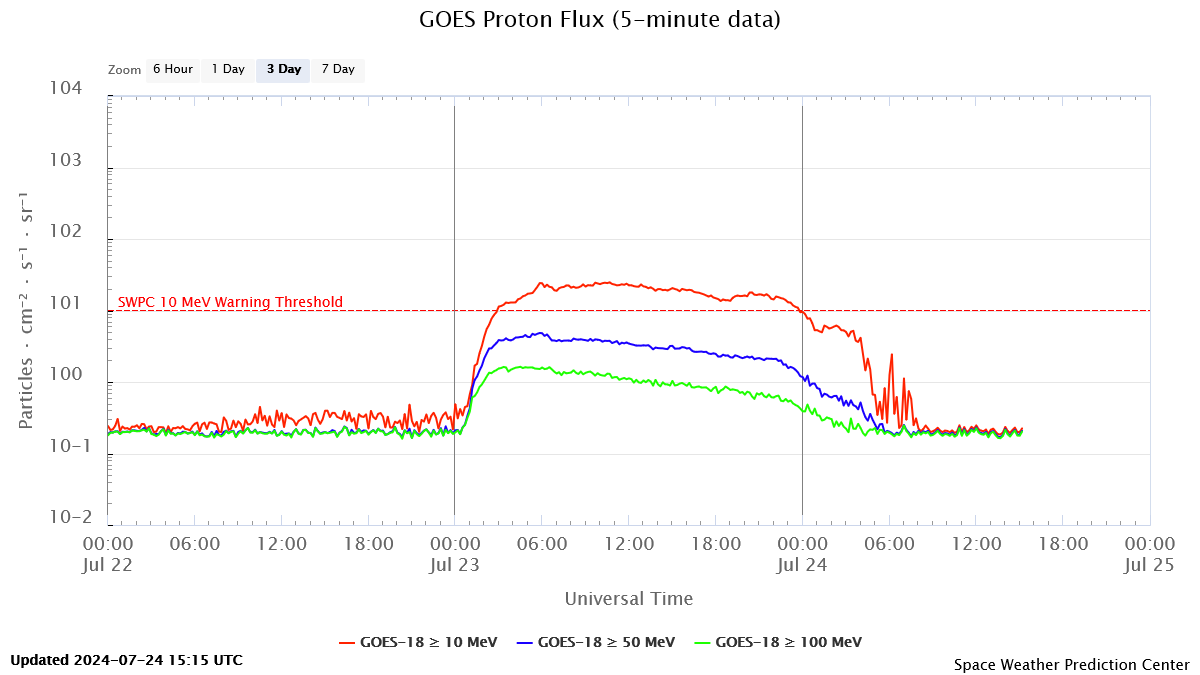
Early 23 July, space weather forecasters were surprized to see the proton flux (GOES - https://www.swpc.noaa.gov/products/goes-proton-flux ) going up, as there was no particularly strong solar flare or filament eruption observed on the Earth's facing solar hemisphere (GOES). The fluxes of the more energetic protons followed suit. The greater than 10 MeV proton flux exceeded the event threshold of 10 MeV at 03:00UTC, and reached a maximum of 24 pfu at 10:40UTC. The greater than 100 MeV proton flux exceeded the 1 pfu threshold at 02:00UTC, and reached a maximum of 1.6 pfu. As a result, no effect from these particles on the Earth's surface have been observed (no Ground Level Enhancement - https://www.stce.be/content/sc25-tracking#gle ).
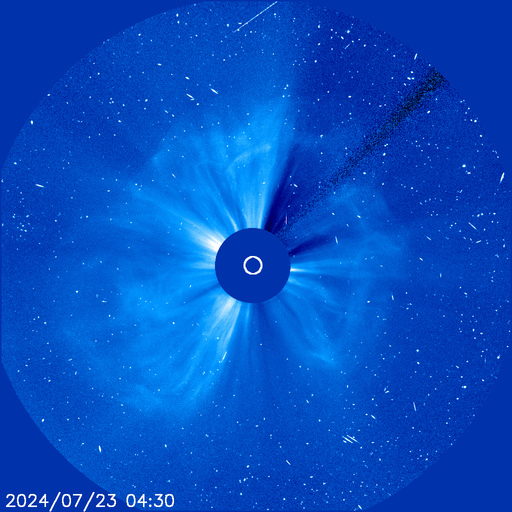
At 00:24UTC, a halo coronal mass ejection (CME) became visible in coronagraphic imagery by SOHO/LASCO C2 (https://soho.nascom.nasa.gov/data/realtime-images.html ). CACTus (https://www.sidc.be/cactus/ ) revealed a projected (plane-of-the-sky) speed around 600 km/s. LASCO images showed noise from the energetic protons impacting the camera's pixels (LASCO C3 image underneath). No important radio bursts were observed with this event (OVSA - http://www.ovsa.njit.edu/status.php# , Learmonth - http://www.sws.bom.gov.au/Solar/3/2/1 ).
So all this was indicative that the event had taken place on the farside of the Sun. But how intense was it? Once again, Solar Orbiter came to the rescue. As it happens, this spacecraft is currently observing the Sun's farside, being separated by 159 degrees from the Earth. The map underneath shows the positions of Solar Orbiter (pink) STEREO-A (red), STEREO-B (blue) relative to Earth (green) on 23 July.
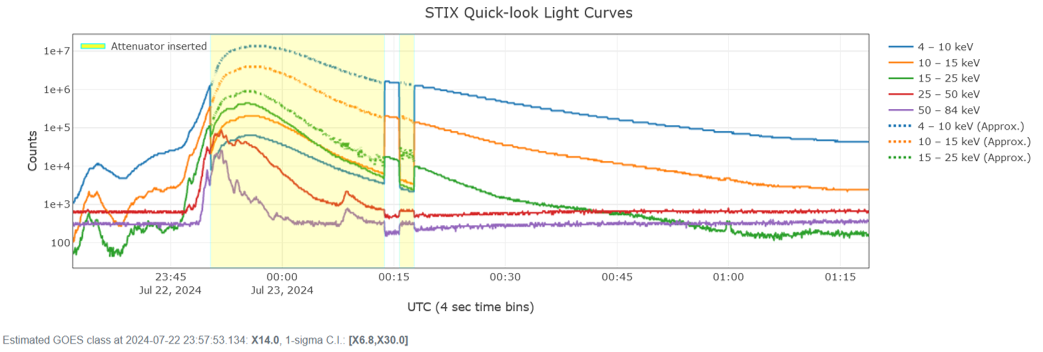
Its Spectrometer Telescope for Imaging X-rays (STIX - https://datacenter.stix.i4ds.net/view/flares/list ) is a hard X-ray (HXR) imaging spectrometer (see the STCE newsitem at https://www.stce.be/news/712/welcome.html for a brief description), and recorded a strong flare on 22 July at 23:56UTC. Though STIX' HXR measurements can of course not directly be compared to the GOES' soft x-ray (SXR) recordings, given enough statistics the STIX readings can be correlated and used to provide an estimated value of the GOES SXR intensity. Thus, based on the STIX observations shown underneath (STIX data Center - https://datacenter.stix.i4ds.net/view/flares/list ), the eruption reached an estimated GOES SXR intensity between X6.8 and X30, with X14 the most likely value. This is slightly stronger than the 20 May event (X12, also on the farside), and would make it the strongest solar flare so far this solar cycle (SC25), far and front side combined.
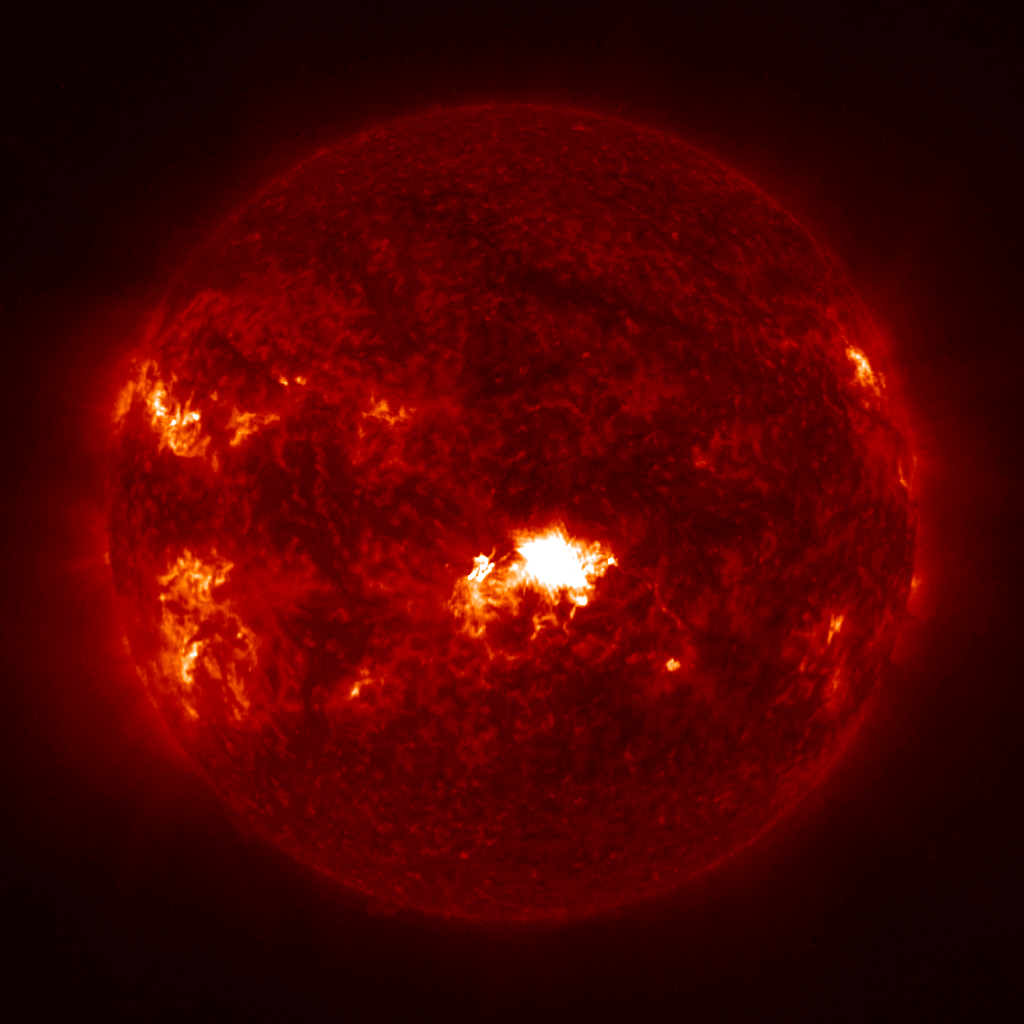
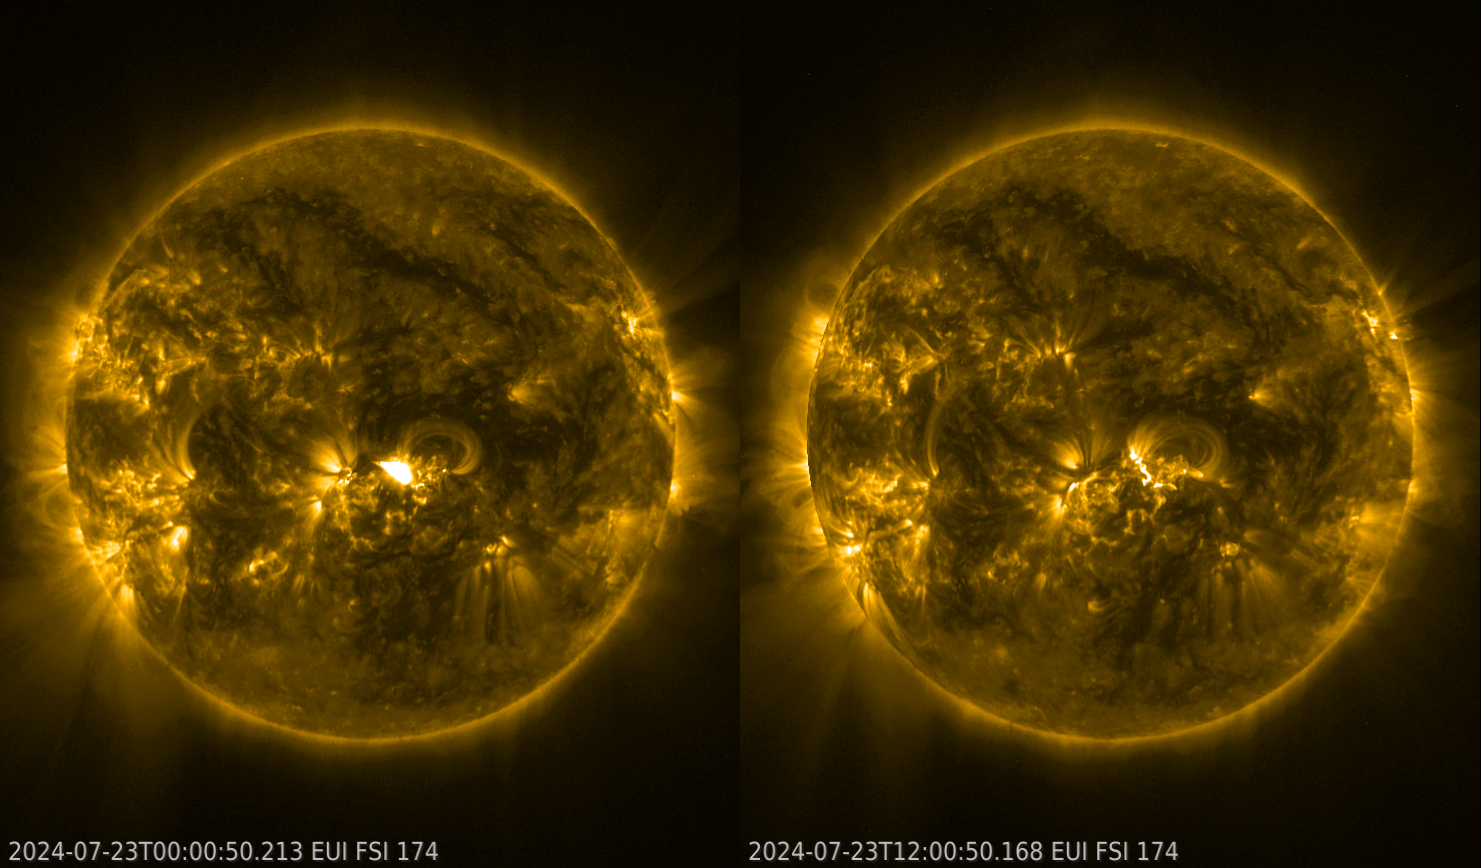
Thus remained the question of where exactly the eruption had occurred. Enter Solar Orbiter's Full Sun Imager (FSI), which is part of the EUI instrument (Extreme Ultraviolet Imager - https://www.sidc.be/EUI/intro ). Only 2 images in each wavelength -30.4 nm (temperature around 80.000 degrees) and 17.4 nm (around 1 million degrees)- were available at that time, of which one was around midnight. That was sufficient to pinpoint the location of the eruption near the Sun's disk centre as seen by Solar Orbiter. The images underneath show the Sun in extreme ultraviolet (EUV): once by FSI 304 near 00:00 UTC - which is at the time of the eruption-, and a comparison in FSI 174 at 00:00UTC and at 12:00UTC showing the evolution of the flare. Back-tracing based on the observed position reveals that the source region is NOAA 3738, which was already the source of 2 X-class flare on 14 and 16 July (https://www.stce.be/news/714/welcome.html ).
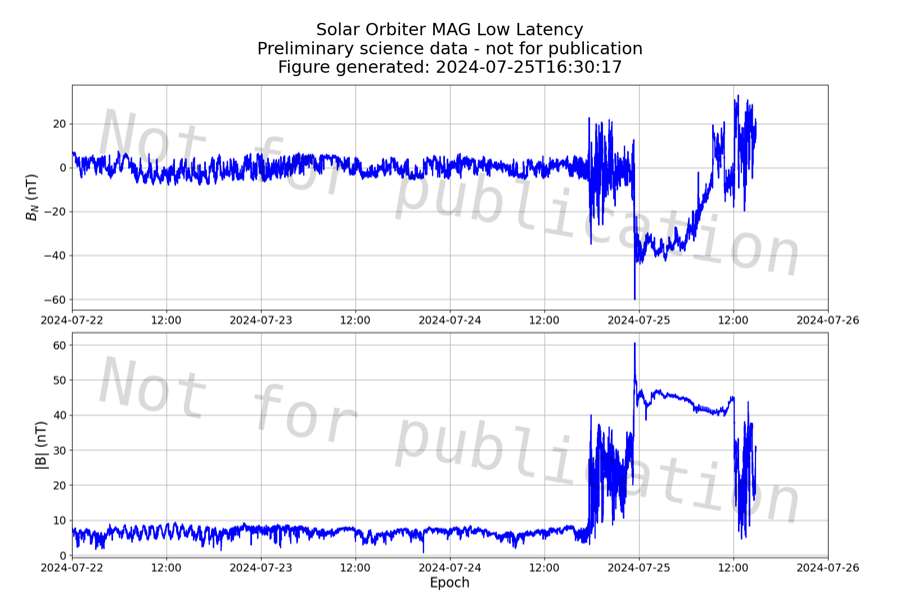
From the observed direction of the halo CME (away from the Earth), it was clear that Solar Orbiter was square in the middle of the CME's path. The interplanetary CME (ICME) arrived at Solar Orbiter around 18UTC on 24 July. This means that it took the CME about 42 hours to bridge the Sun-Solar Orbiter distance (0.9 times the average Sun-Earth distance, or about 135 million km). SolO's MAG instrument (https://www.imperial.ac.uk/space-and-atmospheric-physics/research/missions-and-projects/space-missions/solar-orbiter/updates/ ) showed that after the shock and sheath passage, the core of the ICME arrived shortly before 24:00UTC. The plot below -please note that these MAG data are low latency data and not fully calibrated, so artefacts can remain and it is not suitable for science use- shows the evolution of the North-South component of the magnetic field ("Bz", here shown as "BN" ; top panel), and the total intensity of the magnetic field B ("Bt" , lower panel). There is a nice gradual transition from southward pointing magnetic field (negative Bz) towards northward pointing magnetic field (positive Bz). A value of -60 nT was briefly registered for Bz at the beginning of the ICME passage, but Bz was mostly between -30 nT and -40 nT during the next 6 hours. Bt remained at a very strong 45 nT throughout the entire first half of 25 July. If this ICME would have hit the earth environment, we would almost certainly have experienced an extremely severe geomagnetic storm, quite close in intensity to the recent 10-11 May storm (https://www.stce.be/news/701/welcome.html ) when Bz reached -50 nT.
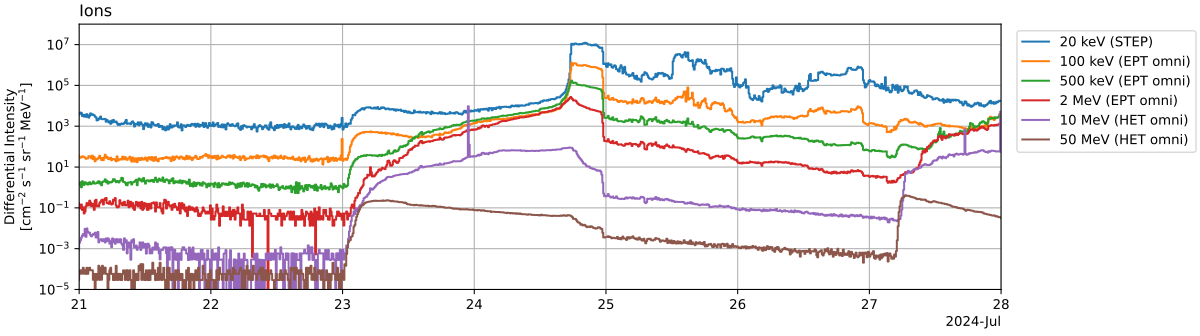
Of note is that the passage of the ICME was also recorded by SolO's EPD instrument (Energetic Particle Detector - https://espada.uah.es/epd/data/plots/quicklook ), which shows a 100-fold enhancement of the low-energy particle flux upon arrival of the ICME's shock. This is called a Energetic Storm Particles event (ESP), with another example discussed in this STCE newsitem (https://www.stce.be/news/642/welcome.html ).
The best of... 2023!
A compilation of the most memorable space weather moments of 2023 can be found at the STCE's dedicated solar cycle highlights webpage: http://www.stce.be/highlights Using the versatile Space Weather JHelioviewer (SWHV : http://swhv.oma.be/user_manual/ ) software, a ***MOVIE*** was created containing one or more clips of each event.
Usually, images from SDO, GOES, STEREO, and SOHO have been used, occasionally supplemented with imagery from Solar Orbiter, PROBA2, ROB/USET and the GONG/H-alpha network.
The movie can be found on YouTube https://www.youtube.com/watch?v=6k5fSWGQZN4, whereas the page with the accompanying information is at https://www.stce.be/news/718/welcome.html
We wish you a happy viewing!
Review of space weather
Solar Active Regions (ARs) and flares
Solar flaring activity was at high levels on July 22, 27, and 28, and at moderate levels for the rest of the week. There were 20 numbered active regions on the visible solar disk throughout the past week, which produced more than 70 C-class flares and 28 M-class flares. M-class flares were produced by NOAA active region (AR) 3744, NOAA AR 3751, NOAA AR 3757, NOAA AR 3761, NOAA AR 3762, NOAA AR 3766, NOAA AR 3767, and NOAA AR 3768. The strongest flare was GOES M9.9 flare from NOAA AR 3766 which peaked at 01:57 UTC on July 28. During the flare, the source region (AR 3766) of the flare had beta configuration of its photospheric magnetic field. NOAA AR 3751 and NOAA AR 3762 were the most complex regions (beta-gamma-delta magnetic field configuration) on the disk throughout the week.
Coronal mass ejections
Several halo and partial halo coronal mass ejections (CMEs) were observed in SOHO/LASCO-C2 coronagraph images over the past week, originating from both the visible disk and farside of the Sun.
- A halo CME was first observed in the SOHO/LASCO C2 field of view around 16:28 UTC on July 21. This CME was associated with a M1.0 flare from NOAA AR 3757 (N15 E20) and an eruption of a very twisted filament with the main propagation direction towards the North. It had a projected speed of about 730 km/s, and was expected to impact the Earth around 05:00 UTC on July 24. This CME possibly arrived earlier at Earth around 19:50 UTC on July 23.
- A partial halo CME was observed in the C2 images around 14:24 UTC on July 23 which was associated with a M2.5 flare that peaked at 14:28 UTC on July 23, produced by NOAA AR 3765 (S11 E88). Associated type II radio emissions were detected at 14:11 UTC during the flaring activity. It had a projected speed of about 800 km/s. This CME was directed mostly towards the East and it did not impact the Earth.
- A CME was observed in the C2 images around 17:30 UTC on July 24 which was associated with a M2.9 flare that peaked at 17:21 UTC on July 24, produced by NOAA AR 3751 (S07 W71). Associated type II radio emissions were detected at 17:26 UTC during the flaring activity. It had an angular width of about 50 degrees. This CME was followed by an another subsequent nearby CME which was observed in the C2 images around 18:30 UTC on July 24. This second CME was associated with a C6.8 flare, which peaked at 18:26 UTC on Jul 24, produced by NOAA AR 3759 (S07 W89). Associated type II radio emissions were detected at 18:26 UTC during these flaring activities. The second CME had an angular width of about 80 degrees and a projected speed of about 500 km/s. These two CMEs were strongly directed towards the West and did not arrive at Earth.
- A halo CME was first observed in the C2 images around 06:30 UTC on July 27 which was possibly associated with a M3.1 flare that peaked at 05:46 UTC on July 27, produced by NOAA AR 3762 (S11 W25). Possibly associated type IV radio emissions were detected at 06:43 UTC on July 27. It had a projected speed of about 450 km/s.
- A halo CME was first observed in the C2 images around 02:24 UTC on July 28. This CME was associated with the two subsequent M-class flares from NOAA AR 3766 (S07 E10) and the EUV wave. The first M7.8 flare peaked at 01:51 UTC and the second M9.9 flare peaked at 01:57 UTC on July 28. Associated type II radio emissions were detected at 01:51 UTC on July 28, during the flaring activities. It had a projected speed of about 470 km/s.
Coronal holes
A very small positive polarity coronal hole around 20N crossed the central meridian on July 23, and the possibly associated high speed stream started to enhance the solar wind parameters near Earth on July 26.
Proton flux levels
The greater than 10 MeV GOES proton flux was below the 10 pfu threshold level at the beginning of the past week. It showed a small enhancement starting around 09:30 UTC on July 22, possibly associated with flaring activities from NOAA AR 3744. It started to increase around 23:45 UTC on July 22, and was above the 10 pfu threshold level from 03:00 UTC to 23:50 UTC on July 23, possibly associated with the flaring activity and coronal mass ejection observed around 00:24 UTC on July 23 at the Sun's farside. There were enhancements in the greater than 50 MeV GOES proton flux and the greater than 100 MeV GOES proton flux too, but they remained below the threshold level. The greater than 10 MeV proton flux showed slight enhancements around 06:00 UTC and 07:00 UTC on July 24 (but it remained below the threshold level) which were possibly associated with the flaring activities from NOAA AR 3762 and NOAA AR 3751. It again showed enhancements from 21:00 UTC on July 24 to 07:00 UTC on July 25 which were possibly associated to the flaring activities and halo coronal mass ejection from NOAA AR 3762, but it still remained below the threshold level. For the remaining part of the week, it remained below the threshold level.
Electron fluxes at GEO
The greater than 2 MeV electron flux, as measured by the GOES-16 satellite, was below the threshold level over the past week. The 24h electron fluence was at low to normal level during the past week.
Solar wind at L1
At the beginning of the past week, Earth was within the slow solar wind regime with a speed of about 300 km/s and the interplanetary magnetic field was up to 10 nT. It came under the influence of an interplanetary coronal mass ejection (ICME) arrival on July 23, with a shock detected around 19:50 UTC. The interplanetary magnetic field jumped from 6 nT to 15 nT, the solar wind speed jumped from 260 km/s to 320 km/s, and the solar wind density increased from 0.5/cm3 to 7.1/cm3. This shock was possibly related to the CME that was observed on the evening of July 21. The North-South component (Bz) ranged between -1 and 12 nT, after the arrival of this ICME. Solar wind parameters were enhanced from July 25 to July 27, due to the influence of sector boundary crossing followed by a fast wind. The solar wind speed reached a maximum value of 610 km/s, Bz component reached down to -13 nT, and the interplanetary magnetic field reached up 20 nT. By the end of the week, the solar wind speed was about 390 km/s and the interplanetary magnetic field was around 5 nT.
Geomagnetism
Geomagnetic conditions were globally and locally at quiet to unsettled conditions (NOAA Kp and K BEL 1 to 3), at the beginning of the past week. Minor storm conditions (NOAA Kp 5-) were reached globally between 03:00 UTC and 06:00 UTC on July 26 due to the sector boundary crossing followed by a fast wind. Locally over Belgium, it reached active conditions (K BEL 4). Geomagnetic conditions were mostly at quiet to unsettled conditions for the remainder of the week.
Noticeable Solar Events
| DAY | BEGIN | MAX | END | LOC | XRAY | OP | 10CM | TYPE | Cat | NOAA |
| 22 | 0327 | 0333 | 0337 | S14E56 | M1.4 | SF | VI/1 | 26 | 3762 | |
| 22 | 0355 | 0404 | 0408 | S15E56 | M3.9 | SN | 26 | 3762 | ||
| 22 | 0414 | 0434 | 0443 | S12E54 | M1.9 | 1F | 26 | 3762 | ||
| 22 | 0931 | 0935 | 0940 | S13E45 | M1.4 | SF | II/2 | |||
| 22 | 1247 | 1300 | 1304 | M1.5 | VI/2III/2 | 3744 | ||||
| 23 | 1349 | 1428 | 1509 | S10E77 | M2.4 | SF | VI/2III/2II/2 | |||
| 24 | 0728 | 0742 | 0750 | S6W81 | M3.6 | 2B | III/3V/3VII/3VI/2IV/2II/2 | 12 | 3751 | |
| 24 | 1707 | 1721 | 1727 | S7W71 | M2.9 | 1F | III/3II/2 | 12 | 3751 | |
| 25 | 1527 | 1537 | 1543 | S9W81 | M1.3 | SF | V/3II/3 | 12 | 3751 | |
| 26 | 0430 | 0442 | 0451 | S7W73 | M1.7 | SF | CTM/1 | 25 | 3761 | |
| 27 | 0221 | 0237 | 0245 | S9E24 | M4.2 | 1N | VII/3 | 32 | 3766 | |
| 27 | 0512 | 0546 | 0619 | S11W30 | M3.1 | SF | VI/2CTM/2II/2 | 26 | 3762 | |
| 27 | 1016 | 1040 | 1106 | S9E40 | M2.0 | 1F | III/2 | 35 | 3767 | |
| 27 | 1750 | 1806 | 1817 | S5E17 | M2.7 | 2B | III/2 | 33 | 3765 | |
| 27 | 1824 | 1839 | 1851 | S9W30 | M3.4 | 1B | VI/2 | 26 | 3762 | |
| 28 | 0139 | 0151 | 0153 | M7.8 | 32 | 3766 | ||||
| 28 | 0153 | 0157 | 0201 | M9.9 | 32 | 3766 | ||||
| 28 | 0337 | 0348 | 0403 | S10W37 | M1.5 | SF | 26 | 3762 | ||
| 28 | 1027 | 1042 | 1054 | S11W40 | M7.7 | 1B | VI/2 | 26 | 3762 | |
| 28 | 1243 | 1250 | 1255 | S9E15 | M2.6 | SF | 32 | 3766 | ||
| 28 | 1808 | 1826 | 1840 | S13W30 | M1.3 | 1F | III/3 | 37 | 3768 | |
| 28 | 2025 | 2036 | 2049 | S10W47 | M1.9 | 1N | 26 | 3762 |
| LOC: approximate heliographic location | TYPE: radio burst type |
| XRAY: X-ray flare class | Cat: Catania sunspot group number |
| OP: optical flare class | NOAA: NOAA active region number |
| 10CM: peak 10 cm radio flux |
International Sunspot Number by SILSO
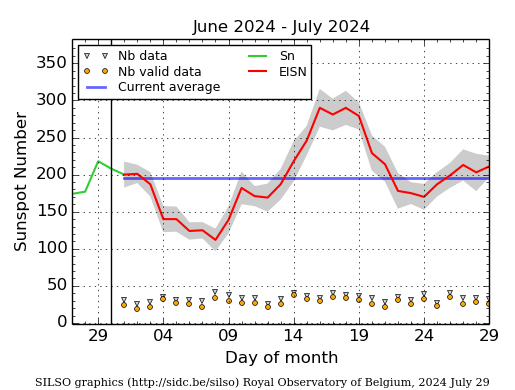
The daily Estimated International Sunspot Number (EISN, red curve with shaded error) derived by a simplified method from real-time data from the worldwide SILSO network. It extends the official Sunspot Number from the full processing of the preceding month (green line), a few days more than one solar rotation. The horizontal blue line shows the current monthly average. The yellow dots give the number of stations that provided valid data. Valid data are used to calculate the EISN. The triangle gives the number of stations providing data. When a triangle and a yellow dot coincide, it means that all the data is used to calculate the EISN of that day.
PROBA2 Observations (22 Jul 2024 - 28 Jul 2024)
Solar Activity
Solar flare activity was at a moderate level during the week.
In order to view the activity of this week in more detail, we suggest to go to the following website from which all the daily (normal and difference) movies can be accessed: https://proba2.oma.be/ssa
This page also lists the recorded flaring events.
A weekly overview movie (SWAP week 748) can be found here: https://proba2.sidc.be/swap/data/mpg/movies/weekly_movies/weekly_movie_2024_07_22.mp4.
Details about some of this week's events can be found further below.
If any of the linked movies are unavailable they can be found in the P2SC movie repository here: https://proba2.oma.be/swap/data/mpg/movies/.
Sunday July 28
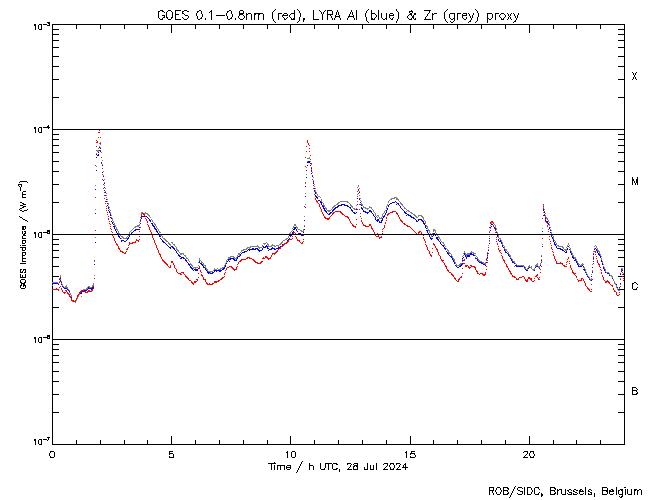
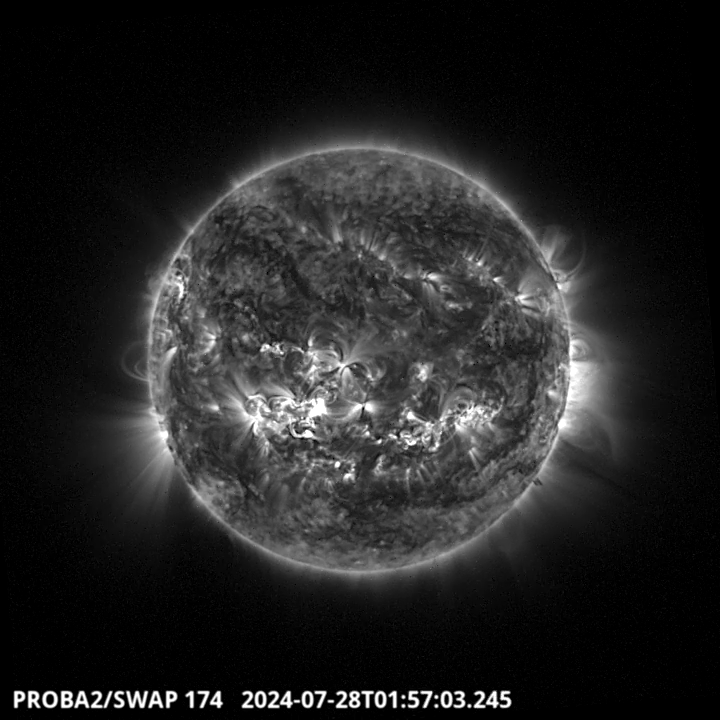
The largest flare of this week was an M9.9, and it was observed by LYRA (top panel) and SWAP (bottom panel). The flare peaked on 2024-Jul-28 at 01:57 UT. It occurred in the eastern hemisphere close to the equator, originating from NOAA AR3766.
Find a SWAP movie of the event here: https://proba2.sidc.be/swap/movies/20240728_swap_movie.mp4.
Geomagnetic Observations in Belgium
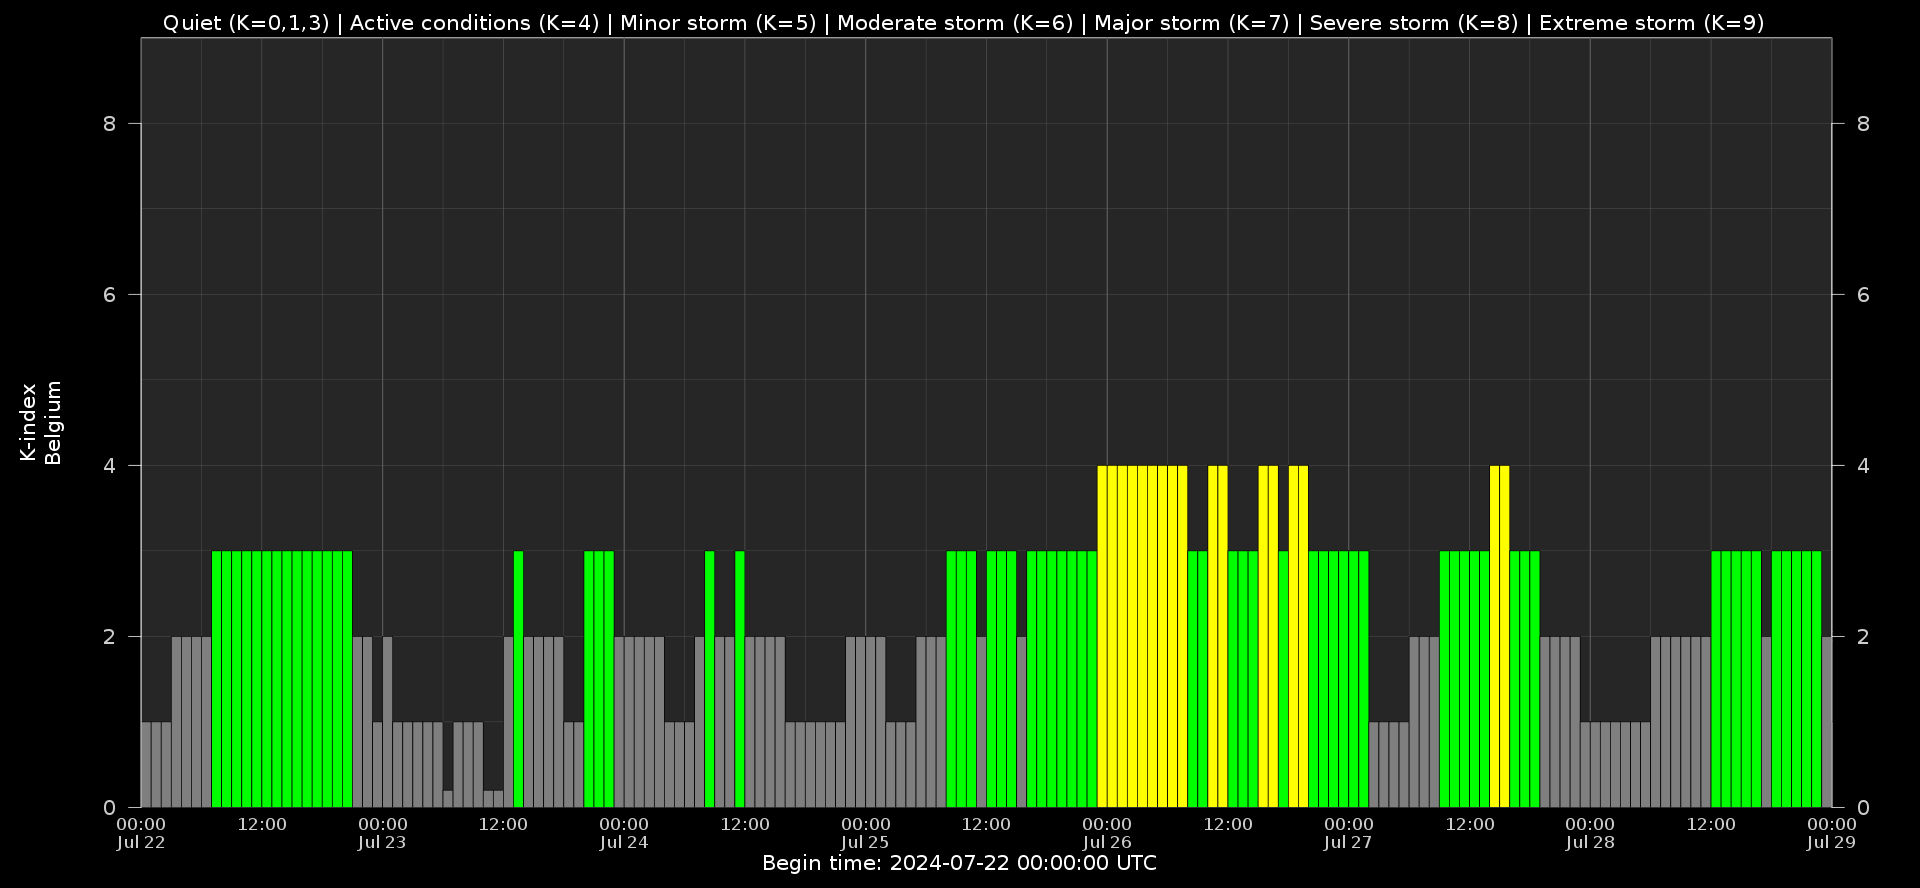
Local K-type magnetic activity index for Belgium based on data from Dourbes (DOU) and Manhay (MAB). Comparing the data from both measurement stations allows to reliably remove outliers from the magnetic data. At the same time the operational service availability is improved: whenever data from one observatory is not available, the single-station index obtained from the other can be used as a fallback system.
Both the two-station index and the single station indices are available here: http://ionosphere.meteo.be/geomagnetism/K_BEL/
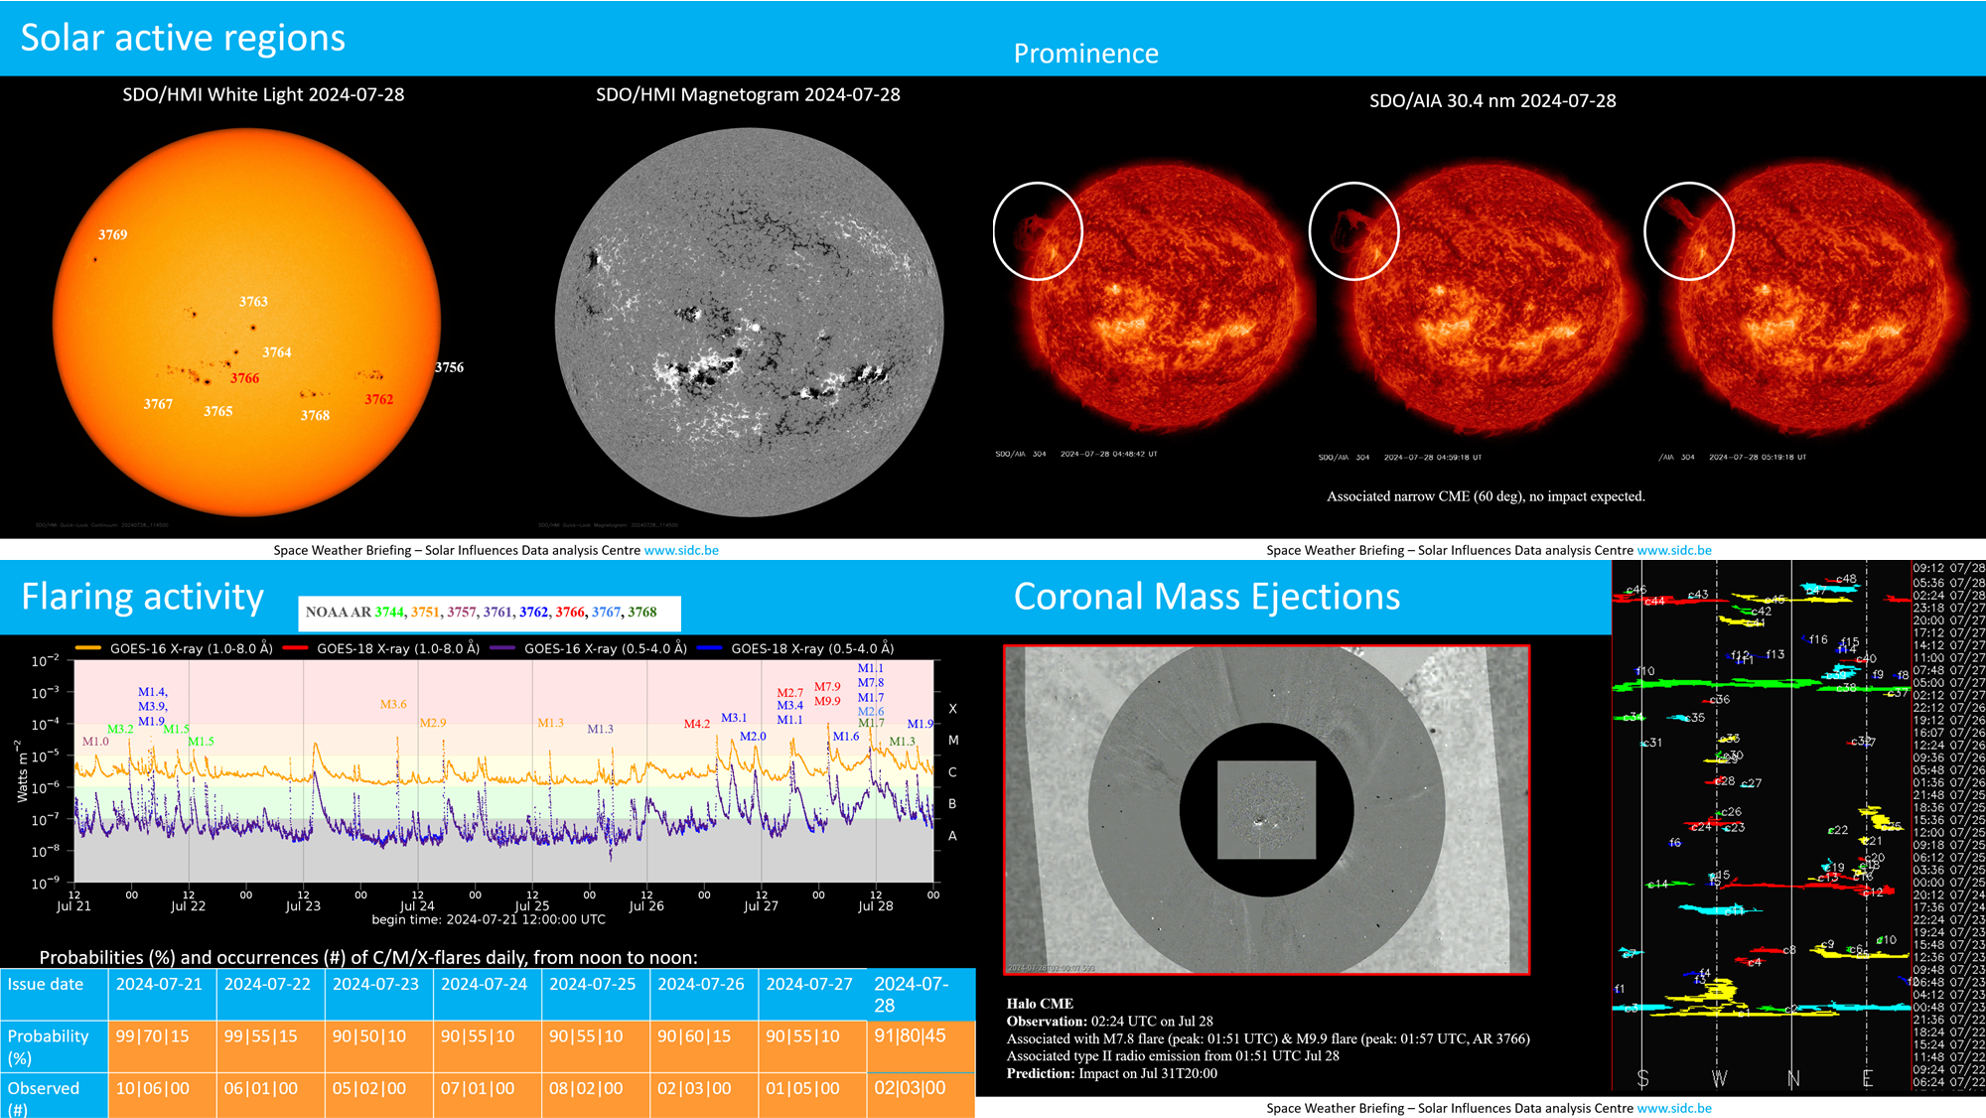
The SIDC Space Weather Briefing
The forecaster on duty presented the SIDC briefing that gives an overview of space weather from July 21 to July 28.
The pdf of the presentation can be found here: https://www.stce.be/briefings/20240729_SWbriefing.pdf
Review of Ionospheric Activity
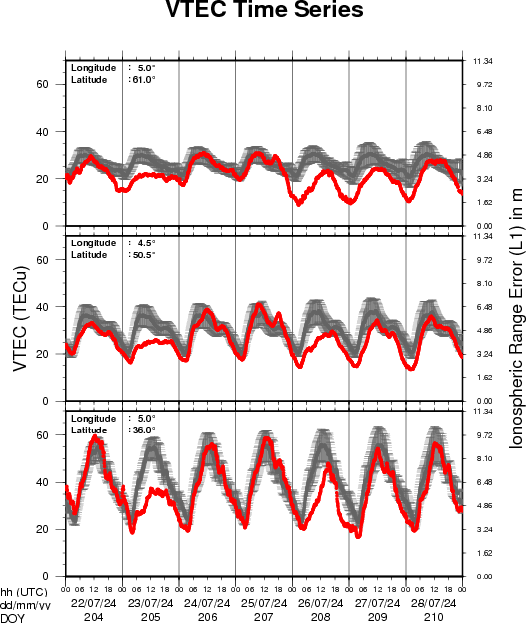
VTEC time series at 3 locations in Europe from 22 Jul 2024 till 28 Jul 2024
The top figure shows the time evolution of the Vertical Total Electron Content (VTEC) (in red) during the last week at three locations:
a) in the northern part of Europe(N 61deg E 5deg)
b) above Brussels(N 50.5deg, E 4.5 deg)
c) in the southern part of Europe(N 36 deg, E 5deg)
This top figure also shows (in grey) the normal ionospheric behaviour expected based on the median VTEC from the 15 previous days.
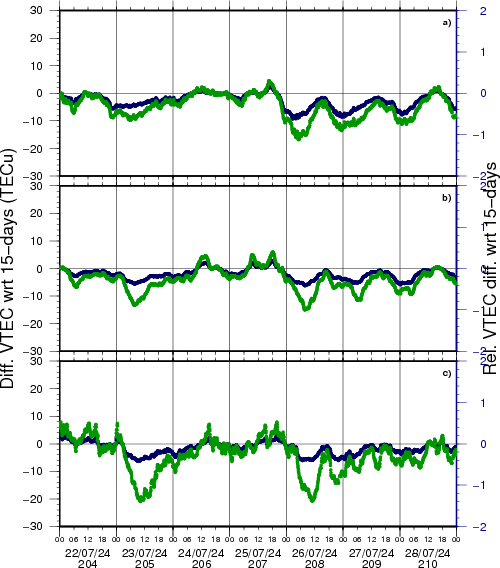
The time series below shows the VTEC difference (in green) and relative difference (in blue) with respect to the median of the last 15 days in the North, Mid (above Brussels) and South of Europe. It thus illustrates the VTEC deviation from normal quiet behaviour.
The VTEC is expressed in TECu (with TECu=10^16 electrons per square meter) and is directly related to the signal propagation delay due to the ionosphere (in figure: delay on GPS L1 frequency).
The Sun's radiation ionizes the Earth's upper atmosphere, the ionosphere, located from about 60km to 1000km above the Earth's surface.The ionization process in the ionosphere produces ions and free electrons. These electrons perturb the propagation of the GNSS (Global Navigation Satellite System) signals by inducing a so-called ionospheric delay.
See http://stce.be/newsletter/GNSS_final.pdf for some more explanations; for more information, see https://gnss.be/SpaceWeather
Lectures and courses
Courses and presentations with the Sun-Space-Earth system and Space Weather as the main theme. We provide occasions to get submerged in our world through educational, informative and instructive activities.
* Sep 27, STCE at the Wisenight Science festival in the Planetarium, Brussel, https://wisenight.eu/
* Sep 30 - Oct 3, STCE Space Weather Introductory Course, Brussels, Belgium - Registrations are open https://events.spacepole.be/event/204/
* Nov 25 - 27, STCE course: Space Weather impacts on ionospheric wave propagation, focus on GNSS and HF, Brussels, Belgium - Registrations are open, https://events.spacepole.be/event/206/
* Dec 5-6, STCE Course Space Weather impacts on aviation, Brussels, Belgium - Registrations are open, https://events.spacepole.be/event/205/
To register for a course or lecture, check the page of the STCE Space Weather Education Center: https://www.stce.be/SWEC
If you want your event in the STCE newsletter, contact us: stce_coordination at stce.be