- Table of Content
- 1.Solar hemisphe...
- 2.Review of sola...
- 3.International ...
- 4.PROBA2 Observa...
- 5.Noticeable Sol...
- 6.Geomagnetic Ob...
- 7.Review of Iono...
- 8.The SIDC Space...
- 9.Upcoming Activ...
2. Review of solar and geomagnetic activity
3. International Sunspot Number by SILSO
4. PROBA2 Observations
5. Noticeable Solar Events
6. Geomagnetic Observations in Belgium
7. Review of Ionospheric Activity
8. The SIDC Space Weather Briefing
9. Upcoming Activities
Solar hemispheric asymmetry
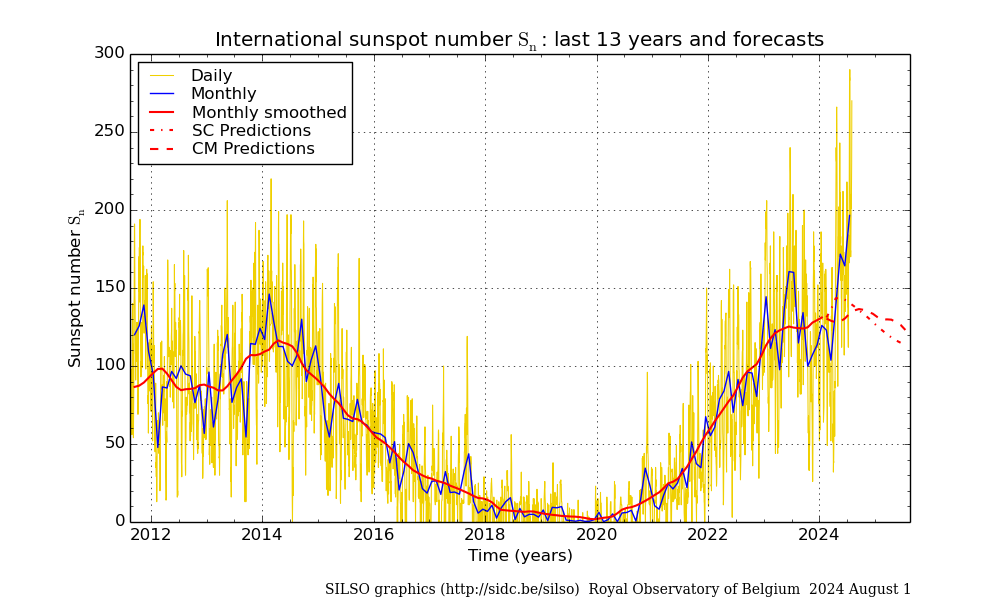
SILSO, the World Data Center for the production, preservation and dissemination of the international sunspot number (https://www.sidc.be/SILSO/home ), has issued its monthly report for July 2024. The provisional sunspot number for last month is 196.5, which is the highest monthly value since December 2001, i.e. near the maximum of solar cycle 23 (SC23 - SILSO table at https://www.sidc.be/SILSO/cyclesminmax ). The highest daily value was recorded on 18 July (290), a value not seen since 27-29 July 2002 when the daily sunspot numbers varied between 290 and 310. The SILSO graph underneath shows the daily, monthly, and smoothed monthly sunspot numbers since mid-2011. The forecasts (dashed lines) now give a smoothed maximum for SC25 of 137-144 during the May-September 2024 timeframe. With the number of sunspots already observed so far in August, this maximum may turn out to be even higher.
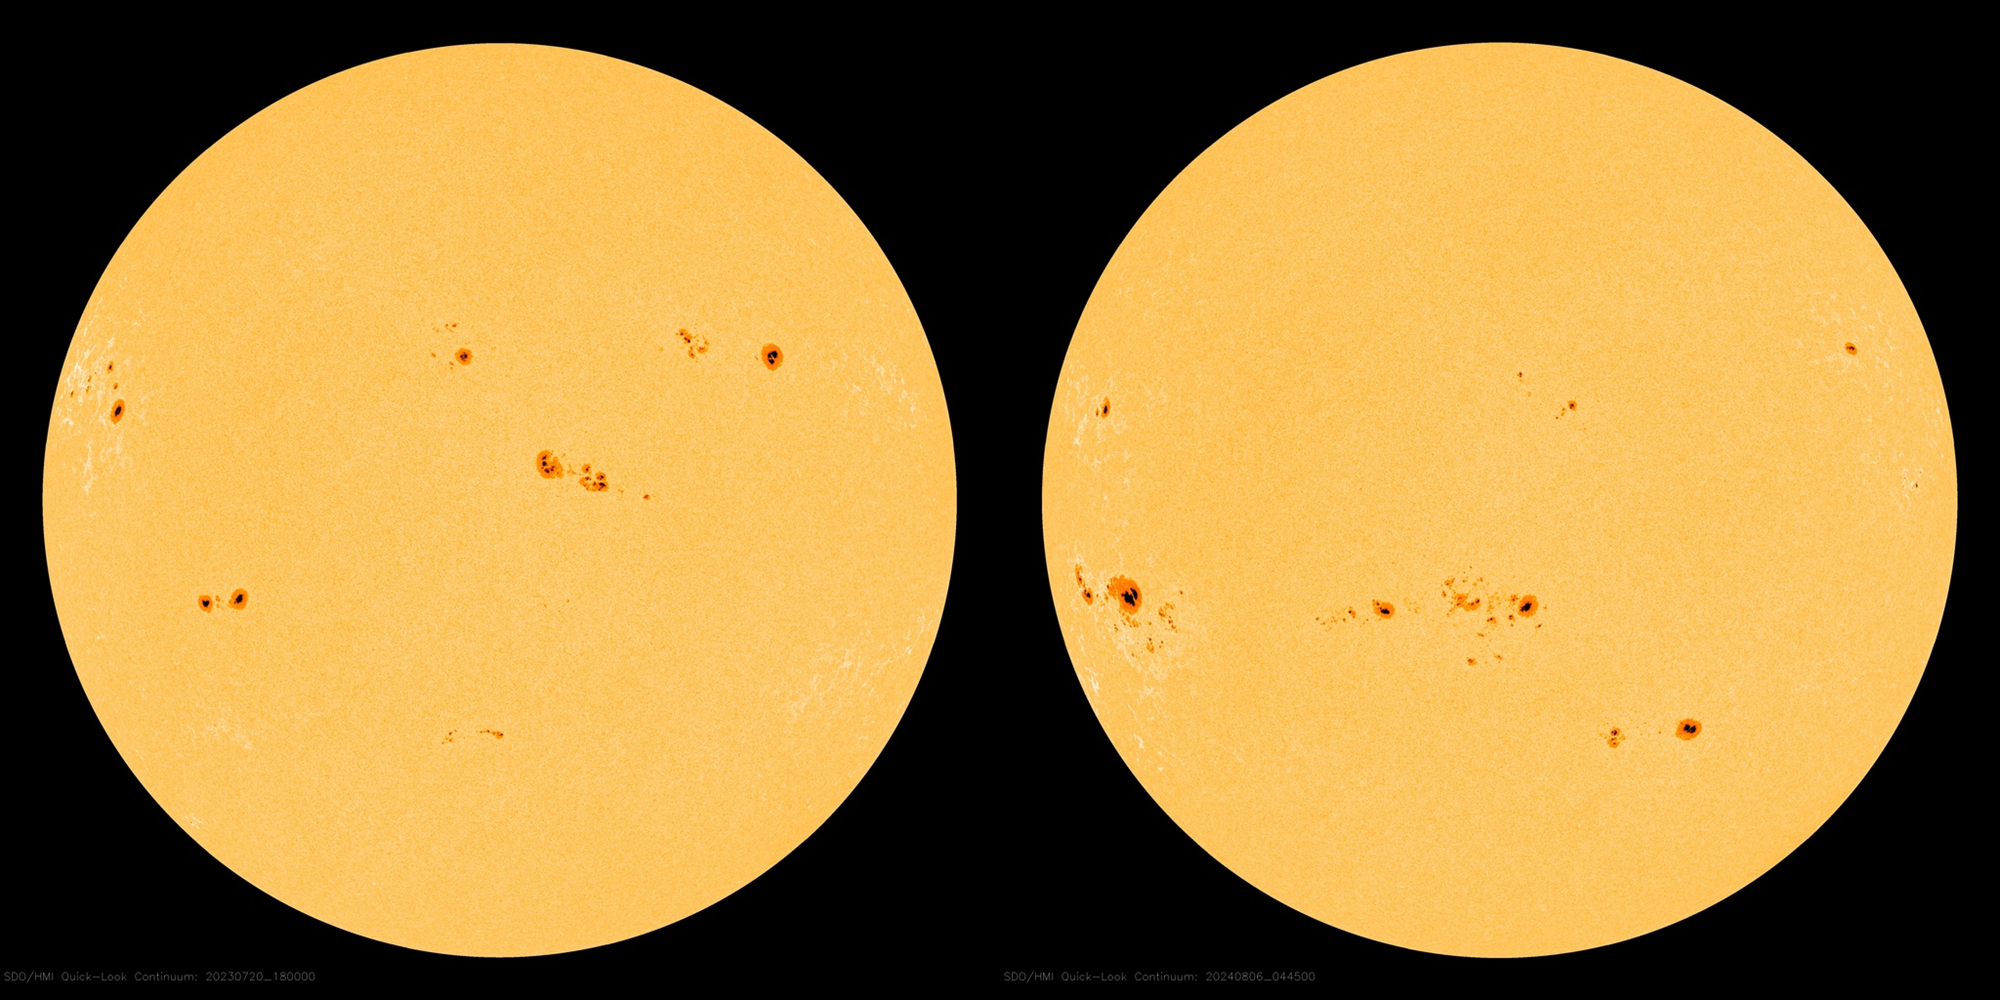
The observed sunspot activity has been driven by a plethora of active regions in the southern hemisphere. This domination over the northern hemisphere only started a few months ago, and continued into August. The comparison underneath (SDO/HMI - http://sdo.gsfc.nasa.gov/data/aiahmi/ ) shows the Sun's appearance in white light a year ago (20 July 2023 - left) and currently (6 August 2024 - right). This domination (aka hemispheric asymmetry) can last for years as shown in these plots at SILSO (https://www.sidc.be/SILSO/monthlyhemisphericplot ) and the STCE's SC25 tracking page (https://www.stce.be/content/sc25-tracking#hemi ).
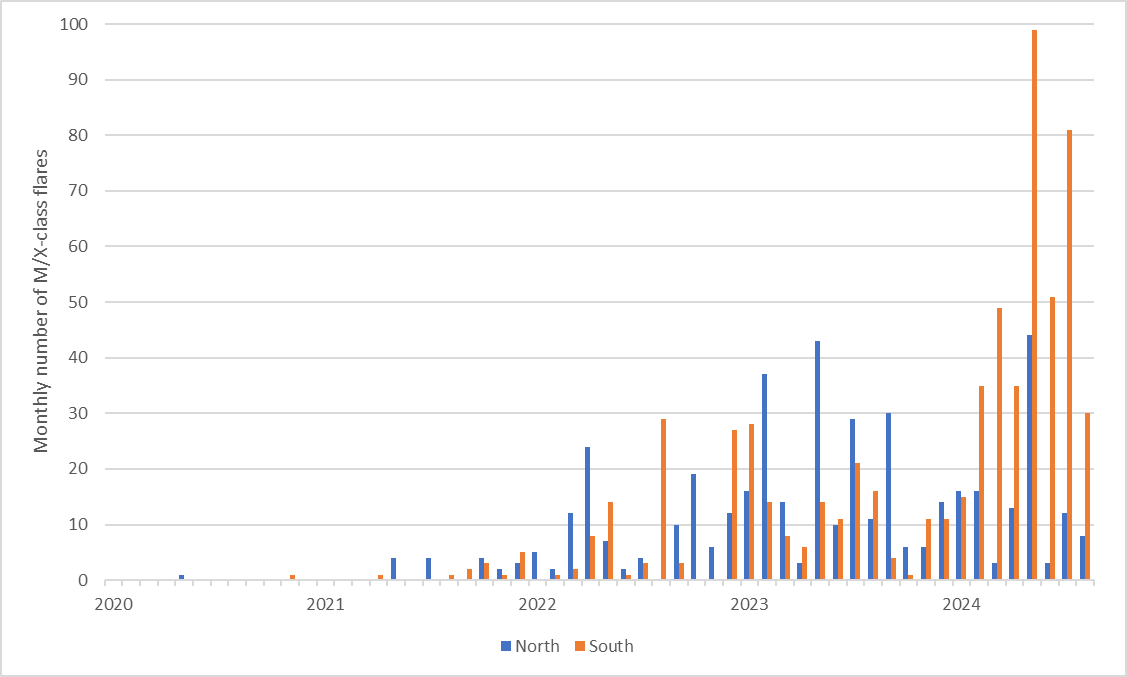
The domination of the southern solar hemisphere is also visible in other parameters, such as the number of solar flares (M- and X-class). The graph underneath clearly shows how -in 2023- most of the flares were produced in the northern solar hemisphere, whereas from early 2024 onwards the southern hemisphere has taken over with the largest monthly number of flares so far this solar cycle. In May, no less than 143 M- and X-class flares have been recorded, 99 of which in the southern solar hemisphere and -mostly- courtesy of the super group NOAA 3664 (https://www.stce.be/news/704/welcome.html ). Interestingly, the last data point is only for the first 4 days of August and far from complete. Yet, the flare numbers are already close to some of the monthly flare numbers in the northern hemisphere for an entire month!... Impressive.
Review of solar and geomagnetic activity
WEEK 1231 from 2024 Jul 29
Solar Active Regions (ARs) and flares
Solar flaring activity has been at high levels throughout the week, with one X-class flare and 48 M-class flares recorded. The strongest flare was an an X1.5 flare peaking at 02:37 UTC on July 29, most likely associated either with NOAA AR 3764 (beta) or 3766 (beta). There was a total of 18 numbered active regions on the visible disk, many of them developing to a complex magnetic type beta-gamma-delta (NOAA ARs 3762, 3765, 3766, 3767, 3768, 3772, 3774) during the week. Of particular interest was a cluster of complex active regions (NOAA ARs 3763 to 3767), which rotated behind the west limb towards the end of the week.
Coronal Mass Ejections
Multiple Coronal Mass Ejections (CMEs), filament and prominence eruptions were recorded during the last week. Selected events are listed below.
A halo CME was observed in LASCO/C2 coronagraph imagery around 15:10 UTC on July 28. Another faint partial halo CME was first observed in LASCO/C2 coronagraph imagery around 02:40 UTC on July 29. A related type II Radio emission was reported, starting at 02:36 UTC, with an estimated velocity of 535 km/s. A CME was observed in LASCO/C2 coronagraph imagery around 13:36 UTC on July 29, probably associated with an M8.7 flare from NOAA AR 3762. A CME was observed in LASCO/C2 coronagraph imagery around 15:33 UTC on July 29, associated with a filament eruption in the southwest quadrant, south of NOAA AR 3768. A wide CME was observed in LASCO/C2 coronagraph imagery around 07:15 UTC on July 31, lifting off the southeast limb. It was probably associated with the M7.7 flare which peaked at 06:46 UTC on July 31, from NOAA AR 3768. A partial halo CME was observed in LASCO/C2 coronagraph imagery around 18:48 UTC on July 31, lifting off the west limb. It was likely associated with an M5.3 flare peaking at 18:37, from NOAA AR 3768. A related type II radio emission was observed, starting at 18:20 UTC on July 31 with an estimated velocity of 326 km/s. An associated type IV radio emission was observed, starting at 18:31 UTC on July 31. A partial halo CME was observed in LASCO/C2 coronagraph imagery around 06:40 UTC on August 01, lifting off the west limb. It was most likely associated with an M8.2 flare from NOAA AR3768, starting at 06:20 UTC and peaking at 07:09 UTC on August 01. An associated type II radio emission was observed, starting at 07:12 UTC on August 01 with an estimated velocity of 739 km/s. A related type IV radio emission was observed, starting at 07:08 UTC on August 01. A wide CME was observed in LASCO/C2 and LASCO/C3 coronagraph imagery starting from 21:42 UTC on August 01, lifting off the northeast quadrant. It was possibly associated with a filament eruption near NOAA AR 3775. A partial halo CME was observed in LASCO/C2 and LASCO/C3 coronagraph imagery starting from 04:17 UTC on August 02. It was likely associated with flaring activity near the west limb from NOAA ARs 3768 or 3773. A related type II radio emission was observed, starting at 04:49 UTC on August 01, with an estimated velocity of 438 km/s. A related type IV radio emission was observed, starting at 04:57 UTC on August 01.
A large filament eruption was observed around 18:40 UTC on August 02 in AIA 304 data, in the southwest quadrant. A prominence eruption was observed around 23:55 UTC on August 02 in AIA 304 data, in the east limb, near the equator. A second filament eruption was observed around 01:45 UTC on August 03 in AIA 304 data, in the northwest quadrant near NOAA AR 3770. No associated coronal mass ejections (CMEs) were observed in the available coronagraph imagery for these events. Three filament eruptions were observed in AIA data on August 03 and August 04. The first was a filament eruption around 12:15 UTC on August 03 in the south hemisphere, near the central meridian. The second filament eruption was recorded around 13:49 UTC on August 03 near NOAA AR 3777. The third filament eruption was observed around 00:20 UTC on August 04, near NOAA AR 3775. Last, a large prominence eruption was recorded around 04:42 UTC on August 04, in the southwest limb.
Coronal Holes
Two coronal holes have appeared on the visible disk during the week. The first was a high-latitude, negative polarity coronal hole which fully crossed the central meridian on August 01. The second was an equatorial, negative polarity coronal hole which started to cross the central meridian late on August 04.
Proton flux levels
The greater than 10 MeV GOES proton flux was below the 10 pfu threshold throughout the week, with small enhancements between 05:30-16:00 UTC on August 01 and between 01:00-15:30 UTC on August 02. It remained at background levels until the end of the week.
Electron fluxes at GEO
The greater than 2 MeV electron flux seen by GOES-18 was over the threshold between 16:45 UTC on July 29 and 02:00 UTC on July 30. The greater than 2 MeV electron flux seen by GOES-16 at the same time was close to the threshold level but remained below it. For the rest of the week, the greater than 2 MeV electron flux remained below the 1000 pfu threshold as measured by GOES 16 and GOES 18. The 24-hour electron fluence was at nominal levels throughout the week.
Solar wind
A shock was detected in the solar wind data (DSCOVR and ACE) around 23:20 UTC on July 29. The interplanetary magnetic field jumped from 4 nT to 14 nT, with the Bz component changing from -3 nT to 11 nT and then decreasing up to -12 nT. The solar wind speed jumped from 350 km/s to 440 km/s and increased up to 500 km/s. The solar wind density at the shock jumped from 1.84 ppcc to 7.25 ppcc and increased up to around 15 ppcc. The shock was probably related to an interplanetary coronal mass ejection (ICME) arrival, associated with one of the CMEs detected between July 27-28.
The solar wind conditions were enhanced again starting early on August 04, probably due to a glancing blow arrival from a coronal mass ejection that lifted off the Sun on July 31. Speed values reached a maximum of around 480 km/s and the interplanetary magnetic field a maximum of 15 nT. The Bz component reached -15 nT.
Geomagnetism
Geomagnetic conditions globally reached minor storm levels (NOAA Kp 5) between 03:00-06:00 UTC on July 30 and at 18:00 UTC on July 31 until 06:00 on August 01, in response to interplanetary coronal mass ejection (ICME) arrivals. At the same intervals, geomagnetic conditions locally reached active levels (K Bel 4).
Geomagnetic conditions globally reached major storm levels (NOAA Kp 7-) between 12:00-15:00 UTC on August 04, in response to a glancing blow arrival from the CME that lifted off the Sun on July 31. At the same time, geomagnetic conditions locally reached minor storm levels (K Bel 5).
International Sunspot Number by SILSO
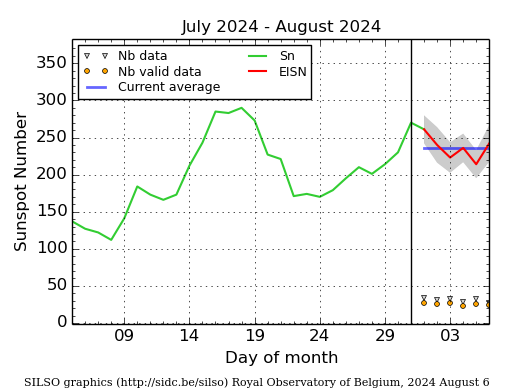
The daily Estimated International Sunspot Number (EISN, red curve with shaded error) derived by a simplified method from real-time data from the worldwide SILSO network. It extends the official Sunspot Number from the full processing of the preceding month (green line), a few days more than one solar rotation. The horizontal blue line shows the current monthly average. The yellow dots give the number of stations that provided valid data. Valid data are used to calculate the EISN. The triangle gives the number of stations providing data. When a triangle and a yellow dot coincide, it means that all the data is used to calculate the EISN of that day.
PROBA2 Observations
Solar Activity
Solar flare activity ranged from moderate to high throughout the week. An unusually high number of active regions were observed on the solar disk, with several producing M-class flares. On several occasions, flares occurred in different regions in close succession, suggesting the possibility of sympathetic events.
In order to view the activity of this week in more detail, we suggest to go to the following website from which all the daily (normal and difference) movies can be accessed: https://proba2.oma.be/ssa
This page also lists the recorded flaring events.
A weekly overview movie can be found here (SWAP week 749). https://proba2.sidc.be/swap/data/mpg/movies/weekly_movies/weekly_movie_2024_07_29.mp4
Details about some of this week's events can be found further below.
If any of the linked movies are unavailable they can be found in the P2SC movie repository here: https://proba2.sidc.be/swap/data/mpg/movies/
Monday Jul 29
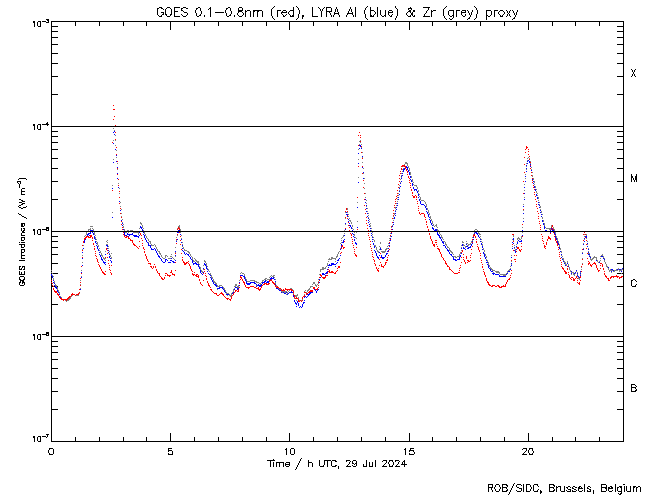
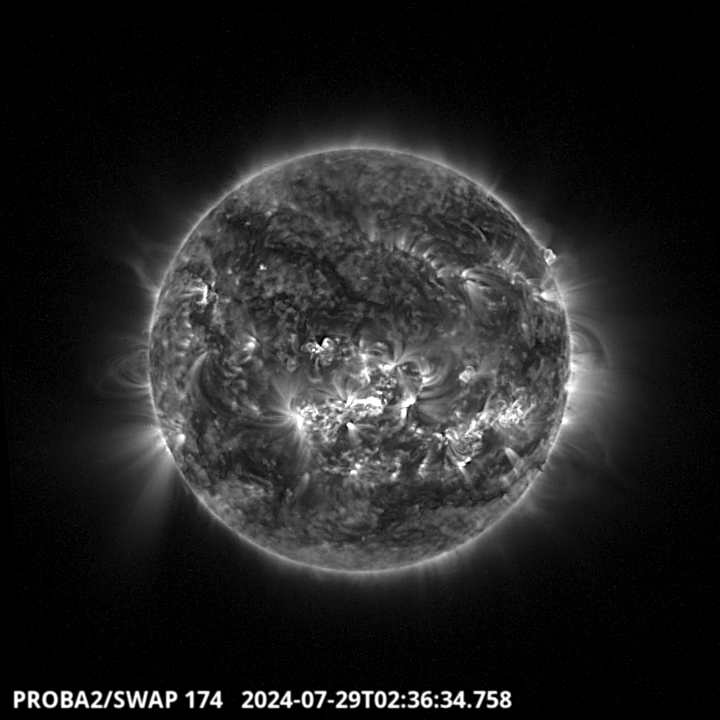
The biggest flare of the week, a X1.5, occurred around 2:37UT. It was produced by the NOAA active region 3766 located at S05W04. The LYRA time series and the SWAP image show the large event. Find a SWAP movie of the event here: https://proba2.sidc.be/swap/movies/20240729_swap_movie.mp4
Wednesday Jul 31
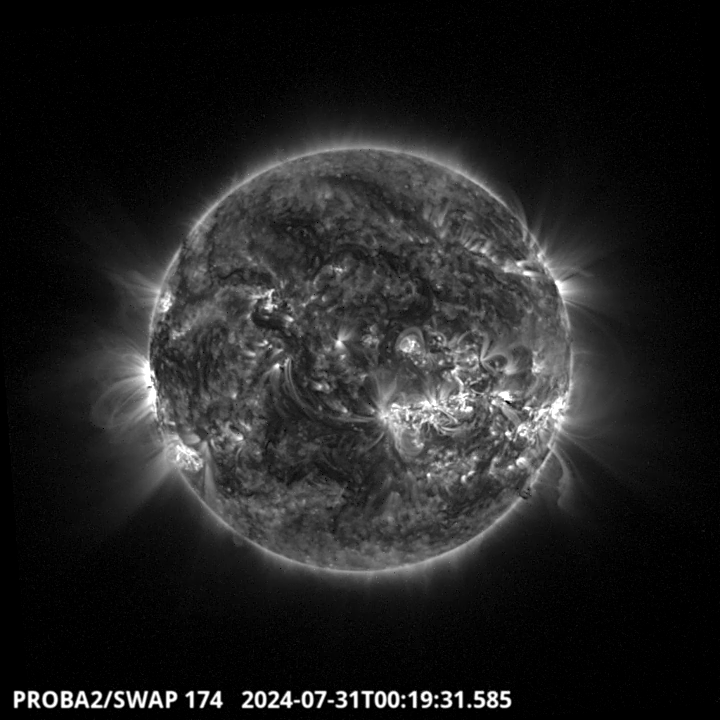
A filament eruption occurred in the South-West part of the solar disk around 00:20 UT, immediately followed by a prominence eruption on the S-W limb. Find a SWAP movie of the event here: https://proba2.sidc.be/swap/movies/20240731_swap_movie.mp4
Saturday Aug 3
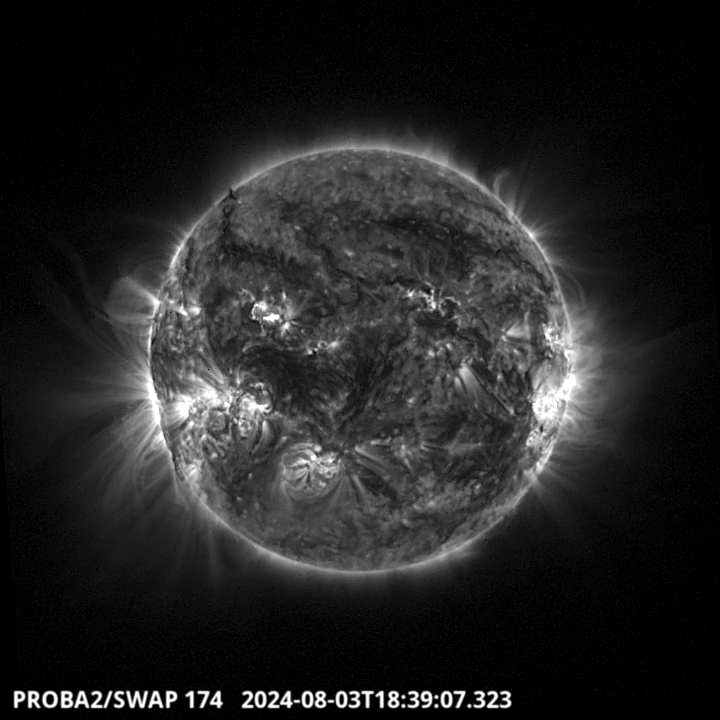
A M7.3 solar flare was observed in NOAA active region 3775 around 18:39 UT in the North East part of the solar disk. Another event, a M5.4 flare, happened shortly after at the East limb. Find a SWAP movie of the event here: https://proba2.sidc.be/swap/movies/2024070803_swap_movie.mp4
Sunday Aug 4
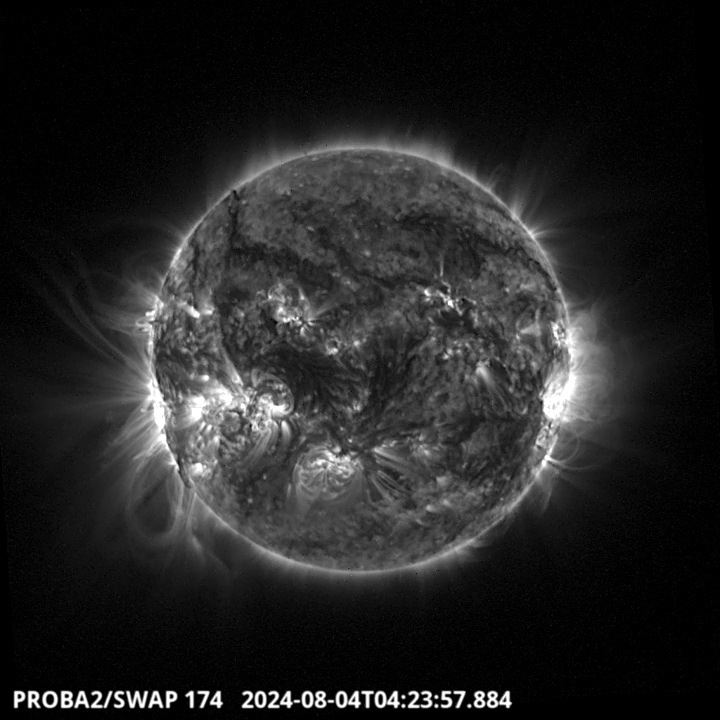
Plasma flows were observed in a giant prominence on the south west limb around 04:24 UT, highlighting the complex configuration and the magnetic connection of the structure with the whole region. This event did not result in an eruption, though. Find a SWAP movie of the event here: https://proba2.sidc.be/swap/movies/20240804_swap_movie.mp4
Noticeable Solar Events
| DAY | BEGIN | MAX | END | LOC | XRAY | OP | 10CM | TYPE | Cat | NOAA |
| 29 | 0233 | 0237 | 0243 | S5W4 | X1.5 | 2B | II/2 | 32 | 3766 | |
| 29 | 0510 | 0520 | 0528 | S14W36 | M1.0 | SF | III/2 | 37 | 3768 | |
| 29 | 1216 | 1222 | 1229 | S11W56 | M1.6 | SF | 26 | 3762 | ||
| 29 | 1247 | 1255 | 1304 | M8.7 | III/3II/1IV/1 | 26 | 3762 | |||
| 29 | 1404 | 1446 | 1509 | S12W4 | M4.2 | 1N | IV/2 | 3772 | ||
| 29 | 1940 | 1957 | 2010 | M6.4 | 3772 | |||||
| 29 | 2055 | 2100 | 2106 | S14W48 | M1.1 | SF | 37 | 3768 | ||
| 30 | 0052 | 0103 | 0120 | M1.7 | VI/2 | 26 | 3762 | |||
| 30 | 0130 | 0132 | 0136 | M1.3 | 26 | 3762 | ||||
| 30 | 0616 | 0629 | 0646 | S7W13 | M1.5 | SF | VI/1 | 32 | 3766 | |
| 30 | 0120 | 0125 | 0130 | M1.2 | 26 | 3762 | ||||
| 30 | 0135 | 0140 | 0144 | M1.4 | VI/2 | 32 | 3766 | |||
| 30 | 1612 | 1628 | 1642 | S8W27 | M1.5 | 1F | 32 | 3766 | ||
| 30 | 1910 | 1920 | 1925 | S4W29 | M1.9 | SN | V/3 | 30 | 3764 | |
| 30 | 1925 | 1938 | 2004 | S24E64 | M9.4 | 2N | V/3 | 3772 | ||
| 31 | 0143 | 0150 | 0154 | M1.9 | 3773 | |||||
| 31 | 0507 | 0523 | 0538 | S4E83 | M4.7 | SF | VI/2 | 3774 | ||
| 31 | 0628 | 0646 | 0658 | M7.7 | V/3III/3CTM/2 | 37 | 3768 | |||
| 31 | 1245 | 1305 | 1326 | S22E55 | M6.0 | 1N | III/2 | 3772 | ||
| 31 | 1326 | 1332 | 1337 | S22E55 | M4.4 | 1N | 3774 | |||
| 31 | 1610 | 1631 | 1641 | S15W68 | M1.4 | SF | 3774 | |||
| 31 | 1805 | 1837 | 1858 | S15W71 | M5.3 | SF | II/2III/2IV/2 | 37 | 3768 | |
| 31 | 2136 | 2155 | 2210 | S15W71 | M1.2 | SF | III/2 | 35 | 3767 | |
| 31 | 2242 | 2250 | 2259 | M1.0 | 3774 | |||||
| 01 | 0050 | 0058 | 0103 | M1.2 | III/1 | 3770 | ||||
| 01 | 0147 | 0150 | 0154 | M6.3 | V/3 | 3773 | ||||
| 01 | 0258 | 0306 | 0314 | M1.2 | 3774 | |||||
| 01 | 0359 | 0409 | 0423 | M1.9 | 3774 | |||||
| 01 | 0435 | 0441 | 0445 | M4.0 | III/2 | 35 | 3765 | |||
| 01 | 0552 | 0556 | 0600 | S12W35 | M1.5 | SF | III/2 | 37 | 3768 | |
| 01 | 0623 | 0709 | 0739 | S16W74 | M8.2 | 1N | III/2IV/2II/2 | 37 | 3768 | |
| 31 | 1807 | 1837 | 1857 | S15W71 | M5.4 | SF | II/2III/2IV/2 | 37 | 3768 | |
| 01 | 1109 | 1137 | 1141 | S16W80 | M4.1 | SF | 37 | 3768 | ||
| 01 | 1141 | 1147 | 1151 | S16W80 | M4.1 | SF | 3772 | |||
| 01 | 1604 | 1615 | 1619 | S5W53 | M1.0 | SF | 30 | 3764 | ||
| 01 | 1633 | 1637 | 1644 | S8W41 | M1.3 | SF | 35 | 3765 | ||
| 01 | 1722 | 1729 | 1734 | S3E63 | M1.3 | SF | 3774 | |||
| 01 | 2012 | 2022 | 2032 | S13E63 | M1.2 | SF | 3774 | |||
| 01 | 2300 | 2308 | 2317 | S21E37 | M1.4 | SF | 3772 | |||
| 02 | 0154 | 0201 | 0208 | M1.0 | 35 | 3765 | ||||
| 02 | 0317 | 0325 | 0331 | M1.1 | 3772 | |||||
| 02 | 0353 | 0358 | 0403 | M1.1 | III/1 | 37 | 3768 | |||
| 02 | 0423 | 0455 | 0535 | S23E32 | M7.3 | SF | IV/1 | 37 | 3768 | |
| 02 | 0751 | 0759 | 0803 | S8W48 | M2.1 | SF | III/1 | 35 | 3765 | |
| 02 | 0908 | 0916 | 0928 | S26E32 | M1.2 | SF | 3772 | |||
| 02 | 0945 | 0951 | 0955 | S6W57 | M1.6 | SN | 32 | 3766 | ||
| 02 | 1228 | 1233 | 1238 | S8W79 | M1.2 | SF | 3773 | |||
| 02 | 1344 | 1350 | 1400 | N19E43 | M1.1 | SN | VI/1 | 3775 | ||
| 02 | 1521 | 1530 | 1535 | S6W60 | M1.5 | SN | VI/1 | 32 | 3766 | |
| 03 | 0022 | 0027 | 0032 | S10E64 | M1.0 | SF | 3777 | |||
| 02 | 2341 | 2358 | 0022 | M1.3 | ||||||
| 03 | 0445 | 0459 | 0505 | N9W59 | M1.5 | SF | 3770 | |||
| 03 | 0652 | 0705 | 0711 | M1.5 | 3770 | |||||
| 03 | 0711 | 0730 | 0734 | M1.9 | 3770 | |||||
| 03 | 1326 | 1343 | 1355 | S9E44 | M1.8 | 2N | 3774 | |||
| 03 | 1649 | 1654 | 1658 | M2.8 | VI/2 | 3770 | ||||
| 03 | 1713 | 1726 | 1734 | M1.9 | 32 | 3766 | ||||
| 03 | 1829 | 1839 | 1844 | M7.3 | III/1 | 3775 | ||||
| 03 | 1917 | 1930 | 1943 | M5.4 | VI/1 | |||||
| 04 | 0145 | 0159 | 0217 | M1.4 | 3781 | |||||
| 04 | 0935 | 0944 | 0948 | M1.2 | 3765 | |||||
| 04 | 0948 | 1001 | 1003 | M1.1 | 3766 | |||||
| 04 | 1003 | 1008 | 1012 | M1.4 | III/1 | 3766 | ||||
| 04 | 1027 | 1050 | 1124 | S18W71 | M1.9 | SF | VI/2 | 3781 | ||
| 04 | 1511 | 1515 | 1519 | S9E69 | M2.2 | SN | V/3III/3 | 3780 | ||
| 04 | 2204 | 2211 | 2215 | S9E66 | M1.0 | SN | V/2II/3III/3 | 3780 |
| LOC: approximate heliographic location | TYPE: radio burst type |
| XRAY: X-ray flare class | Cat: Catania sunspot group number |
| OP: optical flare class | NOAA: NOAA active region number |
| 10CM: peak 10 cm radio flux |
Geomagnetic Observations in Belgium
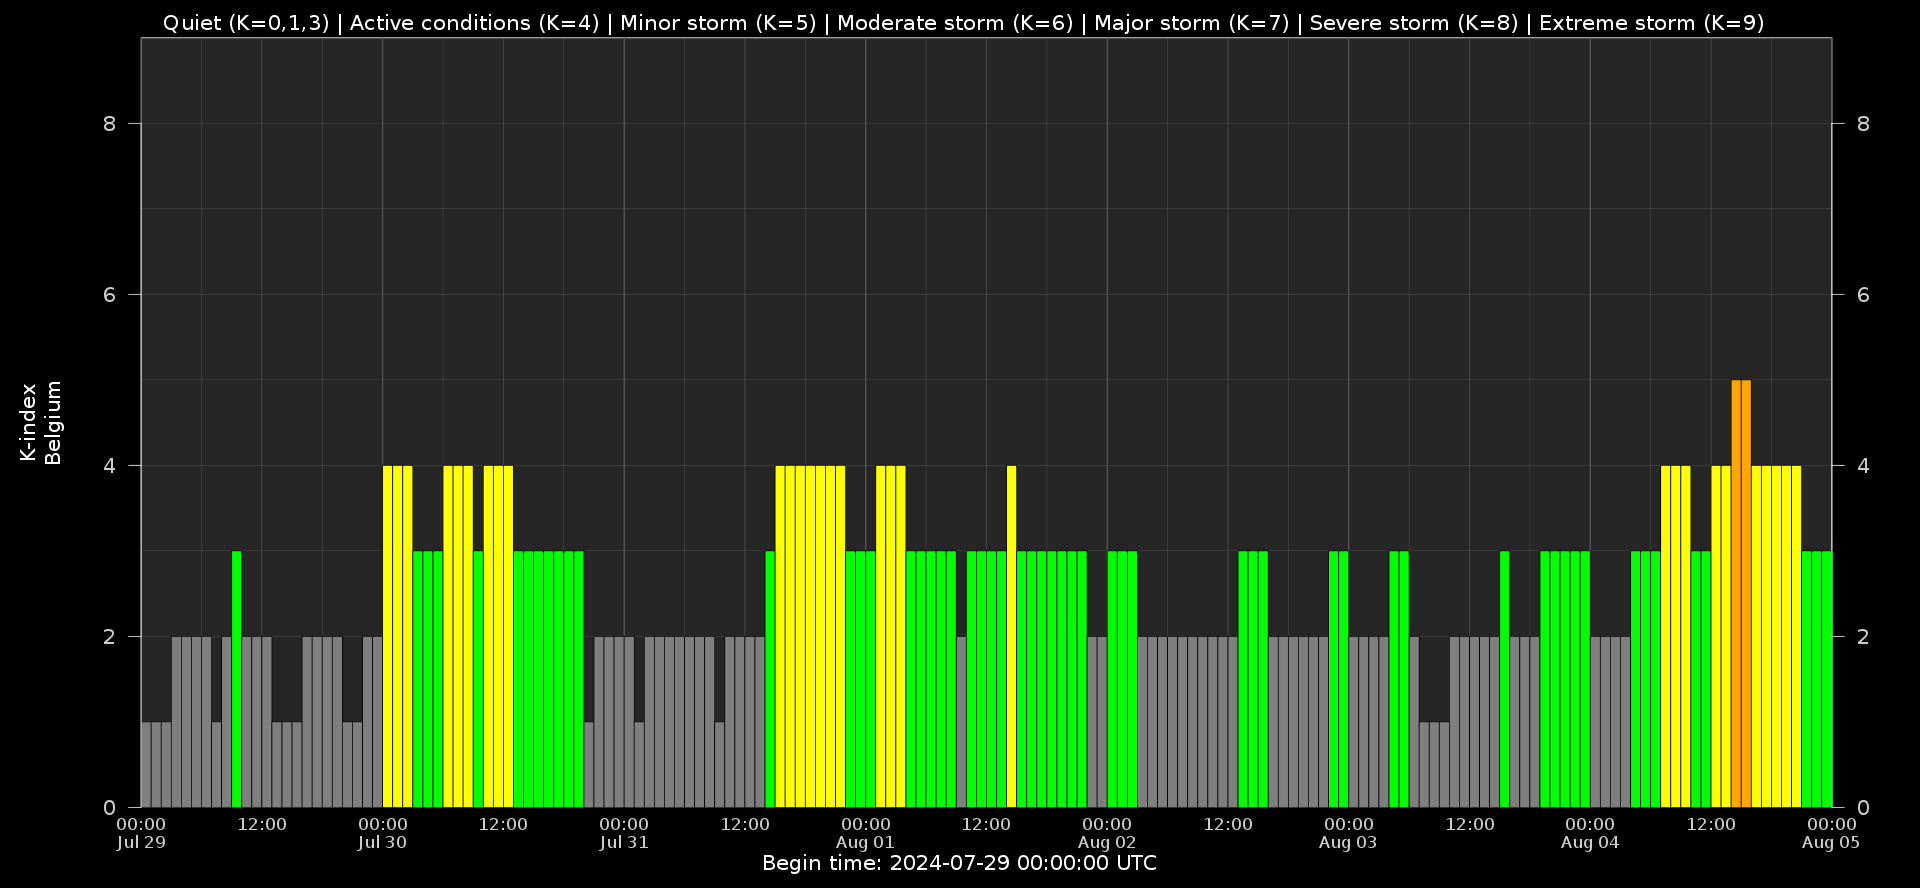
Local K-type magnetic activity index for Belgium based on data from Dourbes (DOU) and Manhay (MAB). Comparing the data from both measurement stations allows to reliably remove outliers from the magnetic data. At the same time the operational service availability is improved: whenever data from one observatory is not available, the single-station index obtained from the other can be used as a fallback system.
Both the two-station index and the single station indices are available here: http://ionosphere.meteo.be/geomagnetism/K_BEL/
Review of Ionospheric Activity
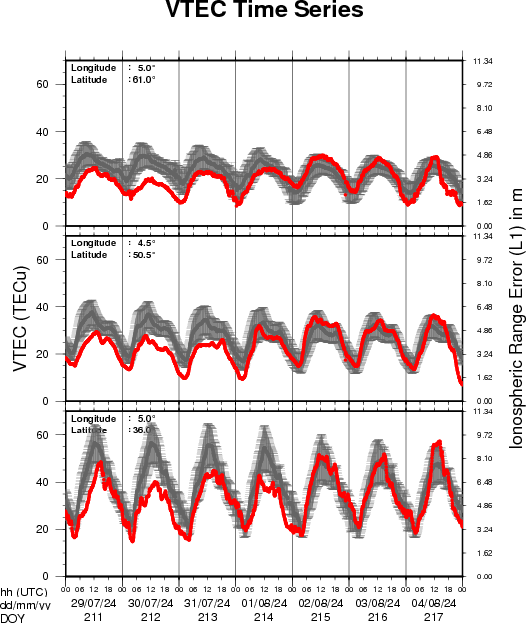
VTEC time series at 3 locations in Europe from 29 Jul 2024 till 4 Aug 2024
The top figure shows the time evolution of the Vertical Total Electron Content (VTEC) (in red) during the last week at three locations:
a) in the northern part of Europe(N 61deg E 5deg)
b) above Brussels(N 50.5deg, E 4.5 deg)
c) in the southern part of Europe(N 36 deg, E 5deg)
This top figure also shows (in grey) the normal ionospheric behaviour expected based on the median VTEC from the 15 previous days.
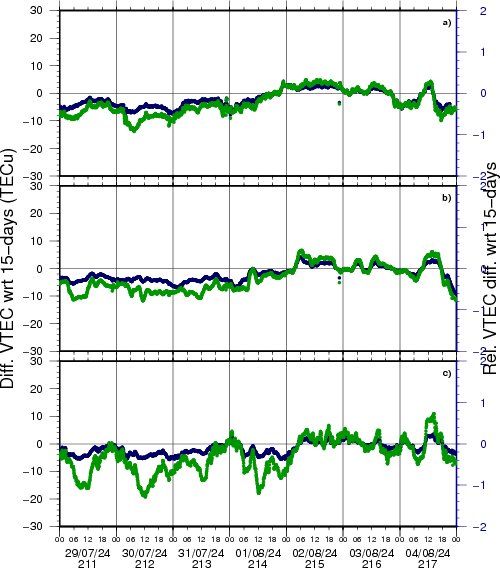
The time series below shows the VTEC difference (in green) and relative difference (in blue) with respect to the median of the last 15 days in the North, Mid (above Brussels) and South of Europe. It thus illustrates the VTEC deviation from normal quiet behaviour.
The VTEC is expressed in TECu (with TECu=10^16 electrons per square meter) and is directly related to the signal propagation delay due to the ionosphere (in figure: delay on GPS L1 frequency).
The Sun's radiation ionizes the Earth's upper atmosphere, the ionosphere, located from about 60km to 1000km above the Earth's surface.The ionization process in the ionosphere produces ions and free electrons. These electrons perturb the propagation of the GNSS (Global Navigation Satellite System) signals by inducing a so-called ionospheric delay.
See http://stce.be/newsletter/GNSS_final.pdf for some more explanations; for more information, see https://gnss.be/SpaceWeather
The SIDC Space Weather Briefing
The forecaster on duty presented the SIDC briefing that gives an overview of space weather from July 28 to August 4.
The pdf of the presentation can be found here: https://www.stce.be/briefings/20240805_SWbriefing.pdf

Upcoming Activities
Courses and presentations with the Sun-Space-Earth system and Space Weather as the main theme. We provide occasions to get submerged in our world through educational, informative and instructive activities.
* Sep 27, STCE at the Wisenight Science festival in the Planetarium, Brussel, https://wisenight.eu/
* Sep 30 - Oct 3, STCE Space Weather Introductory Course, Brussels, Belgium - Registrations are open https://events.spacepole.be/event/204/
* Nov 25 - 27, STCE course: Space Weather impacts on ionospheric wave propagation, focus on GNSS and HF, Brussels, Belgium - Registrations are open, https://events.spacepole.be/event/206/
* Dec 5-6, STCE Course Space Weather impacts on aviation, Brussels, Belgium - Registrations are open, https://events.spacepole.be/event/205/
To register for a course or lecture, check the page of the STCE Space Weather Education Center: https://www.stce.be/SWEC
If you want your event in the STCE newsletter, contact us: stce_coordination at stce.be