- Table of Content
- 1.First solar ob...
- 2.PITHIA-NRF Tra...
- 3.Review of Spac...
- 4.International ...
- 5.PROBA2 Observa...
- 6.Noticeable Sol...
- 7.Geomagnetic Ob...
- 8.The SIDC Space...
- 9.Review of Iono...
- 10.Upcoming Activ...
2. PITHIA-NRF Trans-National Access Open Call
3. Review of Space Weather
4. International Sunspot Number by SILSO
5. PROBA2 Observations
6. Noticeable Solar Events
7. Geomagnetic Observations in Belgium
8. The SIDC Space Weather Briefing
9. Review of Ionospheric Activity
10. Upcoming Activities
First solar observations with SPADE
Deep in the hills of the Belgian Ardennes, near the tiny village of Humain, lies the STCE's radio-astronomy station. While the site may seem dormant, and even a bit abandoned, we continue to make daily radio-observations there that our crucial for our space weather prediction center as well as our research on solar activity. And thus we also keep innovating by improving our instrumentation, and implementing new techniques.
In the past couple of weeks, the radio-astronomy team has worked relentlessly on a new setup and calibration procedure for the 2 receivers which are part of the SPADE instrument. SPADE stands for Small Phased Array Demonstrator and is a small array of 8 antennas. SPADE has as main advantage that it has no technical moving parts. And we all know that moving parts can more easily break, which is quite inconvenient when the engineers and technicians are located in Brussels, more than a 100 km away.
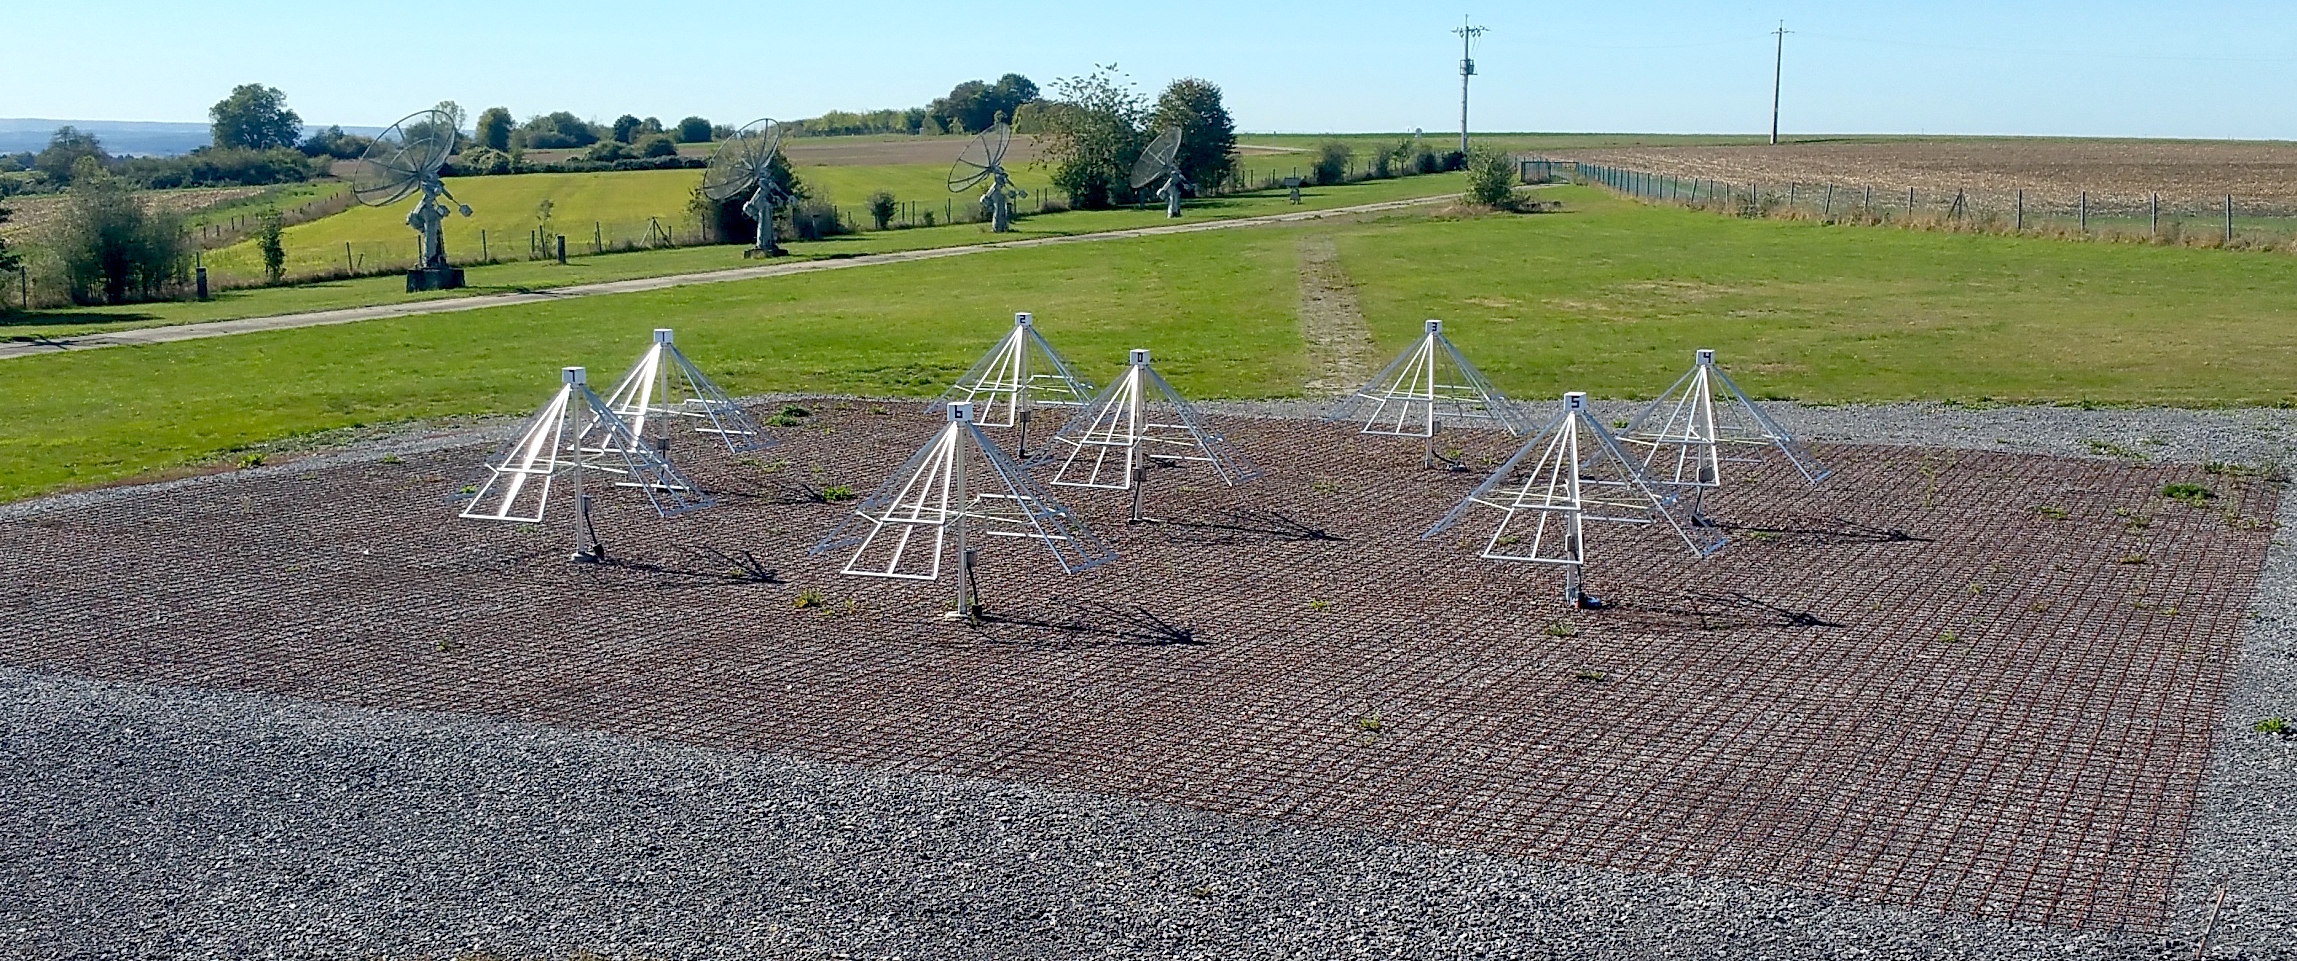
The principle of SPADE is that by adding the signal of all channels, we can make a virtual antenna (even more sensitive than each individual antenna) pointing at the zenith. If we take for example, the central antenna as a reference, we can point the array towards the Sun by delaying the signal of each antenna with respect to the reference. In practice this is done by multiplying each channel by a certain phase. This phase is calculated according to geometrical considerations and the position of the Sun in the sky.
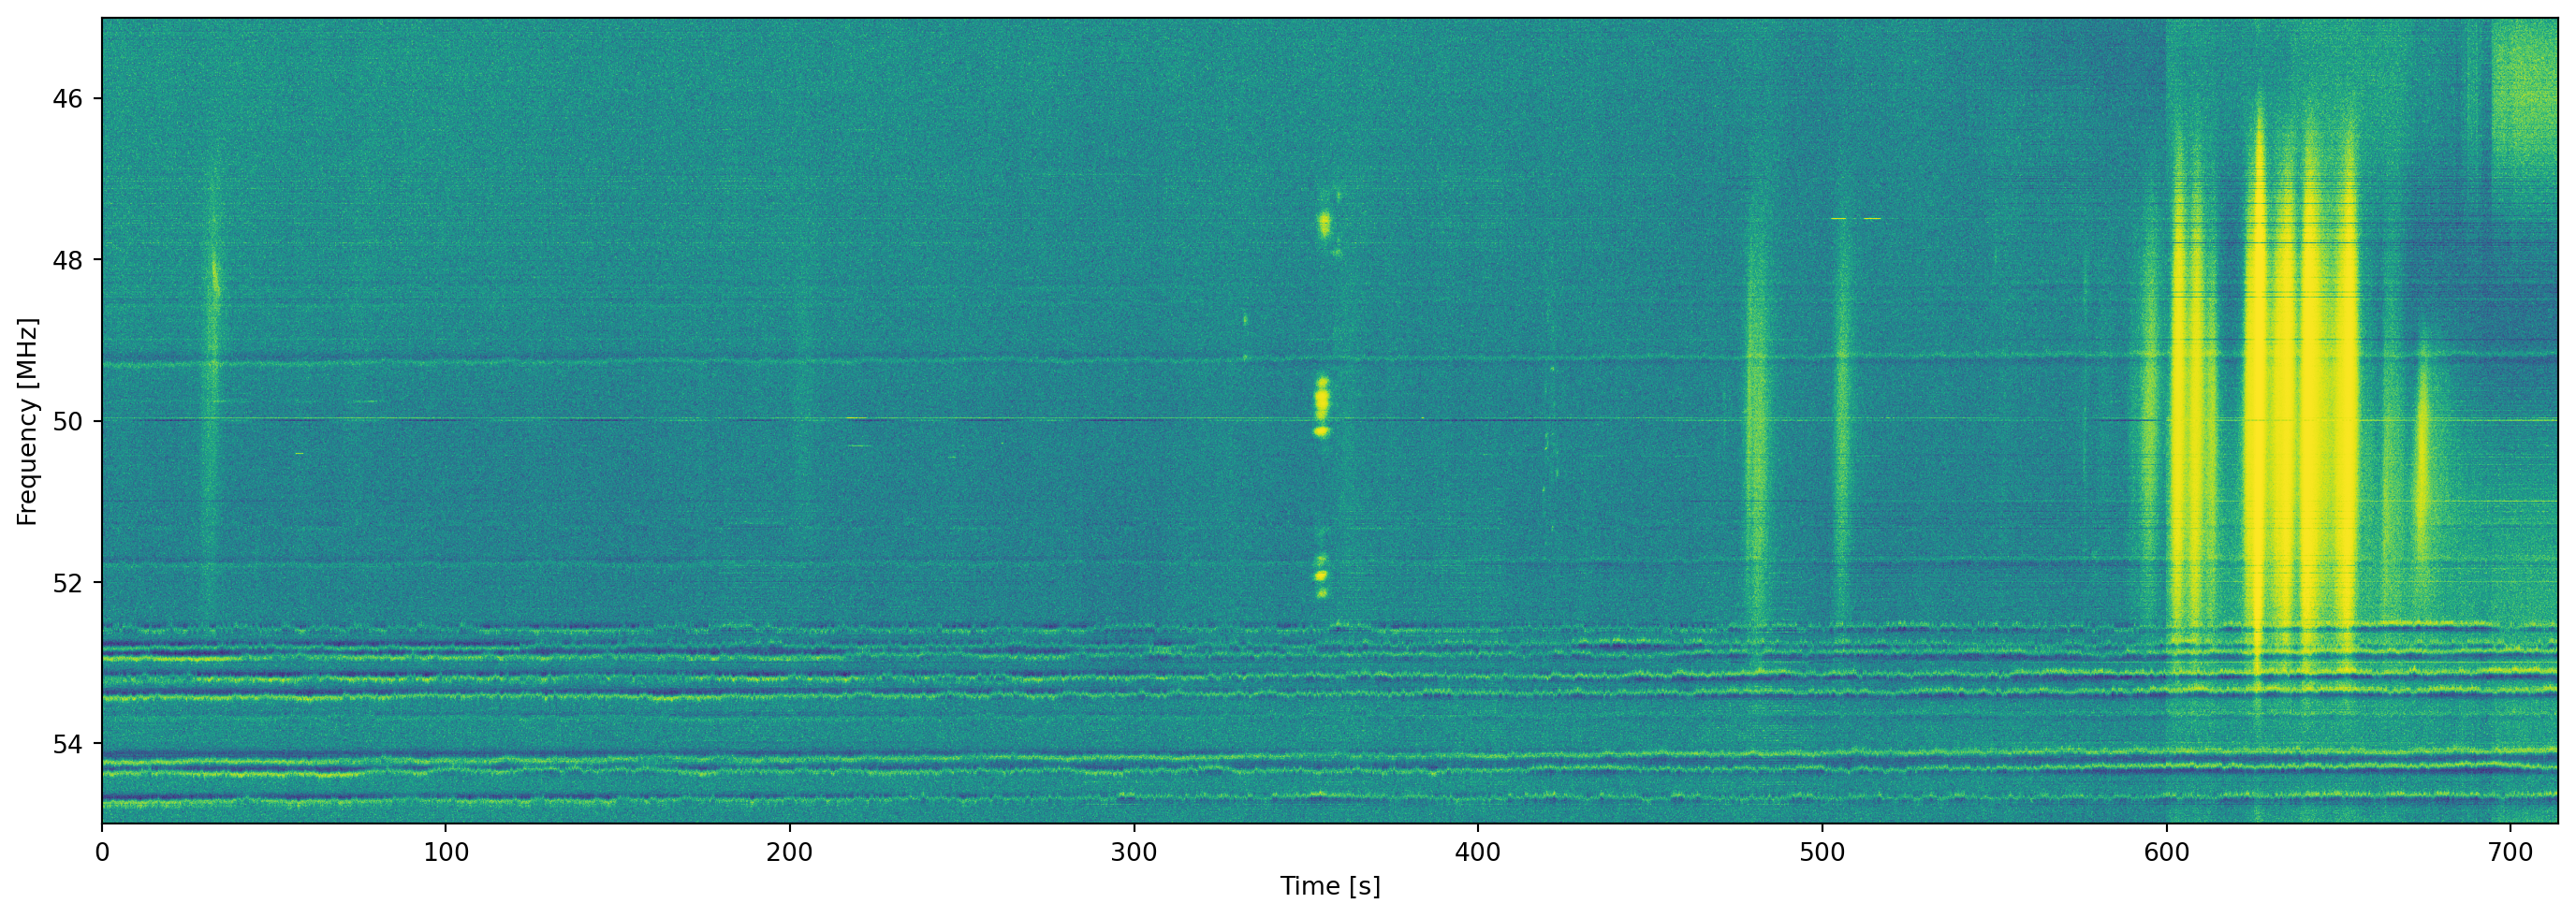
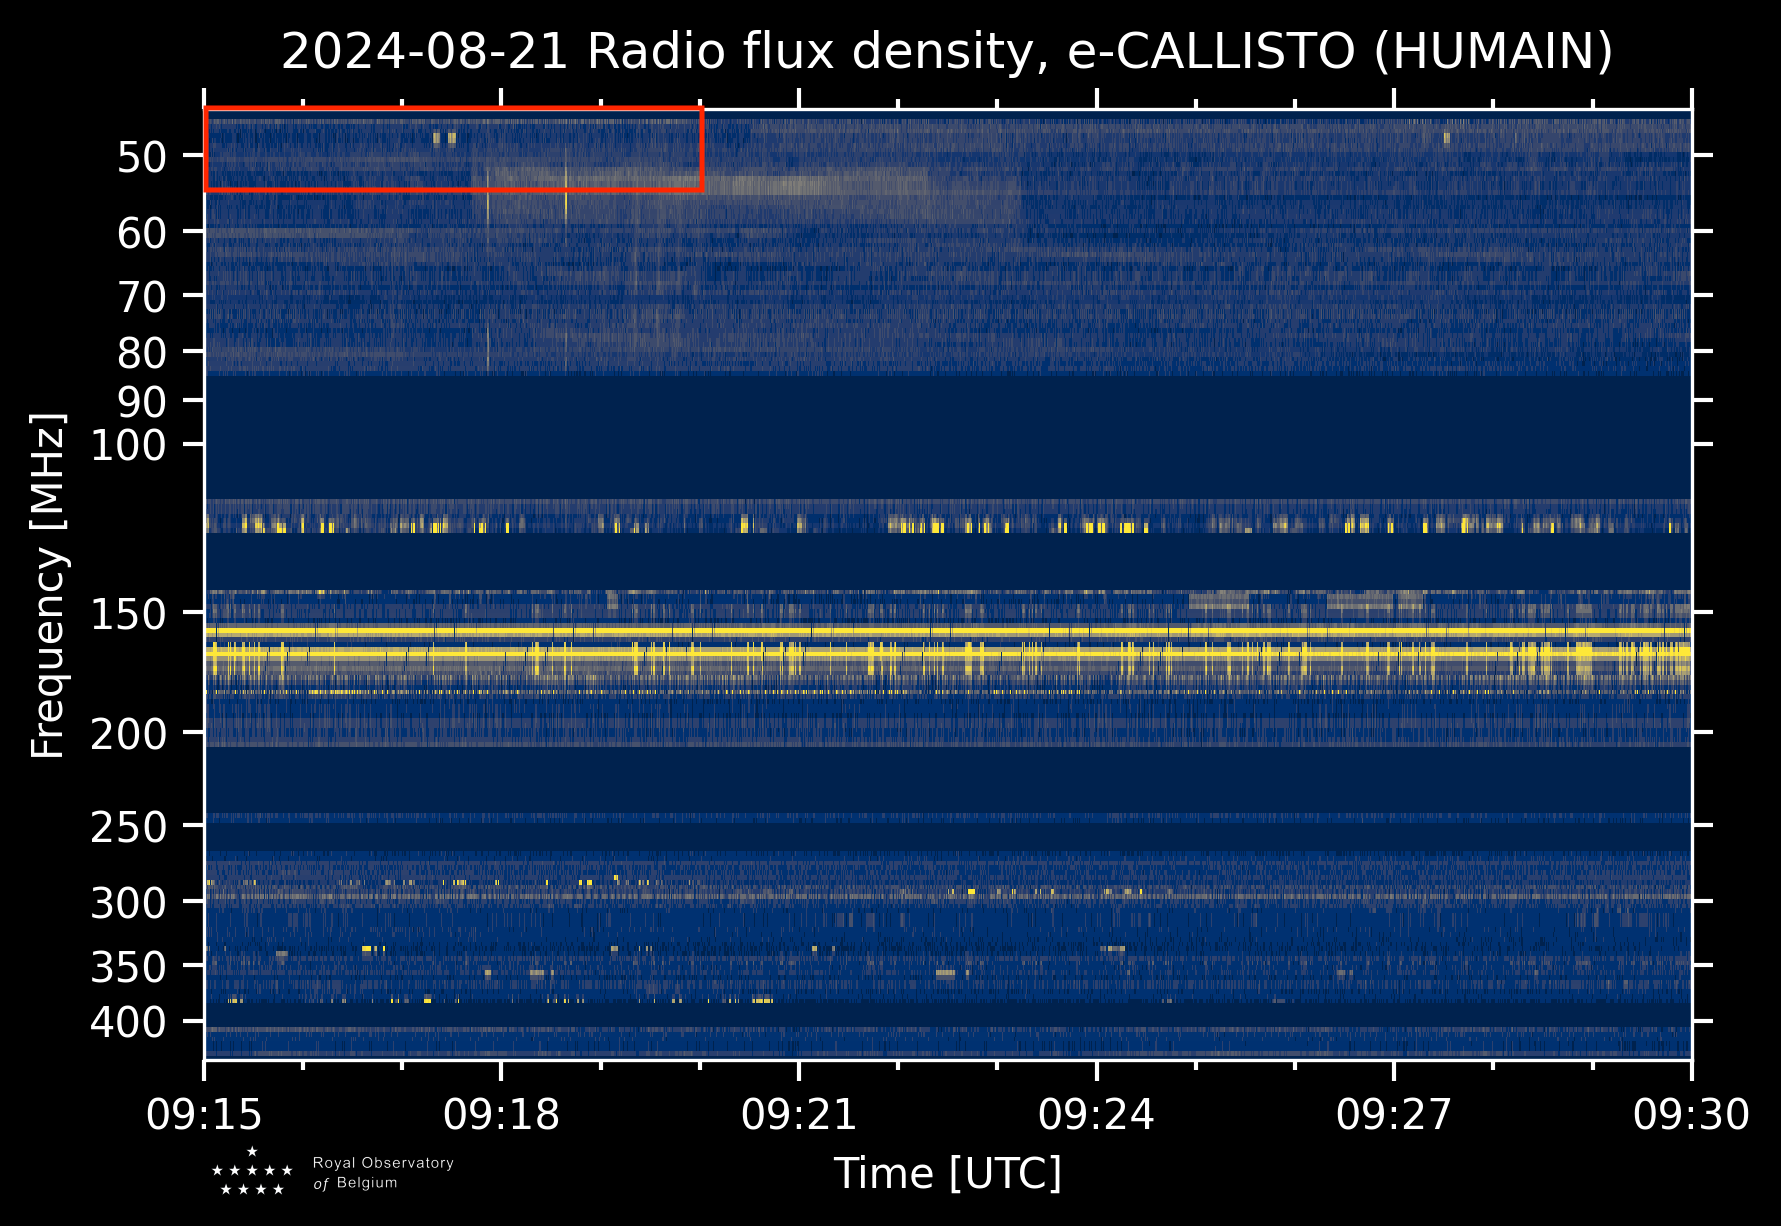
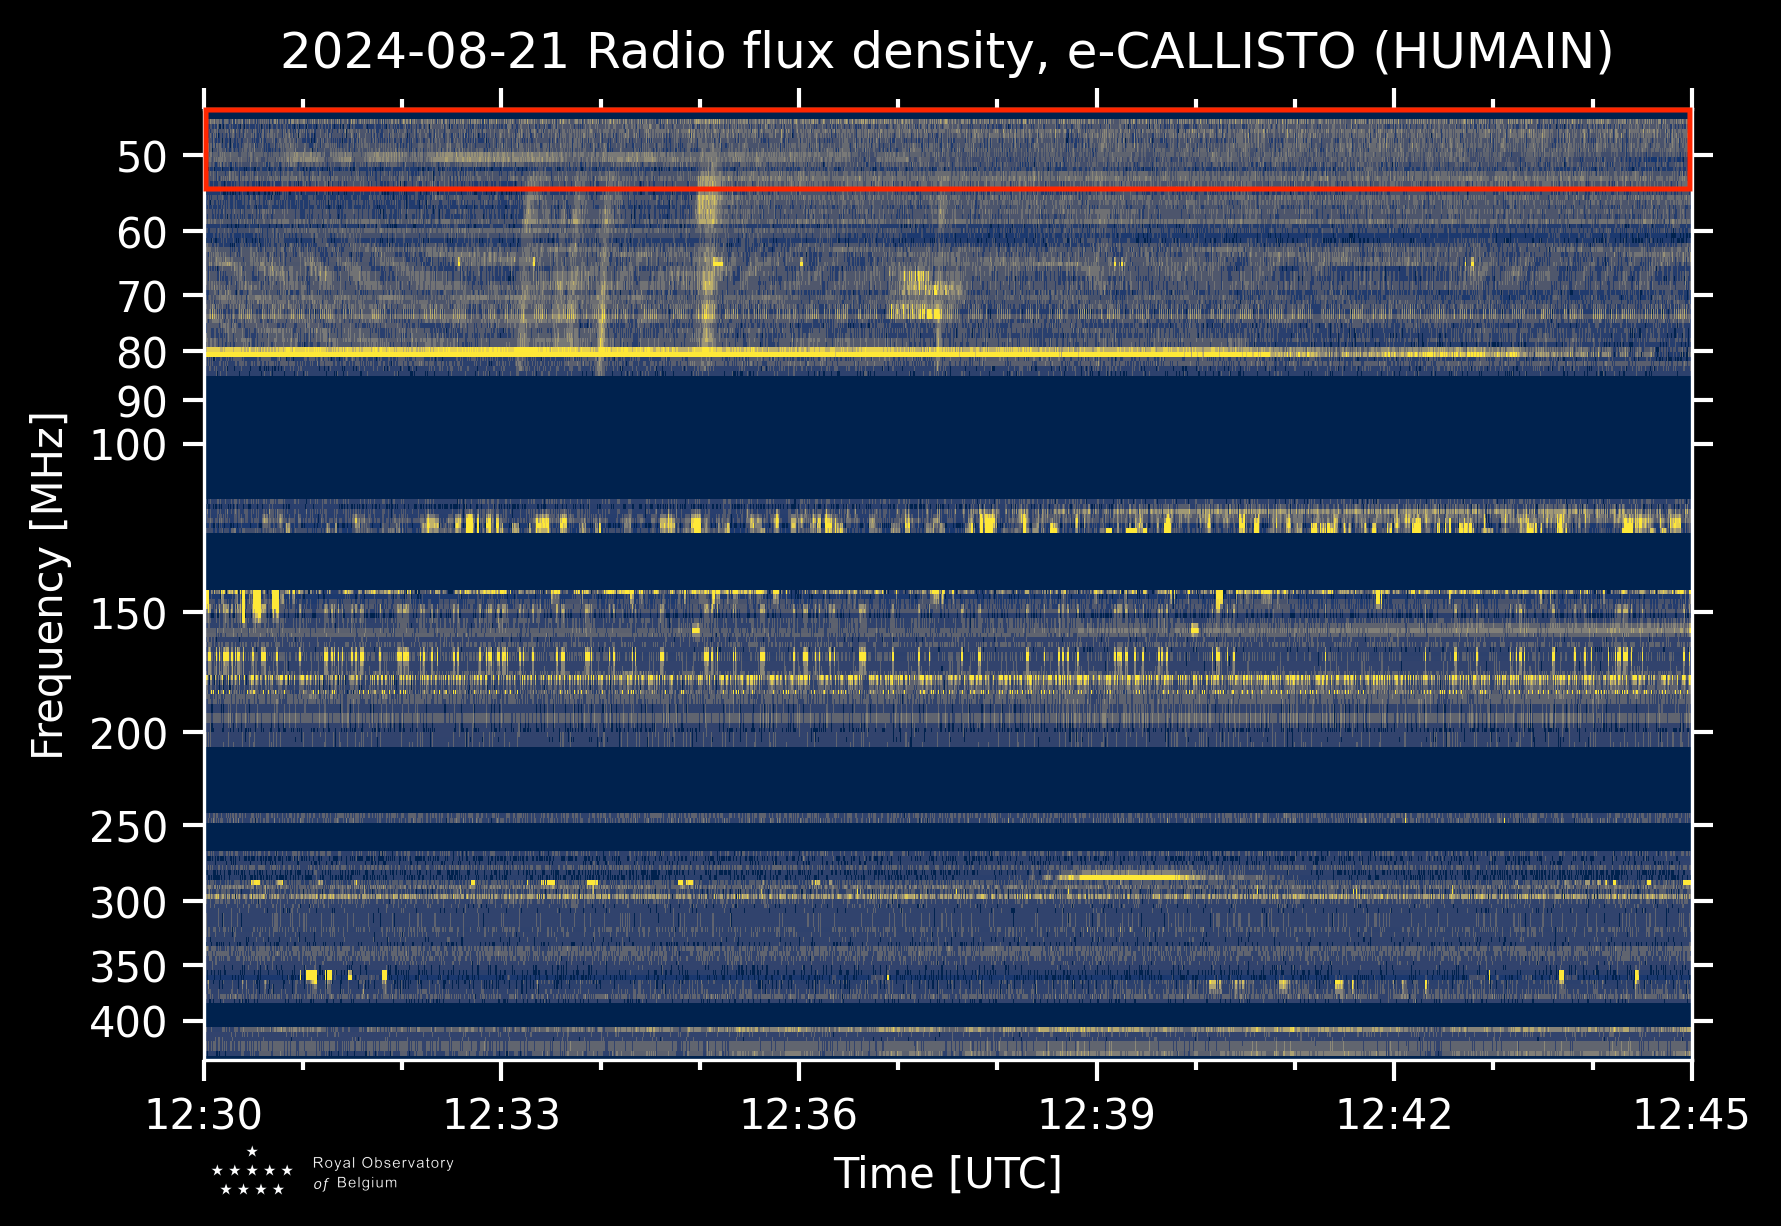
First Observation
After adding up the 8 channels, we make a spectrum and then observe for a while to make a dynamic spectrum such as the one below. This image shows almost 12 minutes of observations between 09:08 UT and 09:20 UT on August 21 2024. A CALLISTO spectrum from Humain is shown for comparison, with the corresponding frequency band highlighted in red. Note that the CALLISTO spectrum starts at 09:15 UT only. We see on the SPADE spectrum a group of type III bursts, barely visible on CALLISTO. This highlights the complementarity of these different instruments that are operating side by side in Humain.
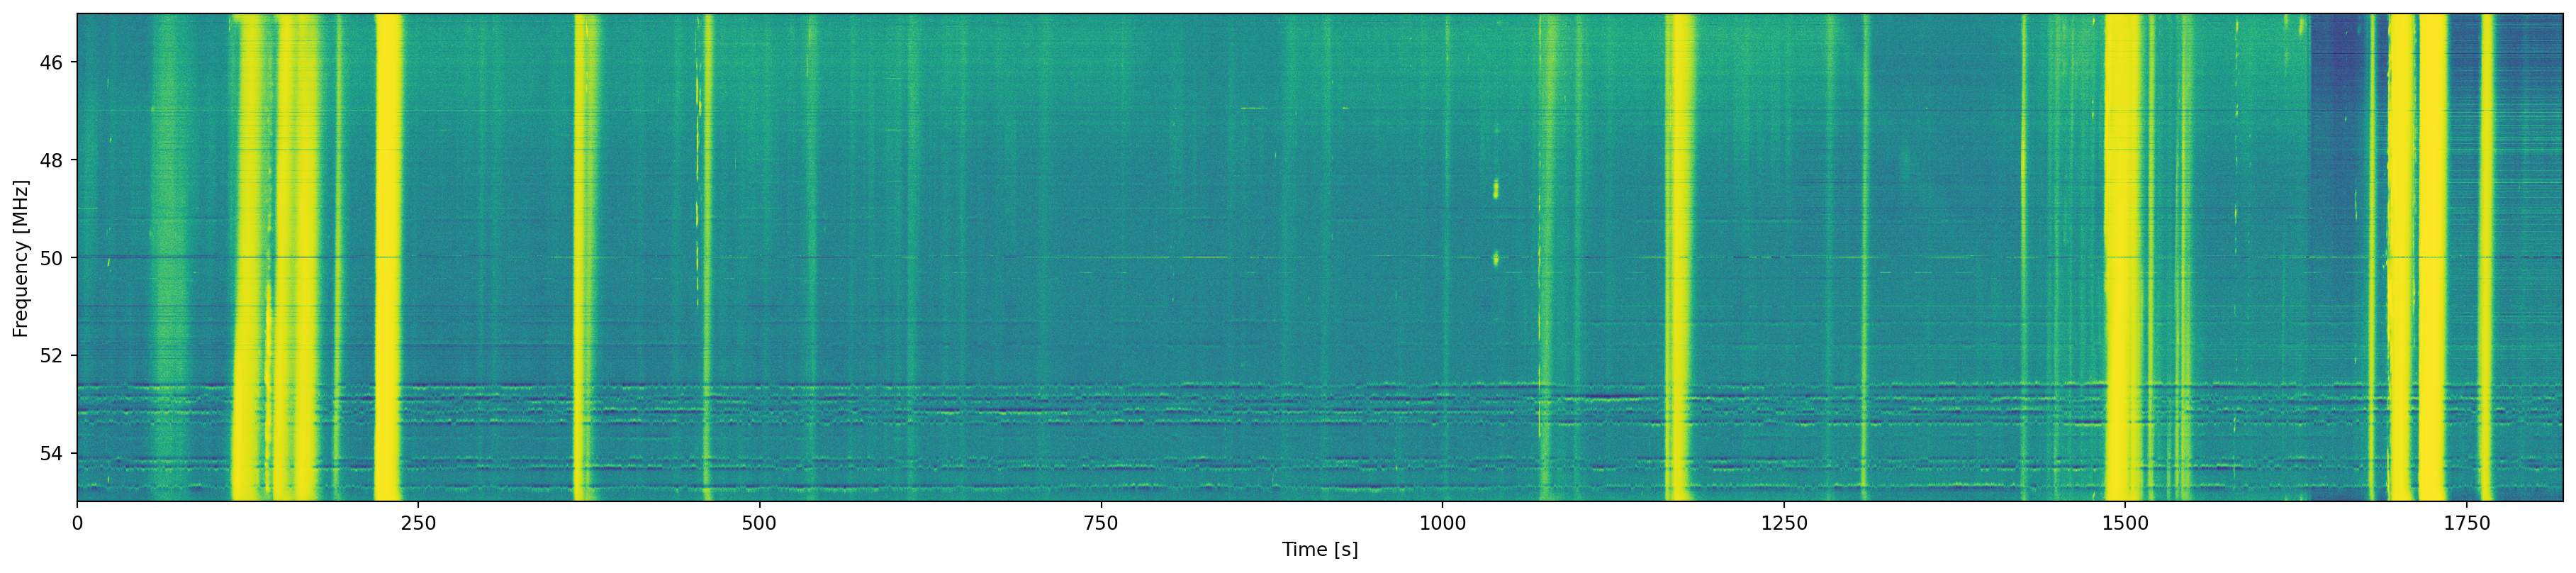
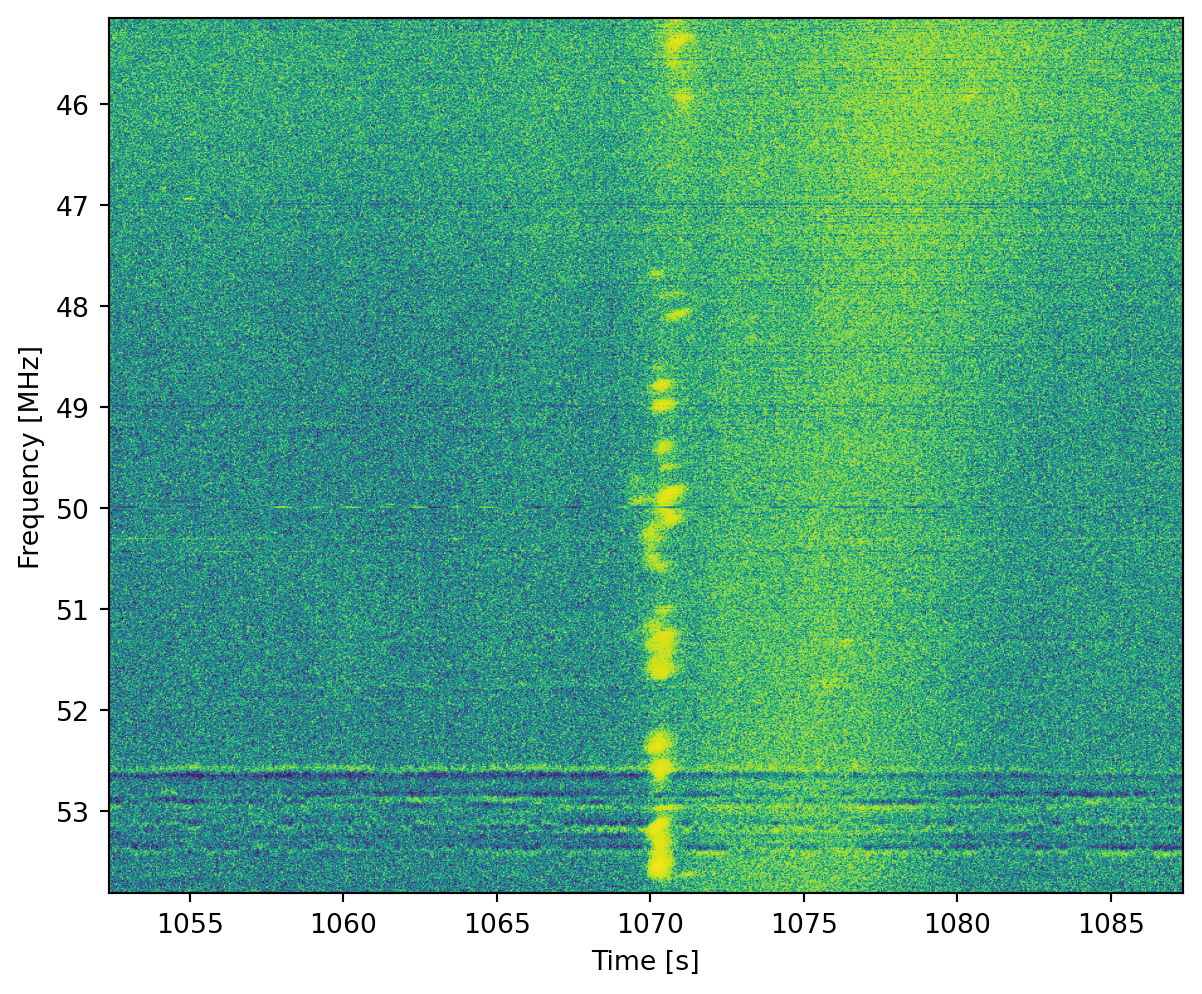
More fun with SPADE
Still on August 21, we observed for about 30 minutes with SPADE, and caught a type III storm, linked to the large sunspot groups currently visible on the solar disk. Nothing is visible with CALLISTO due to its much lower sensitivity. The SPADE spectrum also shows fine structure for some of the type IIIs, called stria bursts, which are linked to inhomogeneities in the corona. And so SPADE opens the door to new research: who knows what else we will see?
PITHIA-NRF Trans-National Access Open Call
PITHIA-NRF launches its seventh call. This is the FINAL call in the frame of PITHIA-NRF project to provide effective and convenient access to the best European research facilities for observations of the upper atmosphere, including the plasmasphere, ionosphere and thermosphere. The access is organised through the Trans-National Access (TNA) programme, and provides an opportunity for researcher and other users to execute and carry out their own projects at one of the PITHIA-NRF research facilities, including the STCE.
The call is open from 15 August 2024. It is an Open Call and applications are handled as they arrive with typical evaluation times of 2 to 3 weeks. If accepted the projects can commence for organisation and realisation from September 2024 and the project report must be submitted at the latest by the end of February 2025. The call closes on 27 September 2024.
More information about the call can be obtained from the call website: https://pithia-nrf.eu/pithia-nrf-users/tna/tna-calls/seventh-tna-call
Access can be requested by scientific users from academia, Small and Medium Enterprises, large companies and public organizations by propose a scientific project and fill in the online application form (https://pithia-nrf.eu/forms/tna-application-form-7).
Review of Space Weather
WEEK 1233 from 2024 Aug 12
Solar Active Regions and flares
Solar flaring activity was at mainly moderate levels throughout the week and reached high levels on August 14. There were a total number of 19 active regions (ARs) observed on the visible solar disk over the week. A total of 24 C-class flares, 17 M-class flares and 1 X-class flares were observed. The strongest of which was a X1.11-flare, with peak time at 06:40 UTC on August 14 and is associated with NOAA AR 3784. NOAA AR 3774, 3777, 3780, 3784 and 3790 all produced M-class flares this week.
Coronal mass ejections
Multiple Coronal Mass Ejections (CMEs) were observed during the week. Of the ones analyzed one had an Earth-directed component: a partial halo CME which was seen in LASCO-C2 data at 09:50 UTC on August 14. This CME was associated with the X1.11-flare on August 14 and arrived at Earth around 13:30 UTC on August 17.
Coronal Holes
A negative polarity, mid-latitude Coronal Hole (CH) began to transition across the central meridian in the northern hemisphere on August 12. A second positive polarity, high-latitude CH began to transition the central meridian in the southern hemisphere on August 15. No impact was seen of the associated high-speed streams of either of the CHs.
Proton flux levels
The greater than 10 MeV GOES proton flux was below the 10pfu threshold for the entire week.
Electron fluxes at GEO
The greater than 2 MeV electron flux remained below the 1000 pfu threshold.
The 24h electron fluence was at nominal levels.
Solar wind
At the beginning of the week the solar wind was under the influence of an ICME and the solar wind speed varied between 408 km/s and 534 km/s. The interplanetary magnetic field varied between 8nT and 23 nT, with the Bz reaching a minimum value of -20 nT.
The solar wind returned to the slow solar wind regime on August 14 and became perturbed again on August 17 because of an ICME arrival associated with the partial halo CME from August 14. A shock was observed in the solar wind around 13:30 UTC on August 17. The interplanetary magnetic field jumped from 7nT to 17 nT, the solar wind speed increased from 324 km/s to 430 km/s, and the solar wind density rose from 2 particles/cm3 to 12 particles/cm3.
Geomagnetism
Geomagnetic conditions reached severe storm levels globally (Kp=8) and moderate storm levels locally (Kbel=6) on August 12, due to an ICME passage. The geomagnetic conditions returned to quiet to unsettled levels on August 14. On August 17 they reached mayor storm levels globally (Kp=7) and moderate storm levels locally (Kbel=6), due to the passage of another ICME and returned to quiet and unsettled levels on August 19.
International Sunspot Number by SILSO

The daily Estimated International Sunspot Number (EISN, red curve with shaded error) derived by a simplified method from real-time data from the worldwide SILSO network. It extends the official Sunspot Number from the full processing of the preceding month (green line), a few days more than one solar rotation. The horizontal blue line shows the current monthly average. The yellow dots give the number of stations that provided valid data. Valid data are used to calculate the EISN. The triangle gives the number of stations providing data. When a triangle and a yellow dot coincide, it means that all the data is used to calculate the EISN of that day.
PROBA2 Observations
Solar Activity
Solar flare activity fluctuated from moderate to high during the week.
In order to view the activity of this week in more detail, we suggest to go to the following website from which all the daily (normal and difference) movies can be accessed: https://proba2.oma.be/ssa
This page also lists the recorded flaring events.
A weekly overview movie can be found here (SWAP week 751): https://proba2.sidc.be/swap/data/mpg/movies/weekly_movies/weekly_movie_2024_08_12.mp4
Details about some of this week's events can be found further below.
If any of the linked movies are unavailable they can be found in the P2SC movie repository here: https://proba2.oma.be/swap/data/mpg/movies/
Wednesday Aug 14
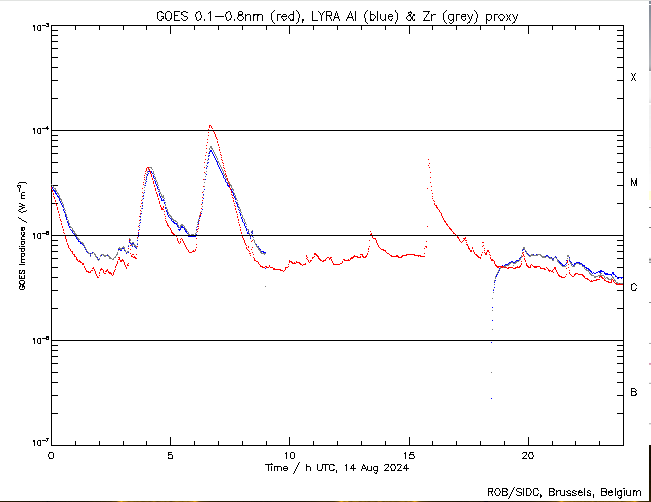
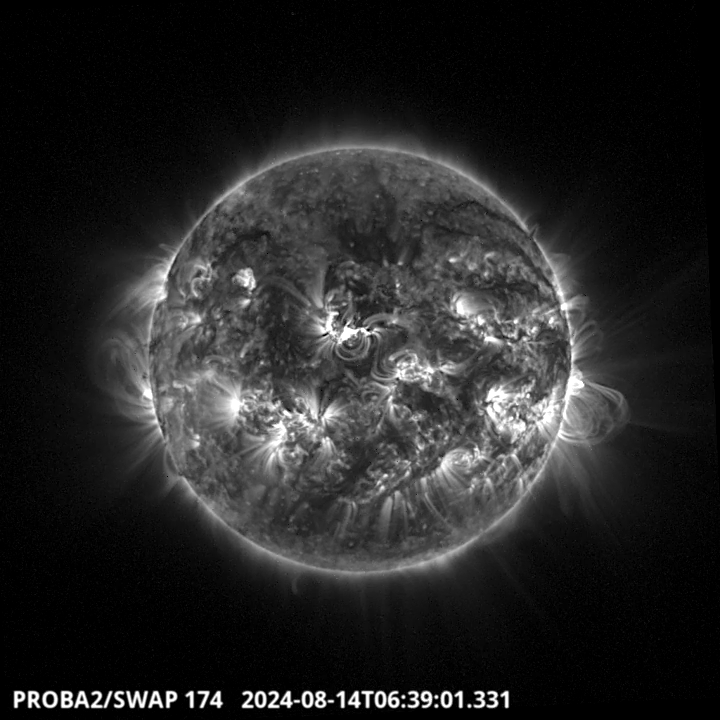
The biggest flare of the week is a X1.1 captured by LYRA and SWAP. It was produced around 6:40 UT by the NOAA active region 3784 located in the North East part of the solar disk. Find a SWAP movie of the event here: https://proba2.sidc.be/swap/movies/20240814_swap_movie.mp4
Noticeable Solar Events
| DAY | BEGIN | MAX | END | LOC | XRAY | OP | 10CM | TYPE | Cat | NOAA |
| 12 | 0823 | 0848 | 0859 | M1.0 | VI/2 | 44 | 3777 | |||
| 12 | 2247 | 2257 | 2304 | M1.2 | 3784 | |||||
| 13 | 1725 | 1729 | 1734 | N15E11 | M1.0 | SF | 3784 | |||
| 13 | 2238 | 2245 | 2257 | M1.3 | III/1 | 44 | 3777 | |||
| 13 | 2326 | 2344 | 0006 | N13E7 | M4.2 | 1 | III/2 | 3784 | ||
| 14 | 0333 | 0402 | 0427 | M4.4 | 3774 | |||||
| 14 | 0600 | 0640 | 0708 | N12E5 | X1.1 | 2 | VI/2IV/1II/2 | 3784 | ||
| 14 | 1316 | 1324 | 1338 | M1.0 | III/1 | 3784 | ||||
| 14 | 1539 | 1549 | 1557 | N14W1 | M5.3 | S | III/2 | |||
| 15 | 0335 | 0348 | 0356 | S10W62 | M1.1 | SF | 45 | 3780 | ||
| 16 | 1313 | 1324 | 1335 | M1.3 | III/2 | 3780 | ||||
| 17 | 1024 | 1033 | 1042 | N17W42 | M1.6 | 1N | III/2 | 3784 | ||
| 17 | 1122 | 1144 | 1156 | S16W23 | M1.1 | SF | 3785 | |||
| 17 | 2137 | 2148 | 2157 | S9E47 | M1.1 | 1 | 3790 | |||
| 17 | 2157 | 2206 | 2214 | M1.4 | 3790 | |||||
| 18 | 0150 | 0204 | 0212 | M2.4 | 3784 | |||||
| 18 | 0407 | 0416 | 0431 | M1.1 | 3784 | |||||
| 18 | 0715 | 0730 | 0744 | N18W52 | M1.2 | SF | 3784 | |||
| 18 | 2052 | 2107 | 2122 | M1.3 | 3796 | |||||
| 18 | 2346 | 0013 | S4E70 | M1.4 | SF | 3796 |
| LOC: approximate heliographic location | TYPE: radio burst type |
| XRAY: X-ray flare class | Cat: Catania sunspot group number |
| OP: optical flare class | NOAA: NOAA active region number |
| 10CM: peak 10 cm radio flux |
Geomagnetic Observations in Belgium
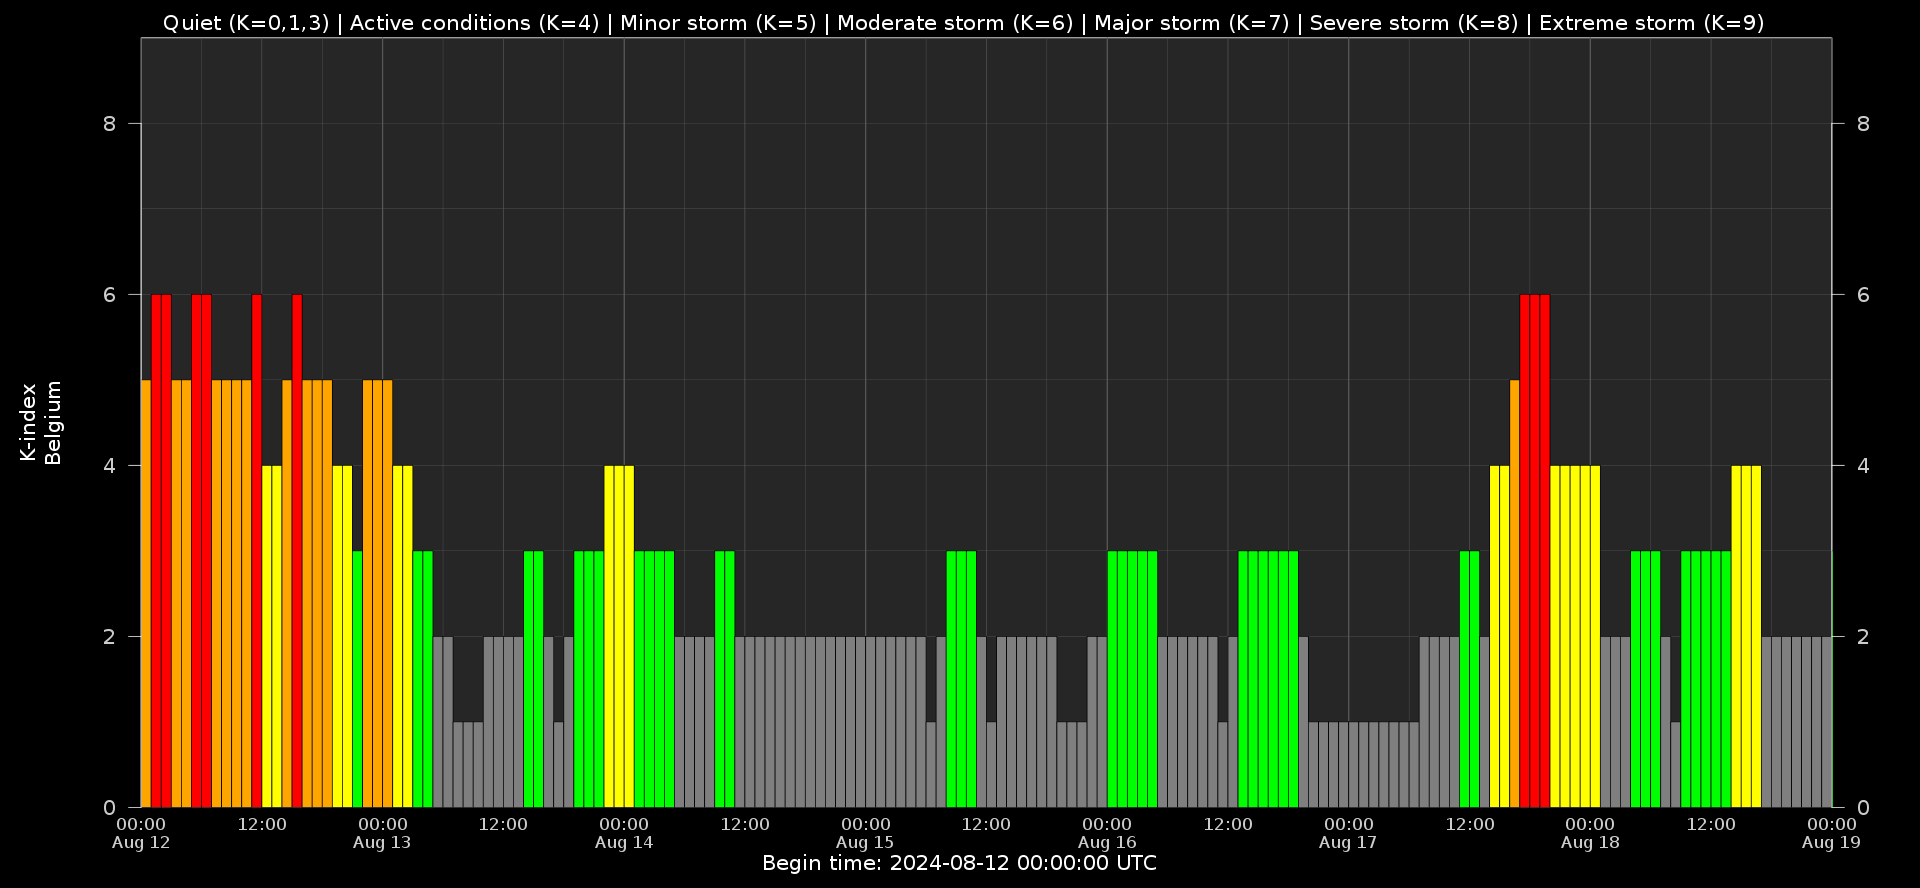
Local K-type magnetic activity index for Belgium based on data from Dourbes (DOU) and Manhay (MAB). Comparing the data from both measurement stations allows to reliably remove outliers from the magnetic data. At the same time the operational service availability is improved: whenever data from one observatory is not available, the single-station index obtained from the other can be used as a fallback system.
Both the two-station index and the single station indices are available here: http://ionosphere.meteo.be/geomagnetism/K_BEL/
The SIDC Space Weather Briefing
The forecaster on duty presented the SIDC briefing that gives an overview of space weather from August 11 to 18.
The pdf of the presentation can be found here: https://www.stce.be/briefings/20240819_SWbriefing.pdf
Review of Ionospheric Activity


VTEC time series at 3 locations in Europe from 12 Aug 2024 till 18 Aug 2024
The top figure shows the time evolution of the Vertical Total Electron Content (VTEC) (in red) during the last week at three locations:
a) in the northern part of Europe(N 61deg E 5deg)
b) above Brussels(N 50.5deg, E 4.5 deg)
c) in the southern part of Europe(N 36 deg, E 5deg)
This top figure also shows (in grey) the normal ionospheric behaviour expected based on the median VTEC from the 15 previous days.
The time series below shows the VTEC difference (in green) and relative difference (in blue) with respect to the median of the last 15 days in the North, Mid (above Brussels) and South of Europe. It thus illustrates the VTEC deviation from normal quiet behaviour.
The VTEC is expressed in TECu (with TECu=10^16 electrons per square meter) and is directly related to the signal propagation delay due to the ionosphere (in figure: delay on GPS L1 frequency).
The Sun's radiation ionizes the Earth's upper atmosphere, the ionosphere, located from about 60km to 1000km above the Earth's surface.The ionization process in the ionosphere produces ions and free electrons. These electrons perturb the propagation of the GNSS (Global Navigation Satellite System) signals by inducing a so-called ionospheric delay.
See http://stce.be/newsletter/GNSS_final.pdf for some more explanations; for more information, see https://gnss.be/SpaceWeather
Upcoming Activities
Courses and presentations with the Sun-Space-Earth system and Space Weather as the main theme. We provide occasions to get submerged in our world through educational, informative and instructive activities.
* Aug 25, public lecture Help! Het stormt in de ruimte!?, ATB Natuurvrienden, Aarschot, Belgium
* Sep 27, STCE at the Wisenight Science festival in the Planetarium, Brussel, https://wisenight.eu/
* Sep 30 - Oct 3, STCE Space Weather Introductory Course, Brussels, Belgium - Registrations are complete - https://events.spacepole.be/event/204/
* Nov 25 - 27, STCE course: Space Weather impacts on ionospheric wave propagation, focus on GNSS and HF, Brussels, Belgium - Registrations are open, https://events.spacepole.be/event/206/
* Dec 5-6, STCE Course Space Weather impacts on aviation, Brussels, Belgium - Registrations are open, https://events.spacepole.be/event/205/
To register for a course or lecture, check the page of the STCE Space Weather Education Center: https://www.stce.be/SWEC
If you want your event in the STCE newsletter, contact us: stce_coordination at stce.be