- Table of Content
- 1.Help! It storm...
- 2.Call for Guest...
- 3.PROBA2 Observa...
- 4.Review of spac...
- 5.International ...
- 6.Noticeable Sol...
- 7.Geomagnetic Ob...
- 8.The SIDC Space...
- 9.Review of Iono...
- 10.Courses, semin...
2. Call for Guest Investigators
3. PROBA2 Observations (19 Aug 2024 - 25 Aug 2024)
4. Review of space weather
5. International Sunspot Number by SILSO
6. Noticeable Solar Events
7. Geomagnetic Observations in Belgium
8. The SIDC Space Weather Briefing
9. Review of Ionospheric Activity
10. Courses, seminars and presentations
Help! It storms in space!?
Space and storms, it fascinates people. The STCE combines both: space storms. An easy way to catch the attention of your public.
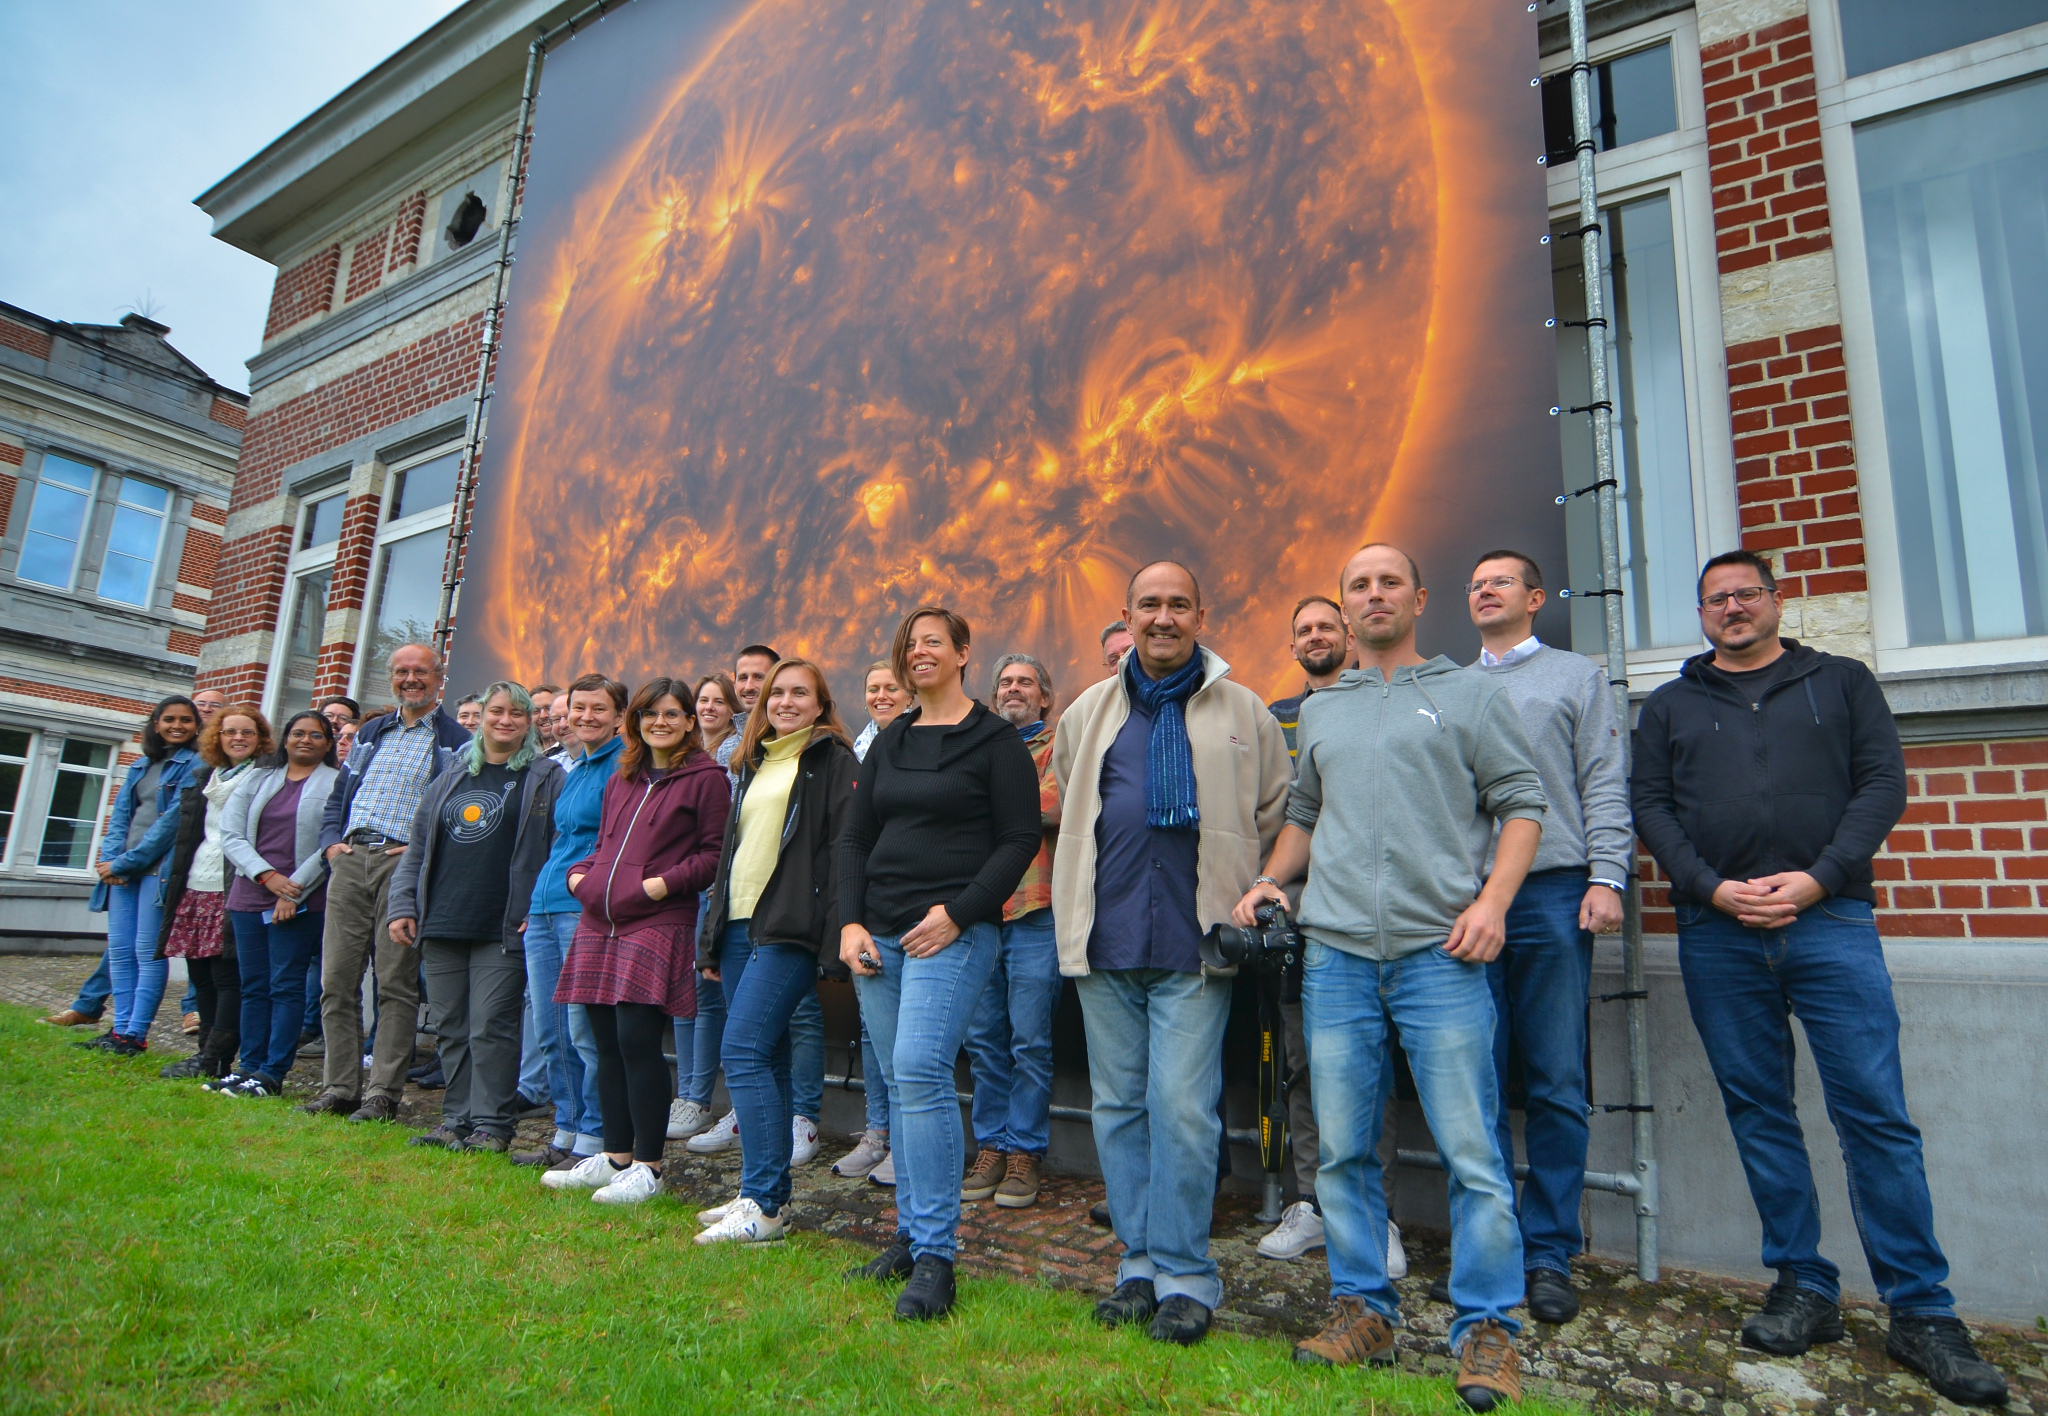
.jpeg)
This is a photo taken during a public presentation 'Help! It storms in space!?' last Sunday.
'It is September 1 in the year 1859, in the morning. Carrington, a solar physicist watches a flash on the sun. A day later, the sky was in flames. The telegraph crackled and sparked. What was this?
What people saw was the result of an enormous solar storm that crashed the earth. That was then. Now, 2024, this could happen again. Storms escape at regular intervals from the sun some 150 million km away from us and can sweep across the earth.
Do you want to know what this means for us? Come and listen to space weather expert from the STCE, a solar observatory.'
Call for Guest Investigators

The EUI and SWAP/LYRA PI teams welcome research proposals for the 2025 round of their Guest Investigator Program for research based on EUI, SWAP and/or LYRA data analysis by scientists outside the PI teams.
Selected proposers will be invited to spend a few weeks with the PI team at the Royal Observatory in Brussels to obtain expert knowledge on the instruments, to participate in the planning of observations according to the needs of their proposal, and to conduct their research.
Each Guest Investigator may receive reimbursement for travel, accommodation and living expenses.
Proposals must be received by November 1, 2024 (23:59 CET) and visits should be scheduled in 2025.
Details on the 2025 Guest Investigator Call can be found on this webpage: https://www.sidc.be/GuestInvestigator/GI_call_2025
When selected, you will get to work with these wonderful people:
PROBA2 Observations (19 Aug 2024 - 25 Aug 2024)
Solar Activity
Solar flare activity fluctuated from low to moderate during the week.
In order to view the activity of this week in more detail, we suggest to go to the following website from which all the daily (normal and difference) movies can be accessed: https://proba2.oma.be/ssa
This page also lists the recorded flaring events.
A weekly overview movie (SWAP week 752) can be found here: https://proba2.sidc.be/swap/data/mpg/movies/weekly_movies/weekly_movie_2024_08_19.mp4.
Details about some of this week's events can be found further below.
If any of the linked movies are unavailable they can be found in the P2SC movie repository here: https://proba2.oma.be/swap/data/mpg/movies/.
Friday August 23
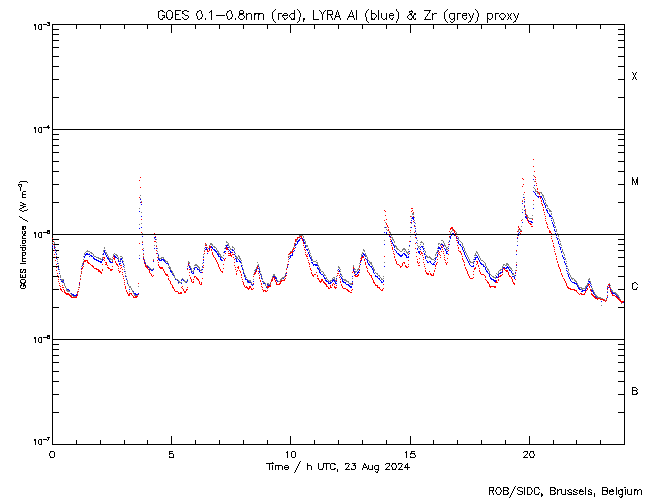
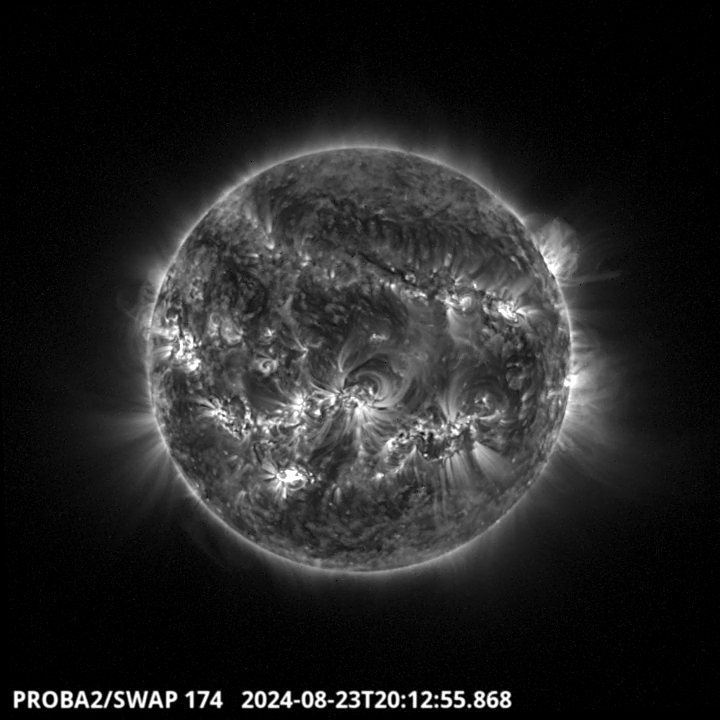
The largest flare of this week was an M5.1, and it was observed by LYRA (top panel) and SWAP (bottom panel). The flare peaked on 2024-Aug-23 at 20:12 UT. It occurred in the south-eastern quadrant of the Sun, originating from NOAA AR3800.
Find a SWAP movie of the event here: https://proba2.sidc.be/swap/movies/20240823_swap_movie.mp4.
Review of space weather
Solar Active Regions (ARs) and flares
Solar flaring activity was moderate throughout the week. Seventeen (17) active regions were observed on the visible solar disk and 35 C-class flares, 17 M-class flares were measured. The strongest flares were the M5.1 flare on August 21 (peak time 22:08 UTC from NOAA AR 3796) and the M5.1 on August 22 (peak time 22:08 UTC from NOAA AR 3800). NOAA AR 3796, 3800, 3801 were the most active and produced the M-class flares.
Coronal mass ejections
This week, there was one CME (Coronal Mass Ejection) with an Earth directed component, seen in LASCO-C2 data on August 23 at 02:06 UTC. This CME was most probably associated with the C5.9-flare on August 23 at 01.26 UTC from NOAA AR 3794.
Coronal Holes
Two small negative polarity mid-latitude Coronal Holes (CHs) crossed the central meridian in the northern hemisphere on August 19, and August 20 respectively. No impact was seen of the associated high-speed streams of either of the CHs.
Proton flux levels
The greater than 10 MeV GOES proton flux was below the 10pfu threshold for the entire week.
Electron fluxes at GEO
The greater than 2 MeV electron flux remained below the 1000 pfu threshold. The 24h electron fluence was at nominal levels.
Solar wind
At the very start of the week the solar wind at Earth was still under the influence of an ICME, but soon returned to slow solar wind conditions for the entire week. The solar wind was stable around 350 km/s and the interplanetary magnetic field was around 7nT, with the Bz reaching a minimum value of -10 nT.
Geomagnetism
Geomagnetic conditions were mainly quiet to unsettled levels (Kp 3) both globally and locally over the week.
International Sunspot Number by SILSO
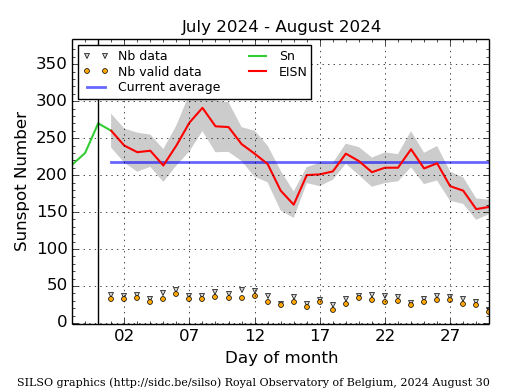
The daily Estimated International Sunspot Number (EISN, red curve with shaded error) derived by a simplified method from real-time data from the worldwide SILSO network. It extends the official Sunspot Number from the full processing of the preceding month (green line), a few days more than one solar rotation. The horizontal blue line shows the current monthly average. The yellow dots give the number of stations that provided valid data. Valid data are used to calculate the EISN. The triangle gives the number of stations providing data. When a triangle and a yellow dot coincide, it means that all the data is used to calculate the EISN of that day.
Noticeable Solar Events
| DAY | BEGIN | MAX | END | LOC | XRAY | OP | 10CM | TYPE | Cat | NOAA |
| 19 | 0928 | 0936 | 0940 | S14W57 | M1.3 | SF | 50 | 3785 | ||
| 19 | 2141 | 2152 | 2202 | S3E56 | M3.7 | 1N | 58 | 3796 | ||
| 20 | 0437 | 0448 | 0454 | M1.2 | VI/1 | 58 | 3796 | |||
| 20 | 1706 | 1708 | 1712 | S13W81 | M1.3 | SF | 50 | 3785 | ||
| 21 | 0553 | 0602 | 0611 | S2E41 | M1.1 | S | VI/2 | 58 | 3796 | |
| 21 | 2159 | 2208 | 2217 | S3E31 | M5.1 | 2N | 58 | 3796 | ||
| 22 | 1032 | 1039 | 1047 | S3E24 | M1.5 | 1N | 58 | 3796 | ||
| 23 | 0331 | 0341 | 0345 | M3.4 | II/1 | 62 | 3801 | |||
| 23 | 0412 | 0418 | 0424 | S27E32 | M1.0 | SF | 60 | 3800 | ||
| 23 | 1350 | 1357 | 1410 | S27E25 | M1.7 | SN | VI/1 | 60 | 3800 | |
| 23 | 1452 | 1505 | 1513 | N9E60 | M1.7 | S | 62 | 3801 | ||
| 23 | 1633 | 1645 | 1700 | S27E23 | M1.1 | S | 60 | 3800 | ||
| 23 | 1923 | 1933 | 1939 | N11E56 | M1.1 | 1N | 62 | 3801 | ||
| 23 | 1939 | 1944 | 1949 | M3.4 | 60 | 3800 | ||||
| 23 | 2008 | 2012 | 2018 | S25E22 | M5.1 | 1 | 60 | 3800 | ||
| 24 | 0002 | 0014 | 0020 | S4E1 | M1.6 | SF | 58 | 3796 | ||
| 24 | 1846 | 1858 | 1917 | S4E3 | M1.0 | S | 58 | 3796 | ||
| 24 | 1917 | 1930 | 1935 | M1.4 | 58 | 3796 | ||||
| 24 | 2128 | 2146 | 2155 | S25E9 | M1.3 | 1F | 60 | 3800 | ||
| 24 | 2318 | 2324 | 2332 | S25E8 | M1.7 | 1N | 60 | 3800 |
| LOC: approximate heliographic location | TYPE: radio burst type |
| XRAY: X-ray flare class | Cat: Catania sunspot group number |
| OP: optical flare class | NOAA: NOAA active region number |
| 10CM: peak 10 cm radio flux |
Geomagnetic Observations in Belgium
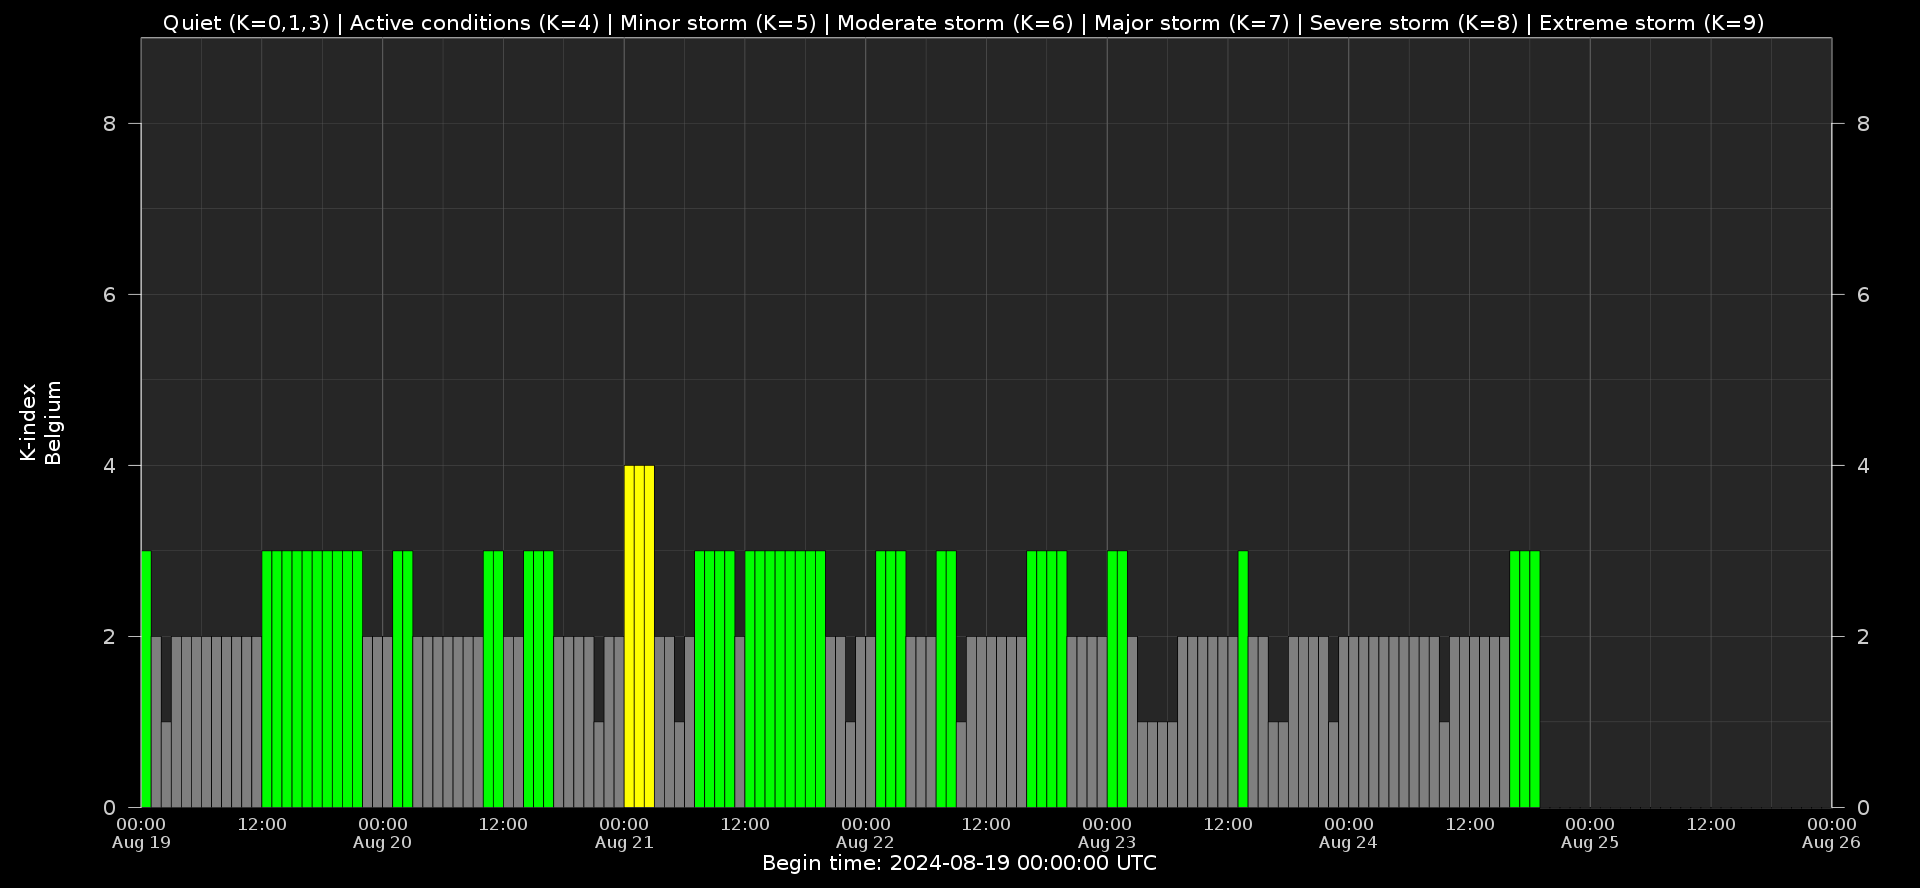
Local K-type magnetic activity index for Belgium based on data from Dourbes (DOU) and Manhay (MAB). Comparing the data from both measurement stations allows to reliably remove outliers from the magnetic data. At the same time the operational service availability is improved: whenever data from one observatory is not available, the single-station index obtained from the other can be used as a fallback system.
Both the two-station index and the single station indices are available here: http://ionosphere.meteo.be/geomagnetism/K_BEL/
The SIDC Space Weather Briefing
The Space Weather Briefing presented by the forecaster on duty from August 18 to 25.
The pdf of the presentation can be found here: https://www.stce.be/briefings/20240826_SWbriefing.pdf
Review of Ionospheric Activity
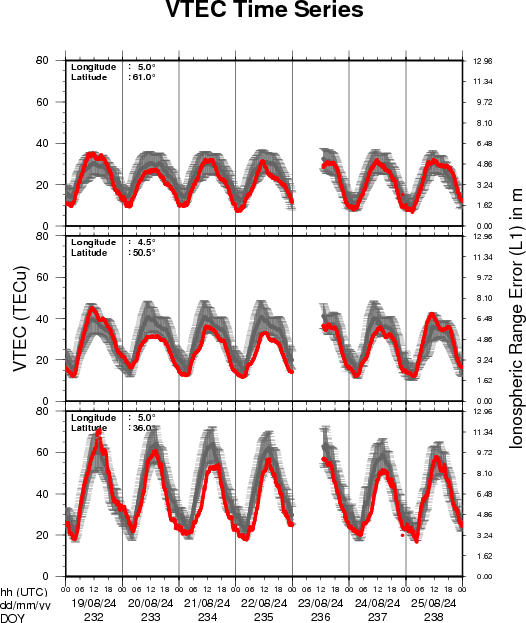
VTEC time series at 3 locations in Europe from 19 Aug 2024 till 25 Aug 2024
The top figure shows the time evolution of the Vertical Total Electron Content (VTEC) (in red) during the last week at three locations:
a) in the northern part of Europe(N 61deg E 5deg)
b) above Brussels(N 50.5deg, E 4.5 deg)
c) in the southern part of Europe(N 36 deg, E 5deg)
This top figure also shows (in grey) the normal ionospheric behaviour expected based on the median VTEC from the 15 previous days.
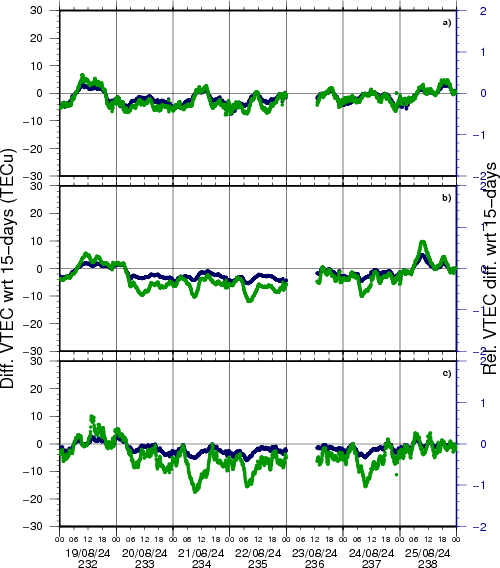
The time series below shows the VTEC difference (in green) and relative difference (in blue) with respect to the median of the last 15 days in the North, Mid (above Brussels) and South of Europe. It thus illustrates the VTEC deviation from normal quiet behaviour.
The VTEC is expressed in TECu (with TECu=10^16 electrons per square meter) and is directly related to the signal propagation delay due to the ionosphere (in figure: delay on GPS L1 frequency).
The Sun's radiation ionizes the Earth's upper atmosphere, the ionosphere, located from about 60km to 1000km above the Earth's surface.The ionization process in the ionosphere produces ions and free electrons. These electrons perturb the propagation of the GNSS (Global Navigation Satellite System) signals by inducing a so-called ionospheric delay.
See http://stce.be/newsletter/GNSS_final.pdf for some more explanations; for more information, see https://gnss.be/SpaceWeather
Courses, seminars and presentations
Courses, seminars and presentations with the Sun-Space-Earth system and Space Weather as the main theme. We provide occasions to get submerged in our world through educational, informative and instructive activities.
* Sep 2, STCE seminar Cross-scale characteristics of decayless waves in the solar corona, Space Pole, Brussels
* Sep 9, STCE talk Space Weather Courses for Industry and Users, UK Space Weather and Space Environment Meeting II, Exeter, UK
* Sep 17, STCE seminar Long Term Solar Activity Using mm Indicators + Investigating the Origin of Switchbacks in the Solar Corona using Statistical Approach, Space Pole, Brussels
* Sep 23, STCE seminar Measuring wind speeds visually from PSP/WISPR's moving vantage point
And Measuring photospheric bright points' shapes to constrain wave heating of the solar corona, Space Pole, Brussels
* Sep 27, STCE at the Wisenight Science festival in the Planetarium, Brussel, https://wisenight.eu/
* Sep 30 - Oct 3, STCE Space Weather Introductory Course, Brussels, Belgium - Registrations are complete - https://events.spacepole.be/event/204/
* Nov 25 - 27, STCE course: Space Weather impacts on ionospheric wave propagation, focus on GNSS and HF, Brussels, Belgium - Registrations are open, https://events.spacepole.be/event/206/
* Dec 5-6, STCE Course Space Weather impacts on aviation, Brussels, Belgium - Registrations are open, https://events.spacepole.be/event/205/
To register for a course and check the seminar details, surf to the STCE Space Weather Education Center: https://www.stce.be/SWEC
If you want your event in the STCE newsletter, contact us: stce_coordination at stce.be