- Table of Content
- 1.80 years ago, ...
- 2.Review of sola...
- 3.International ...
- 4.PROBA2 Observa...
- 5.Noticeable Sol...
- 6.Geomagnetic Ob...
- 7.The SIDC Space...
- 8.Review of Iono...
- 9.Upcoming Activ...
2. Review of solar and geomagnetic activity
3. International Sunspot Number by SILSO
4. PROBA2 Observations
5. Noticeable Solar Events
6. Geomagnetic Observations in Belgium
7. The SIDC Space Weather Briefing
8. Review of Ionospheric Activity
9. Upcoming Activities
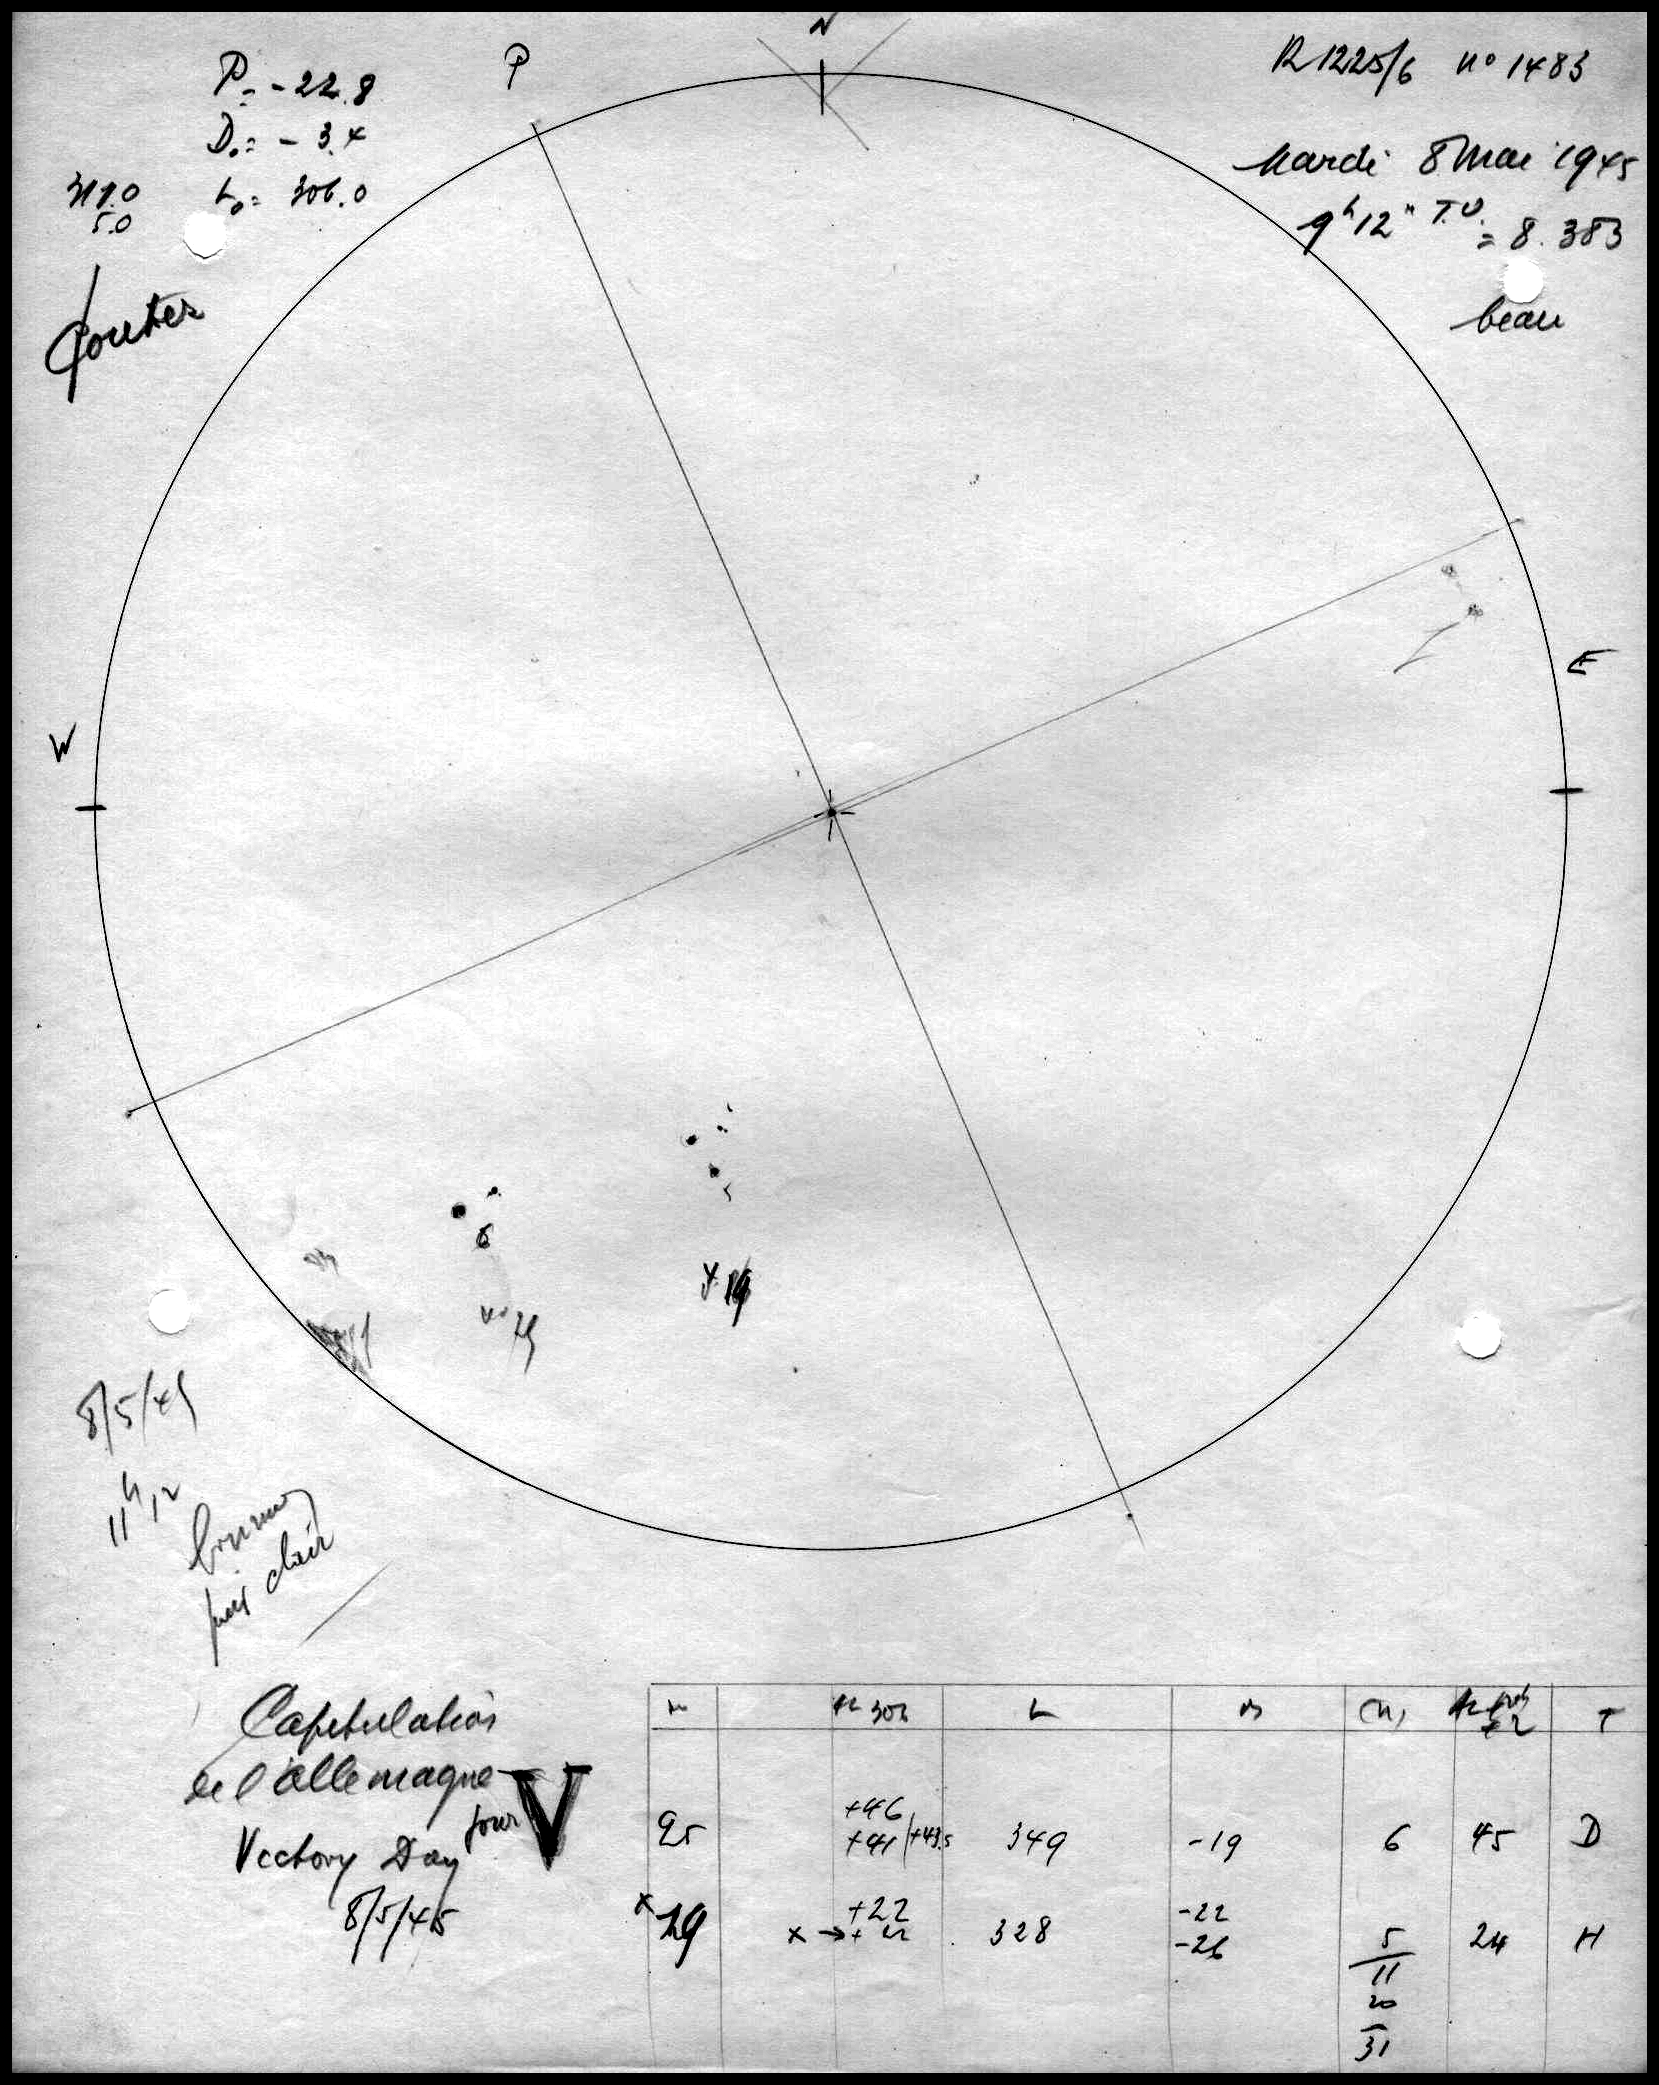
80 years ago, our solar observers marked the liberation of Brussels
At the Royal Observatory of Belgium, scientific activity did not cease during the war. In particular, the daily drawing of sunspots continued since 1940. Sunspots are dark structures on the sun's surface indicating the emergence of magnetic fields. These can be the source of geomagnetic storms, giving rise to the northern lights. Some auroras can even be seen in Belgium, like those observed in May 2024.
Exceptionally, the observer adds a note that is not related to solar activity but to historical events, such as the liberation of Brussels on September 3, 1944, with the comment "entr�e des Alli�s en Belgique (Tournai) et � Bruxelles le soir" ("Allied entry into Belgium (Tournai) and Brussels in the evening"), or the Allied victory on May 8, 1945, with the note "capitulation de l'Allemagne, V pour Victory Day" ("German capitulation, V for Victory Day").
A vivid reminder of a tumultuous time when science was trying to survive.
Figure 1: the solar dome and the USET (Uccle Solar Equatorial Table) instruments used to monitor the sun's activity, particularly sunspots.

Figure 2: the September 3, 1944 drawing
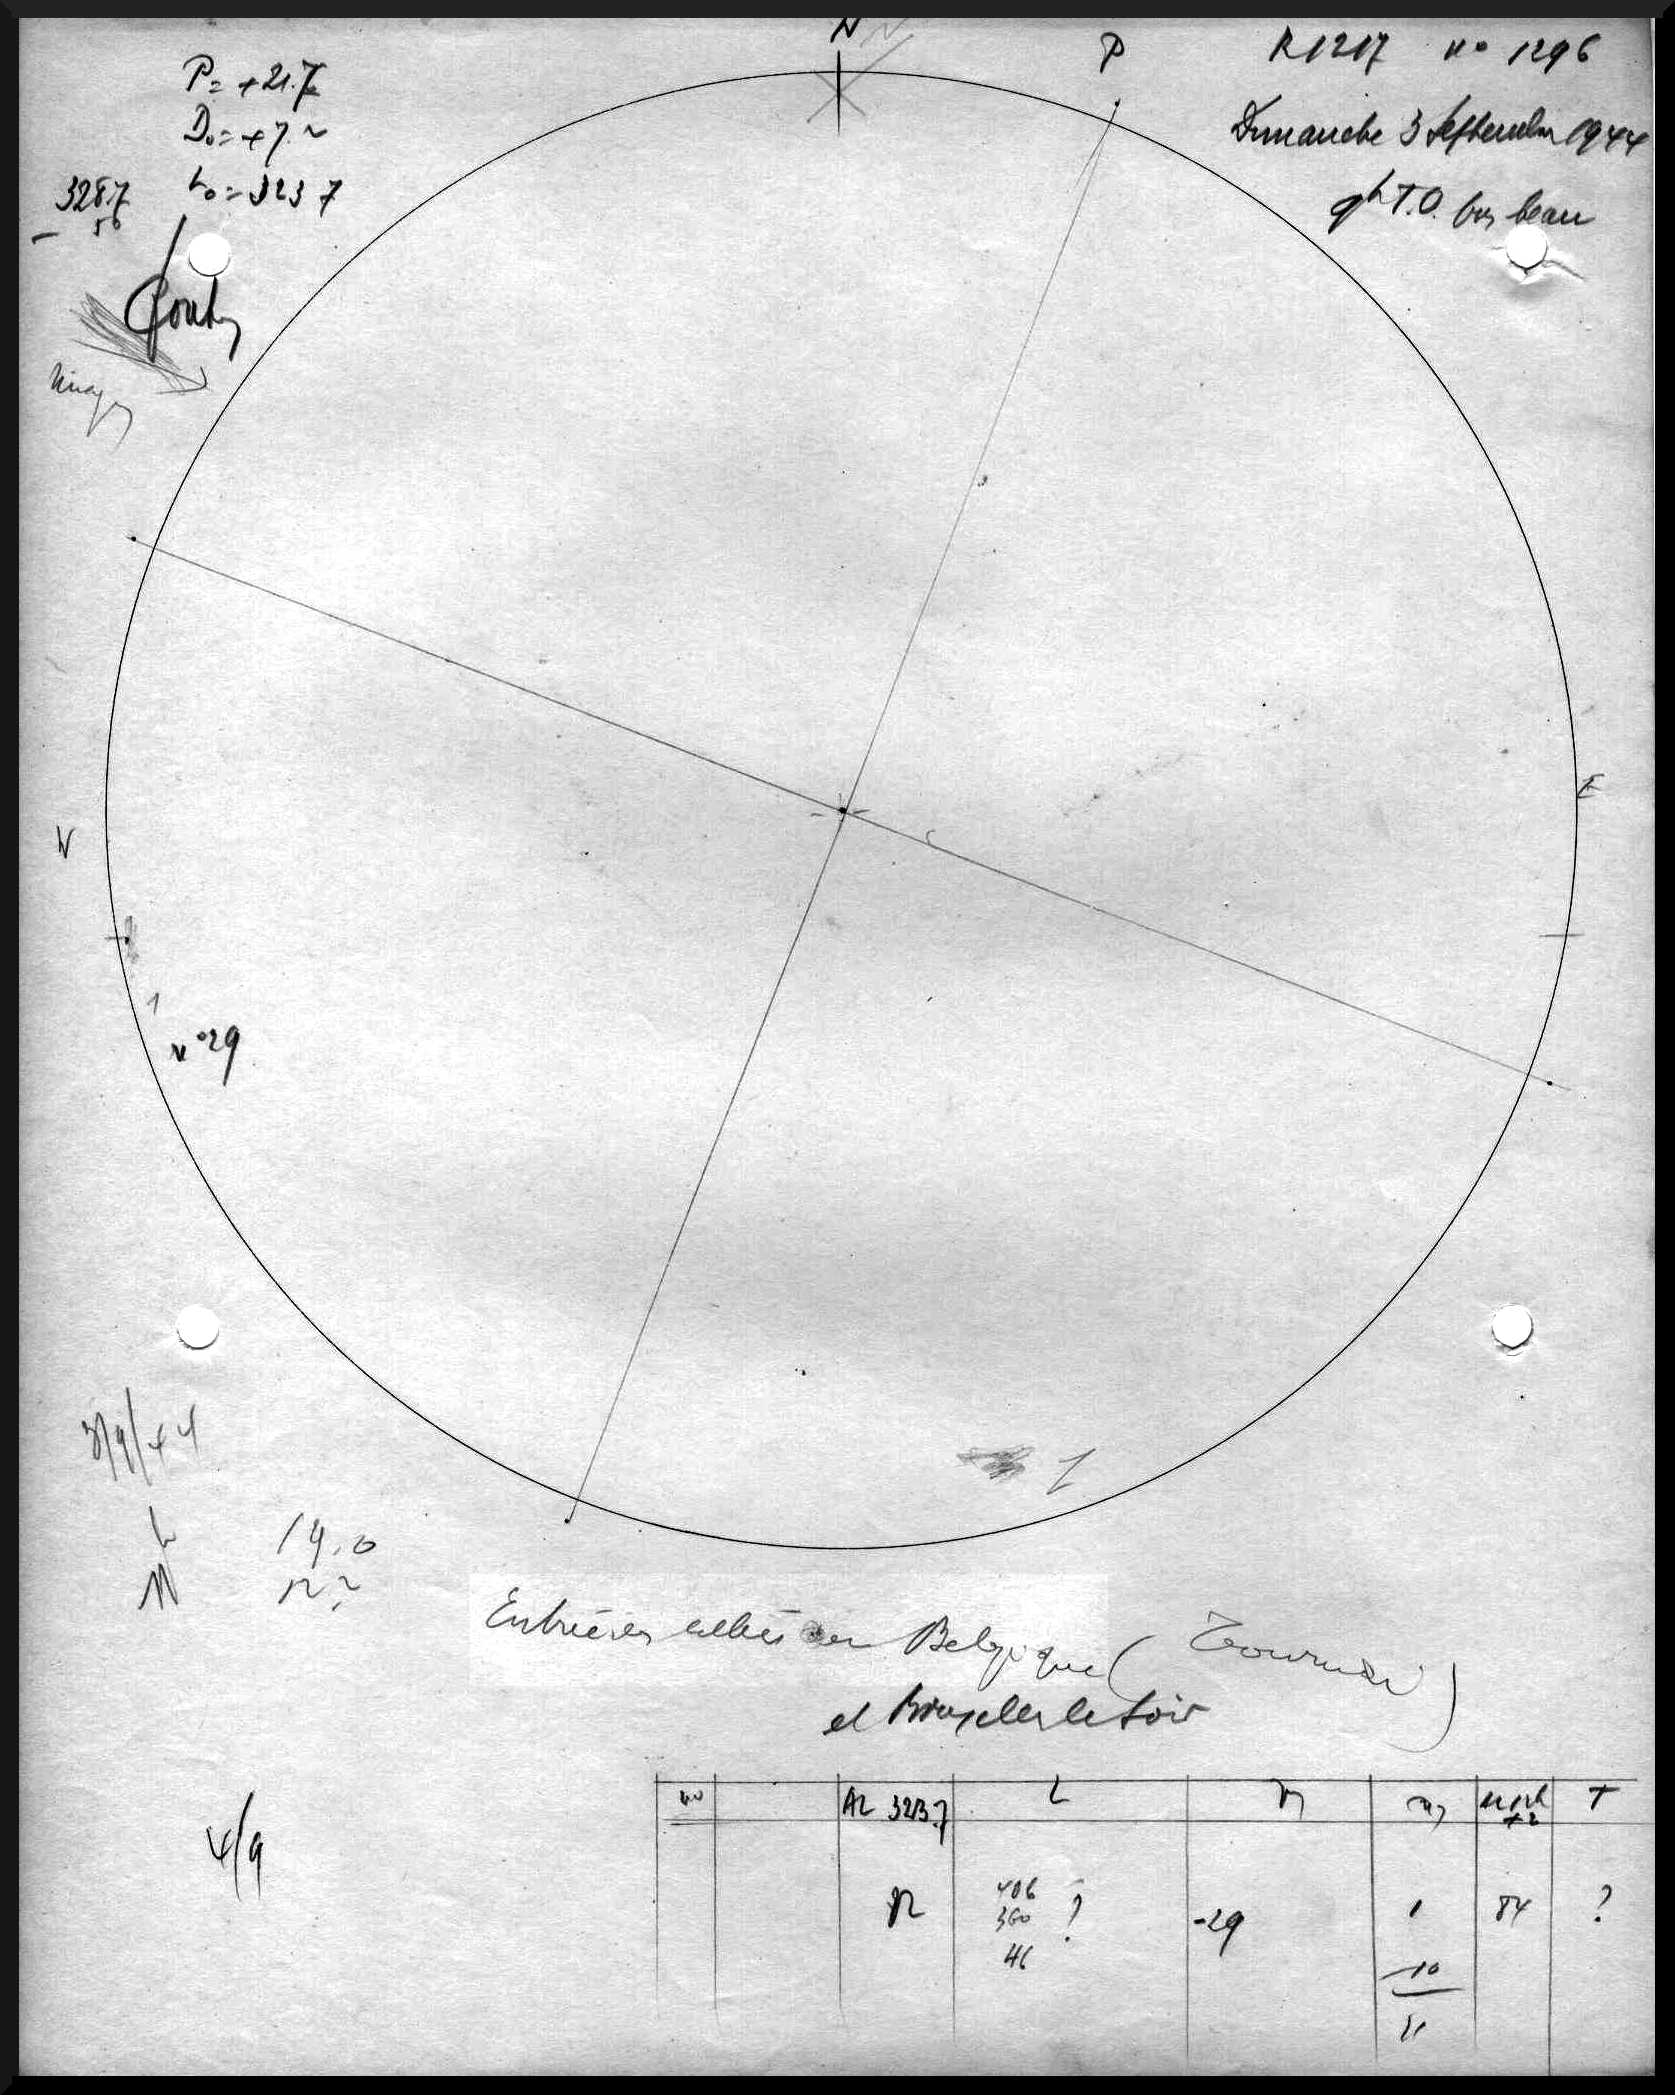
Figure 3: the May 8, 1945 drawing
Review of solar and geomagnetic activity
WEEK 1235 from 2024 Aug 26
Solar Active Regions and flares
Solar flaring activity over the past week began at moderate levels, decreased to low levels on August 28-29, and returned to moderate levels for the remainder of the week. Throughout the week, a total of 19 active regions (ARs) were observed on the visible side of the solar disk.
A total of 54 C-class flares and 13 M-class flares were recorded, with the strongest being two M5.5 flares: the first peaked at 13:22 UTC on September 1, associated with NOAA AR 3813, and the second peaked at 13:31 UTC on September 1, associated with an active region behind the east limb (S23E86). NOAA AR 3806 produced five of the thirteen observed M-class flares. Moderate flaring activity was also produced by NOAA ARs 3796 and 3807.
Coronal mass ejections
A partial halo coronal mass ejection (CME) was detected in LASCO/C2 coronagraph imagery starting at 04:12 UTC on August 28. The CME was directed primarily to the east from Earth's perspective and was likely associated with a prominence eruption near the eastern limb. Due to the location of the source region, no impact on Earth was expected.
A full halo CME was detected in LASCO/C2 coronagraph imagery starting at 12:00 UTC on September 1. This CME was directed primarily to the southeast from Earth's perspective and was likely associated with an M5.5 flare that peaked at 13:22 UTC on September 1, originating from an active region behind the east limb. As this CME was backsided, no significant impact on Earth was expected.
Coronal Holes
Two positive polarity coronal holes, one equatorial and one in the southern hemisphere, have crossed the central meridian on August 26 and August 27.
Proton flux levels
The greater than 10 MeV GOES proton flux remained at nominal levels throughout the week.
Electron fluxes at GEO
The greater than 2 MeV electron flux as measured by GOES 16 and GOES 18 was below the 1000 pfu threshold throughout the entire week.
The electron fluence was at nominal levels throughout the entire week.
Solar wind
The solar wind parameters indicated a slow solar wind regime at the beginning of the week. Around 07:32 UTC on August 27, a fast-forward shock was detected in the solar wind data (DSCOVR and ACE), leading to jumps in magnetic field strength (from 2 nT to 5 nT), solar wind speed (from 250 km/s to 316 km/s), density, and temperature, likely indicating the arrival of the CME observed on August 23. Following the shock, the magnetic field continued to increase, reaching 18 nT, while the Bz (north-south) component of the magnetic field reached a minimum of -15 nT.
From around 00:30 UTC on August 30, the interplanetary magnetic field began to increase again, probably due to the expected high-speed stream (HSS) arrival from the positive polarity coronal holes. The total magnetic field reached 20 nT, and the solar wind speed reached 440 km/s.
The magnetic field orientation was predominantly in the negative sector (field directed towards the Sun) until August 30, after which it switched to a predominantly positive sector (field directed away from the Sun).
Geomagnetism
Geomagnetic conditions were at quiet to unsettled levels at the beginning of the week. They reached moderate storm levels globally (NOAA Kp 6-) between 00:00 and 03:00 UTC on August 28 due to a prolonged period of negative Bz following the ICME arrival. Locally, active conditions were observed over Belgium (K-Bel = 4).
On August 30, geomagnetic conditions reached minor storm levels globally (NOAA Kp = 5-) and active levels locally (K-Bel = 4) in response to the high-speed stream arrival from the positive polarity coronal holes.
International Sunspot Number by SILSO
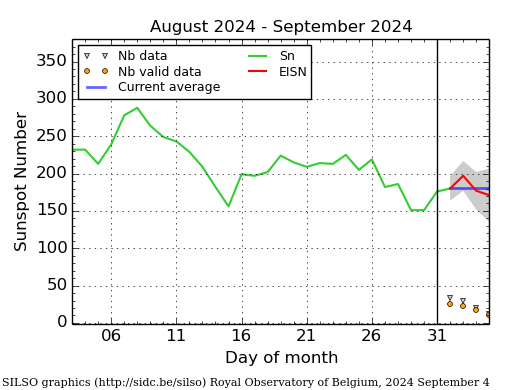
The daily Estimated International Sunspot Number (EISN, red curve with shaded error) derived by a simplified method from real-time data from the worldwide SILSO network. It extends the official Sunspot Number from the full processing of the preceding month (green line), a few days more than one solar rotation. The horizontal blue line shows the current monthly average. The yellow dots give the number of stations that provided valid data. Valid data are used to calculate the EISN. The triangle gives the number of stations providing data. When a triangle and a yellow dot coincide, it means that all the data is used to calculate the EISN of that day.
PROBA2 Observations
Solar Activity
Solar flare activity fluctuated from low to moderate during the week.
In order to view the activity of this week in more detail, we suggest to go to the following website from which all the daily (normal and difference) movies can be accessed: https://proba2.oma.be/ssa
This page also lists the recorded flaring events.
A weekly overview movie (SWAP week 753) can be found here: https://proba2.sidc.be/swap/data/mpg/movies/weekly_movies/weekly_movie_2024_08_26.mp4.mp4.
Details about some of this week's events can be found further below.
If any of the linked movies are unavailable they can be found in the P2SC movie repository here: https://proba2.oma.be/swap/data/mpg/movies/.
Sunday September 01


The largest flare of this week was an M5.5, and it was observed by LYRA (top panel) and SWAP (bottom panel). The flare peaked on 2024-Sep-01 at 13:22 UT. It occurred in the south-eastern quadrant, originating from an active region that was just behind the solar limb.
Find a SWAP movie of the event here: https://proba2.sidc.be/swap/movies/20240901_swap_movie.mp4.
Noticeable Solar Events
| DAY | BEGIN | MAX | END | LOC | XRAY | OP | 10CM | TYPE | Cat | NOAA |
| 26 | 1128 | 1141 | 1152 | M1.4 | VI/1 | 58 | 3796 | |||
| 27 | 0930 | 0943 | 0956 | S4W41 | M1.1 | SF | 58 | 3796 | ||
| 30 | 0200 | 0206 | 0214 | M1.2 | VI/2 | 68 | 3806 | |||
| 30 | 1213 | 1220 | 1225 | M3.8 | 68 | 3806 | ||||
| 31 | 0038 | 0049 | 0054 | S11E47 | M1.1 | SF | 68 | 3806 | ||
| 31 | 0226 | 0238 | 0248 | S8E45 | M1.2 | SF | 68 | 3806 | ||
| 31 | 0852 | 0859 | 0909 | M1.2 | ||||||
| 31 | 1250 | 1302 | 1311 | M1.8 | 68 | 3806 | ||||
| 01 | 0747 | 0757 | 0806 | S16W24 | M1.4 | SF | ||||
| 01 | 1141 | 1322 | 1436 | M5.5 | 3813 | |||||
| 01 | 1328 | 1331 | 1335 | M5.5 | ||||||
| 01 | 1955 | 2000 | 2011 | M1.1 | 3813 | |||||
| 01 | 2237 | 2248 | 2257 | M1.5 | 67 | 3807 |
| LOC: approximate heliographic location | TYPE: radio burst type |
| XRAY: X-ray flare class | Cat: Catania sunspot group number |
| OP: optical flare class | NOAA: NOAA active region number |
| 10CM: peak 10 cm radio flux |
Geomagnetic Observations in Belgium

Local K-type magnetic activity index for Belgium based on data from Dourbes (DOU) and Manhay (MAB). Comparing the data from both measurement stations allows to reliably remove outliers from the magnetic data. At the same time the operational service availability is improved: whenever data from one observatory is not available, the single-station index obtained from the other can be used as a fallback system.
Both the two-station index and the single station indices are available here: http://ionosphere.meteo.be/geomagnetism/K_BEL/
The SIDC Space Weather Briefing
The forecaster on duty presented the SIDC briefing that gives an overview of space weather from August 25 to September 1.
The pdf of the presentation can be found here: https://www.stce.be/briefings/20240902_SWbriefing.pdf

Review of Ionospheric Activity


VTEC time series at 3 locations in Europe from 26 Aug 2024 till 1 Sep 2024
The top figure shows the time evolution of the Vertical Total Electron Content (VTEC) (in red) during the last week at three locations:
a) in the northern part of Europe(N 61deg E 5deg)
b) above Brussels(N 50.5deg, E 4.5 deg)
c) in the southern part of Europe(N 36 deg, E 5deg)
This top figure also shows (in grey) the normal ionospheric behaviour expected based on the median VTEC from the 15 previous days.
The time series below shows the VTEC difference (in green) and relative difference (in blue) with respect to the median of the last 15 days in the North, Mid (above Brussels) and South of Europe. It thus illustrates the VTEC deviation from normal quiet behaviour.
The VTEC is expressed in TECu (with TECu=10^16 electrons per square meter) and is directly related to the signal propagation delay due to the ionosphere (in figure: delay on GPS L1 frequency).
The Sun's radiation ionizes the Earth's upper atmosphere, the ionosphere, located from about 60km to 1000km above the Earth's surface.The ionization process in the ionosphere produces ions and free electrons. These electrons perturb the propagation of the GNSS (Global Navigation Satellite System) signals by inducing a so-called ionospheric delay.
See http://stce.be/newsletter/GNSS_final.pdf for some more explanations; for more information, see https://gnss.be/SpaceWeather
Upcoming Activities
Courses, seminars and presentations with the Sun-Space-Earth system and Space Weather as the main theme. We provide occasions to get submerged in our world through educational, informative and instructive activities.
* Sep 9, Talk at Space Weather Courses for Industry and Users, UK Space Weather and Space Environment Meeting II, Exeter, UK
* Sep 17, STCE seminar - Long Term Solar Activity Using mm Indicators + Investigating the Origin of Switchbacks in the Solar Corona using Statistical Approach, Space Pole, Brussels
* Sep 23, STCE seminar - Measuring wind speeds visually from PSP/WISPR's moving vantage point + Measuring photospheric bright points' shapes to constrain wave heating of the solar corona, Space Pole, Brussels
* Sep 27, STCE at the Wisenight Science festival in the Planetarium, Brussel, https://wisenight.eu/
* Sep 30 - Oct 3, STCE Space Weather Introductory Course, Brussels, Belgium - Registrations are complete - https://events.spacepole.be/event/204/
* Oct 2, STCE Seminar - Solar Eruptions: Mechanisms and Modeling, Space Pole, Brussels
* Nov 25 - 27, STCE course: Space Weather impacts on ionospheric wave propagation, focus on GNSS and HF, Brussels, Belgium - Registrations are open, https://events.spacepole.be/event/206/
* Dec 5-6, STCE Course Space Weather impacts on aviation, Brussels, Belgium - Registrations are open, https://events.spacepole.be/event/205/
To register for a course and check the seminar details, surf to the STCE Space Weather Education Center: https://www.stce.be/SWEC
If you want your event in the STCE newsletter, contact us: stce_coordination at stce.be