- Table of Content
- 1.Some stunning ...
- 2.Sneak preview ...
- 3.PITHIA-NRF Tra...
- 4.Review of sola...
- 5.International ...
- 6.PROBA2 Observa...
- 7.Noticeable Sol...
- 8.Geomagnetic Ob...
- 9.Review of Iono...
- 10.The SIDC Space...
- 11.Upcoming Activ...
2. Sneak preview of the eclipse
3. PITHIA-NRF Trans-National Access Open Call
4. Review of solar and geomagnetic activity
5. International Sunspot Number by SILSO
6. PROBA2 Observations
7. Noticeable Solar Events
8. Geomagnetic Observations in Belgium
9. Review of Ionospheric Activity
10. The SIDC Space Weather Briefing
11. Upcoming Activities
Some stunning solar eruptions
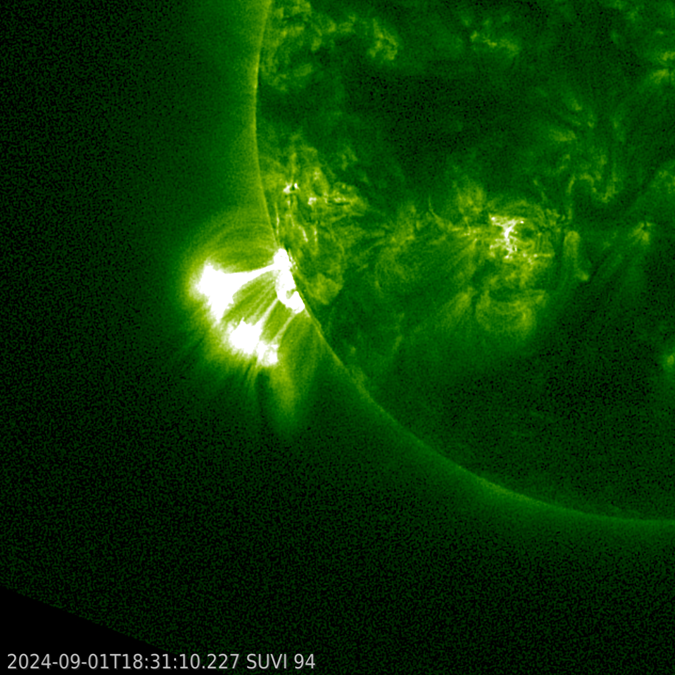
Solar activity has remained high during the first half of September, with the recent X1 and X4 flares by NOAA 3825 as prime examples (see the STCE newsflash at https://www.stce.be/news/723/welcome.html ). There were also some additional, really stunning eruptions during those 2 weeks. On 1 September, peaking at 13:22UTC, a region near or just beyond the southeast solar limb (maybe NOAA 3813) produced a long duration M5.5 flare which was accompanied by a magnificent set of post-eruption coronal loops as well as supra-arcade downflows or "SADs" (see this STCE newsitem at https://www.stce.be/news/630/welcome.html for more info). Despite the far eastern location, the greater than 10 MeV proton flux became enhanced and reached a peak of 6 pfu on 3 September, which is still well below the event threshold of 10 pfu. The imagery underneath shows the eruption in extreme ultraviolet (EUV ; GOES/SUVI 094 https://www.swpc.noaa.gov/products/goes-solar-ultraviolet-imager-suvi ), with clips available in the online version of this newsitem at https://www.stce.be/news/724/welcome.html
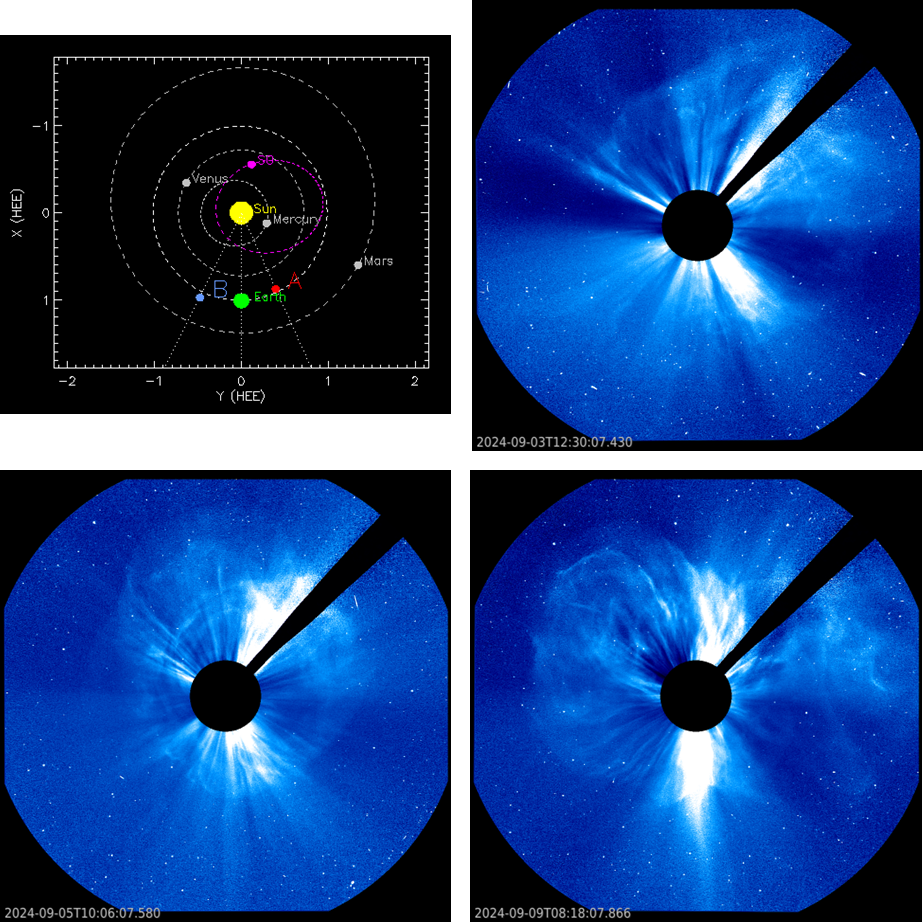
Several coronal mass ejections (CMEs) have been observed, including halo CMEs. However, the halo CMEs of 3, 5 and 9 September all had their source on the farside of the Sun and were not directed to the Earth (see SOHO/LASCO C3 imagery underneath - https://soho.nascom.nasa.gov/data/realtime-images.html ). Old active regions NOAA 3790, NOAA 3792, or any newly developing region in that area belong to the list of most likely sources for these strong eruptions. Noteworthy is that NOAA 3825, source of the two X-class flares (see above), is in exactly this location and thus may be the remainder of this still very active sunspot region. At the time of the eruptions on 3-5-9 September, Solar Orbiter was located on the far side of the Sun as seen from Earth (SO ; pink dot in diagram underneath). Its STIX instrument (see this STCE newsitem at https://www.stce.be/news/712/welcome.html for more info) provided some proxies for the strength of these events. The 3 September eruption was estimated to correspond to an X2.6 flare (X1.3 - X5.1 range), and the 5 September eruption seemed to be linked to an M7.1 flare (M3.9 - X1.3 range). There are no such data for the 9 September eruption, as Solar Orbiter was in superior conjunction (in plain English: SO was exactly at the opposite side of the Sun as seen from Earth) from 8 till 17 September, thus prohibiting direct communication with the Earth.
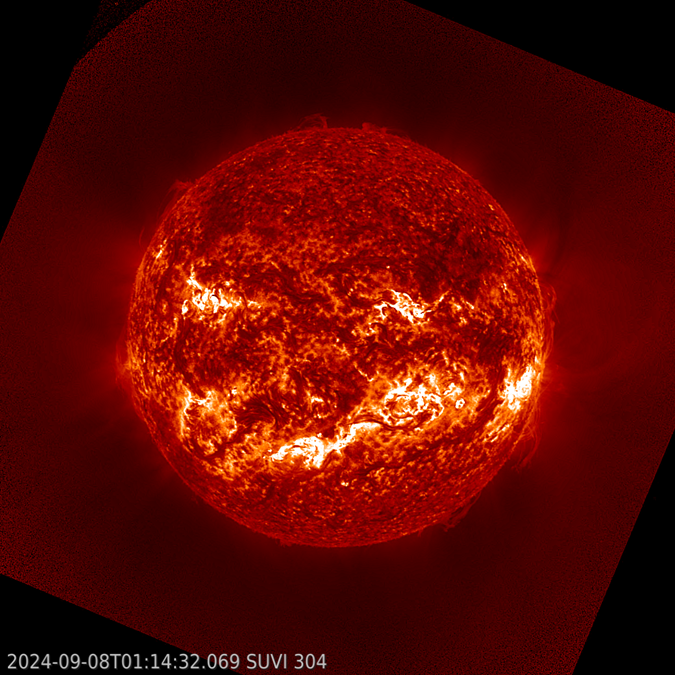
Also the filaments contributed to the eruptive activity. A small filament in the northwest quadrant erupted late on 7 / early on 8 September, showing a dynamic ("twisting") unfolding of the ejected material (GOES/SUVI 304). The associated CME was thought to have an earth-directed component (SOHO coronagraph), but either it left no obvious solar wind signature, or it got embedded in other CMEs.
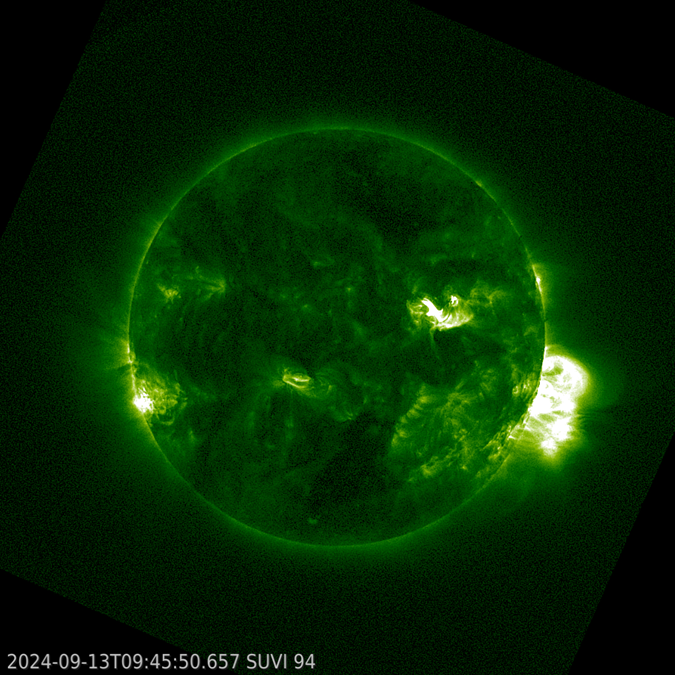
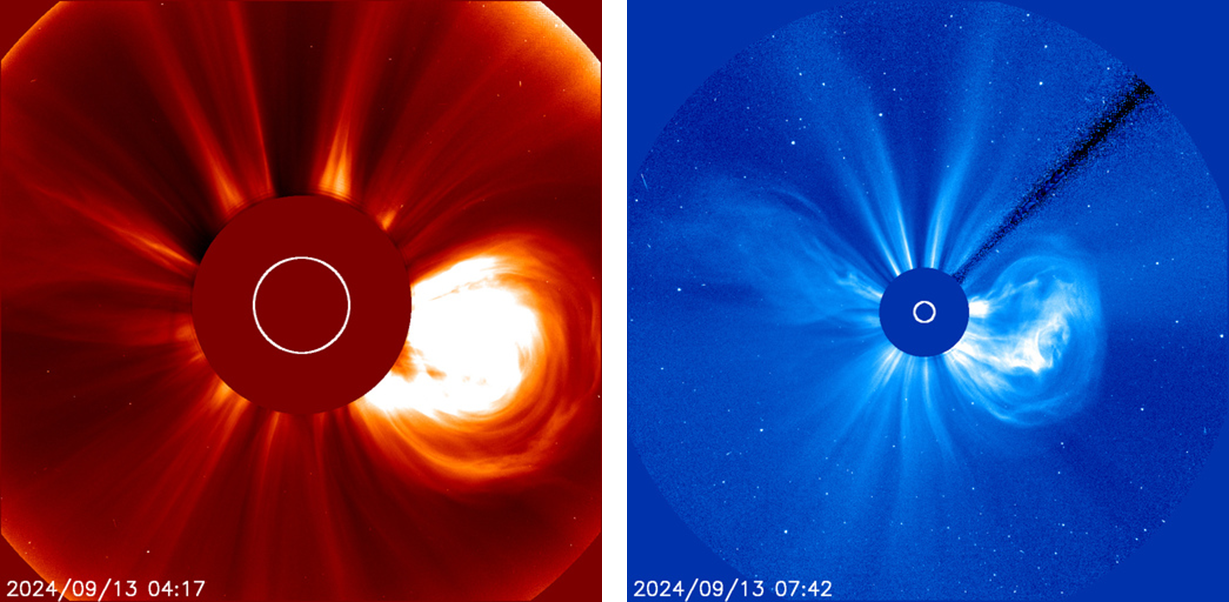
Flaring activity increased again from 11 to 13 September due to a string of active sunspot groups that approached the southwest solar limb. In particular NOAA 3811 was the source of numerous moderate flares as well as a series of M5 flares (GOES/SUVI 094 imagery underneath). This activity drove the x-ray background flux above the M1-level from 12 September around 21:30UTC until 13 September around 09:30UTC, meaning that the GOES could only detect M-class or stronger flares for nearly a half day. A solid CME was associated with one of three M1 flares early on 13 September, as shown in the coronagraphic images underneath by SOHO/LASCO. The outline of the occulted solar disk half provides an idea of the size of the CME.
Sneak preview of the eclipse
While observers in Argentina and Chile are preparing for the next solar eclipse on October 2, we at the STCE are also getting our ducks in a row.
The PROBA2 satellite will again have a front row seat to the event. The simulation below shows what SWAP, the solar telescope onboard, will observe. The Moon will pass in the field-of-view several times and at one of those passages will obscure more than 75% of the solar disk.
Something to look forward to!
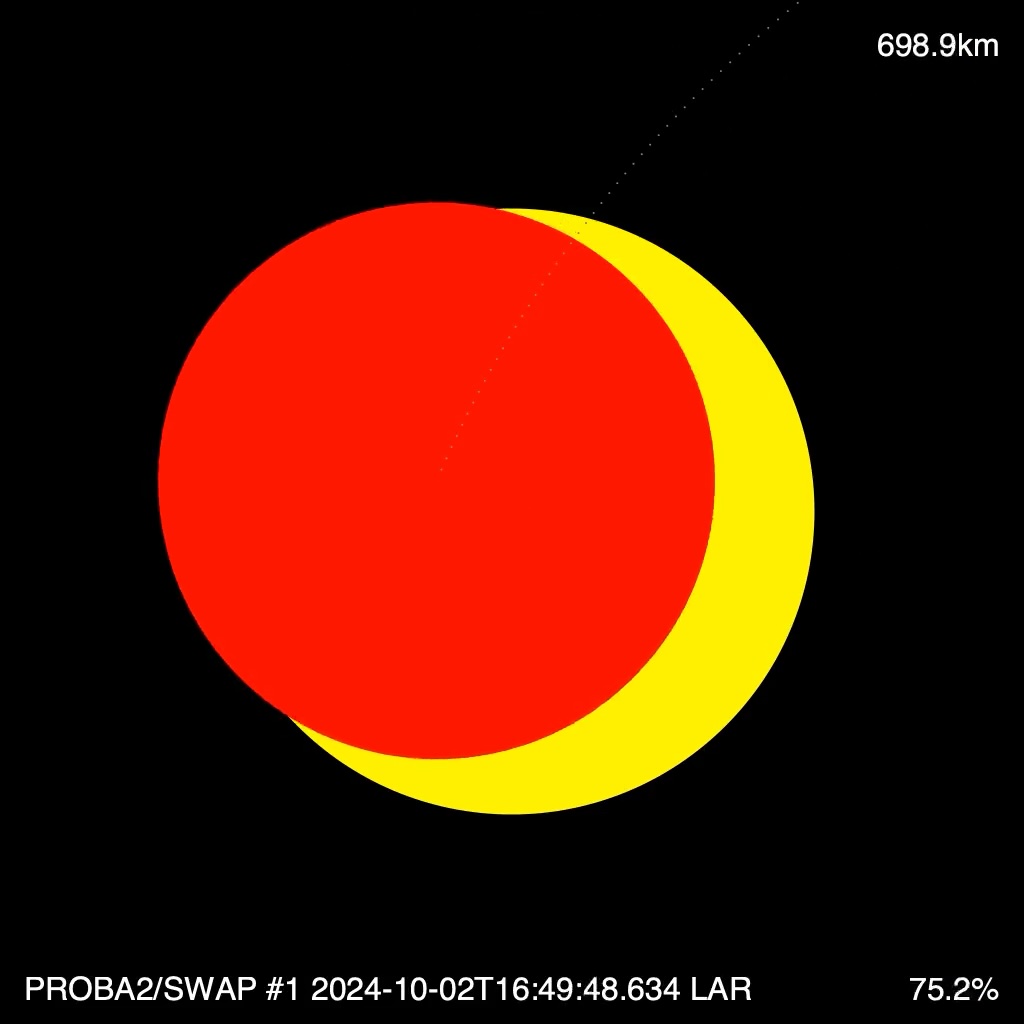
Find a movie of the simulation here: https://proba2.sidc.be/Events/2024-Oct-02-SolarEclipse/eclipse_2024-10-02.mp4
PITHIA-NRF Trans-National Access Open Call
The deadline for the 7th PITHIA-NRF TNA call has been extended to 2 October.
PITHIA-NRF launches its seventh call. This is the FINAL call in the frame of PITHIA-NRF project to provide effective and convenient access to the best European research facilities for observations of the upper atmosphere, including the plasmasphere, ionosphere and thermosphere. The access is organised through the Trans-National Access (TNA) programme, and provides an opportunity for researcher and other users to execute and carry out their own projects at one of the PITHIA-NRF research facilities, including the STCE.
The call is open from 15 August 2024. It is an Open Call and applications are handled as they arrive with typical evaluation times of 2 to 3 weeks. If accepted the projects can commence for organisation and realisation from September 2024 and the project report must be submitted at the latest by the end of February 2025. The call closes on 27 September 2024.
More information about the call can be obtained from the call website: https://pithia-nrf.eu/pithia-nrf-users/tna/tna-calls/seventh-tna-call
Access can be requested by scientific users from academia, Small and Medium Enterprises, large companies and public organizations by propose a scientific project and fill in the online application form (https://pithia-nrf.eu/forms/tna-application-form-7).
Review of solar and geomagnetic activity
WEEK 1237 from 2024 Sep 09
Solar Active Regions and flares
Solar flaring activity reached high levels for most of the days of the past week.
Two X-class flares were detected, both from NOAA Active Region (AR) 3825 (magnetic configuration Beta-Gamma-Delta, Catania sunspot group no 1): an X4.5 flare on 14 Sep 15:29 UTC and an X1.3 flaare on 12 Sep 09:43 UTC.
34 M-class flares were detected between Monday 9 Sep and Saturday 14 Sep. They were produced by NOAA ARs 3806 (five flares), 3811 (13 flares), 3814 (seven flares), 3815 (one flare), 3824 (one flare), and 3825 (seven flares).
Coronal mass ejections
A partial halo Coronal Mass Ejection (CME) registered in LASCO-C2/SOHO images as launched 9 Sep 03:36 UTC. It delivered a glancing blow to Earth's environment 11 Sep 14:30 UTC.
A halo CME registered in LASCO-C2/SOHO images as launched around 10 Sep 01:00 UTC. It arrived on the Earth's environment 12 Sep 03:00 UTC.
A partial halo CME can be seen in LASCO C2/SOHO images starting from 13 Sep 01:30 UTC.
A partial halo CME registered in LASCO C2/SOHO and COR2/STEREO-A images as launched at 14 Sep 15:36 UTC. It was associated with the X4.5 flare of 14 Sep 15:29 UTC.
Coronal Holes
Two Corona Holes (CHs) crossed the central solar meridian during the past week. The first was northern with negative polarity and start crossing on 9 Sep. The second was southern with positive polarity and started crossing on 13 Sep.
Proton flux levels
The greater than 10 MeV proton flux, as measured by GOES-18, registered a short-lived proton event exceeding the 10 pfu alert level between Sep 9 16:40 UTC and Sep 10 04:20 UTC.
A second proton event was registered on 14 Sep as a result of the X4.5 flare at 15:29 UTC. It was a rather weak event that peaked at 5 pfu on 15 Sep.
Electron fluxes at GEO
The greater than 2 MeV electron flux, as measured by the GOES-18 satellite, was at nominal levels from the start of the past week until the first half of 13 Sep. It exceeded the 1000 pfu level at 15:50 UTC and peaked at 7000 pfu at 20:30 UTC. It remained at increased levels until 15 Sep.
The 24h electron fluence remained at normal levels (i.e. below the 5e7 pfu threshold) during the past week.
Solar wind
At the beginning of the past week the Solar Wind (SW) conditions resembled the slow wind regime. The SW speed varied between 320 and 480 km/s, while the total interplanetary magnetic field (Bt) ranged between 3 and 12 nT. The North-South magnetic component (Bz) fluctuated between -9 and 12 nT, while the interplanetary magnetic field phi angle was directed predominately towards the Sun.
Starting from 12 Sep 03:00 UTC the SW conditions were disturbed by the arrival of the CME launched on 10 Sep. The SW speed peaked at 620 km/s and the total interplanetary magnetic field (Bt) peaked at 30 nT. The North-South magnetic component (Bz) fluctuated between -26 and 17 nT, while the interplanetary magnetic field phi angle was directed away from the Sun.
As the effects of the CME were waning, a High Speed Stream (HSS) associated with the coronal hole crossing of 9 Sep became geo-effective. On Sep 15 the SW speed increased from 380 km/s to 580 km/s, while the total interplanetary magnetic field (Bt) ranged between 4 and 10 nT and its North-South magnetic component (Bz) fluctuated between -9 and 7 nT. The interplanetary magnetic field phi angle was directed away from the Sun during that day.
Geomagnetism
The global geomagnetic conditions reached storm levels between 12 and 13 Sep, while for the rest of the past week they remained at unsettled to active levels. More specifically, NOAA Kp reached minor storm levels (Kp 5+) at 06:00-09:00 UTC, moderate storm levels (Kp 6-) at 09:00-12:00 UTC, and major storm level (Kp 7) at 12:00-15:00 UTC. After some fluctuation (Kp 6+ at 15:00-18:00 and Kp 7- at 18:00-21:00 UTC) the storm started to wane (Kp 5- at 21:00-24:00 UTC, Kp 5 on 13 Sep 00:00-03:00 UTC, Kp 5- 03:00-06:00 UTC). However, the same day (13 Sep) moderate storm levels (Kp 6) were registered again at 21:00-24:00 UTC.
The local geomagnetic conditions were milder than the global conditions during the past week. The storm of 12 and 13 Sep also started with K BEL registering a minor storm (K BEL 5) at 06:00-09:00 UTC. It peaked at moderate storm levels (K BEL 6) between 12:00 and 21:00 UTC and dropped to unsettled conditions (K BEL 3) after 21:00 UTC. Then, similarly to the global conditions, a short-lived increase to minor storm levels (K BEL 5) was registered on 14 Sep at 00:00-03:00 UTC.
For the rest of the week quiet to unsettled conditions (K BEL 1-4) were observed.
International Sunspot Number by SILSO
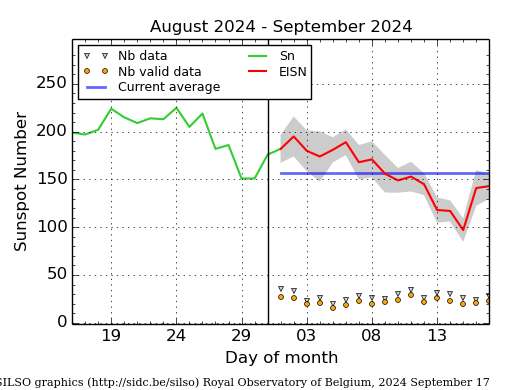
The daily Estimated International Sunspot Number (EISN, red curve with shaded error) derived by a simplified method from real-time data from the worldwide SILSO network. It extends the official Sunspot Number from the full processing of the preceding month (green line), a few days more than one solar rotation. The horizontal blue line shows the current monthly average. The yellow dots give the number of stations that provided valid data. Valid data are used to calculate the EISN. The triangle gives the number of stations providing data. When a triangle and a yellow dot coincide, it means that all the data is used to calculate the EISN of that day.
PROBA2 Observations
Solar Activity
Solar flare activity fluctuated from low to high during the week.
In order to view the activity of this week in more detail, we suggest to go to the following website from which all the daily (normal and difference) movies can be accessed: https://proba2.oma.be/ssa
This page also lists the recorded flaring events.
A weekly overview movie can be found here (SWAP week 755): https://proba2.sidc.be/swap/data/mpg/movies/weekly_movies/weekly_movie_2024_09_09.mp4
Details about some of this week's events can be found further below.
If any of the linked movies are unavailable they can be found in the P2SC movie repository here: https://proba2.sidc.be/swap/data/mpg/movies/
Saturday Sep 14
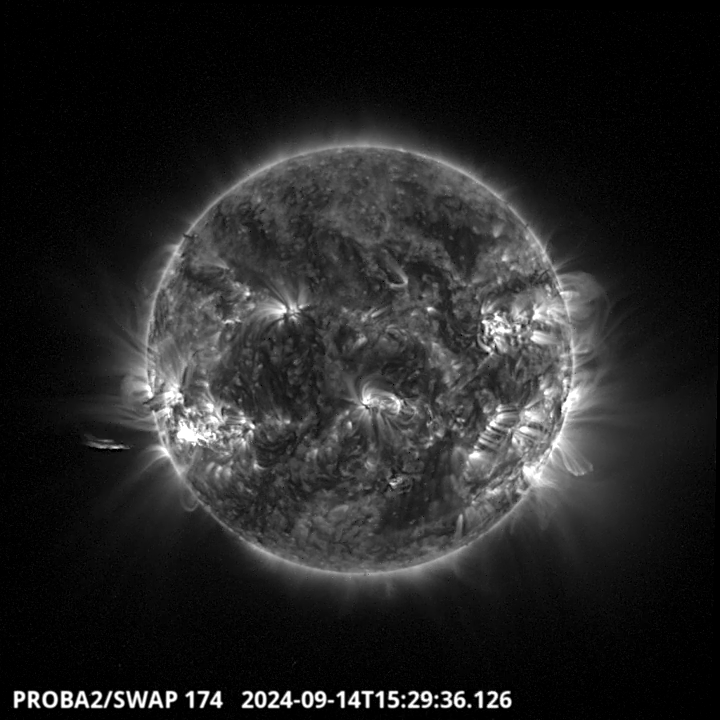
The active region NOAA 3825 located on the South East part of the solar disk produced a strong
X5.4 flare recorded by LYRA and SWAP. The flare peaked around 15:29 UT and it was
accompanied with a CME into space. Find a SWAP movie of the event here: https://proba2.sidc.be/swap/movies/20240914_swap_movie.mp4
Noticeable Solar Events
| DAY | BEGIN | MAX | END | LOC | XRAY | OP | 10CM | TYPE | Cat | NOAA |
| 09 | 0057 | 0332 | 0502 | M1.0 | 68 | 3806 | ||||
| 09 | 0540 | 0545 | 0558 | M1.8 | 68 | 3806 | ||||
| 09 | 0841 | 0850 | 0902 | M1.5 | I/2 | 68 | 3806 | |||
| 09 | 0957 | 1027 | 1048 | M1.7 | 68 | 3806 | ||||
| 09 | 1211 | 1217 | 1224 | M1.0 | 75 | 3811 | ||||
| 09 | 1658 | 1708 | 1716 | N15E15 | M3.4 | 2N | 83 | 3814 | ||
| 09 | 2347 | 0028 | 0103 | M1.2 | I/2 4V/1 | 83 | 3814 | |||
| 10 | 1534 | 1547 | 1602 | M1.6 | ||||||
| 10 | 2338 | 2350 | 2357 | N14W1 | M1.0 | 1 | II/1 | 83 | 3814 | |
| 11 | 1227 | 1236 | 1247 | N16W7 | M1.8 | 2N | 83 | 3814 | ||
| 11 | 1509 | 1518 | 1524 | S14W75 | M1.4 | SF | 89 | 3811 | ||
| 11 | 1524 | 1530 | 1716 | S14W75 | M1.8 | S | ||||
| 11 | 1716 | 1726 | 1732 | M1.6 | 89 | 3811 | ||||
| 11 | 1744 | 1752 | 1800 | N14W12 | M2.0 | 1F | 83 | 3814 | ||
| 11 | 2349 | 0012 | 0032 | N13W1 | M5.0 | SF | 89 | 3811 | ||
| 12 | 0355 | 0404 | 0411 | M1.0 | II/1 | 89 | 3811 | |||
| 12 | 0426 | 0432 | 0439 | N13W1 | M1.2 | 1N | 83 | 3814 | ||
| 12 | 0604 | 0618 | 0629 | S15W87 | M2.7 | SF | 89 | 3811 | ||
| 12 | 0931 | 0943 | 0951 | X1.3 | III/1 | 97 | 3824 | |||
| 12 | 1313 | 1321 | 1332 | M1.2 | 97 | 3824 | ||||
| 12 | 1431 | 1443 | 1447 | S15W84 | M6.8 | SF | III/2 | 89 | 3811 | |
| 12 | 1456 | 1506 | 1520 | M1.6 | 3825 | |||||
| 13 | 0129 | 0137 | 0153 | M1.6 | 3811 | |||||
| 13 | 0638 | 0656 | 0734 | M5.4 | 3811 | |||||
| 13 | 0814 | 0837 | 0850 | N13W29 | M2.9 | SF | VI/1 | 83 | 3814 | |
| 13 | 0046 | 0056 | 0105 | M1.5 | 3811 | |||||
| 13 | 0703 | 0708 | 0712 | M5.2 | 3811 | |||||
| 13 | 0233 | 0239 | 0244 | M1.3 | 3811 | |||||
| 13 | 0437 | 0440 | 0446 | S25W54 | M2.1 | SF | VI/2 | 82 | 3815 | |
| 13 | 0458 | 0500 | 0507 | M2.3 | VI/1 | 3811 | ||||
| 13 | 1456 | 1508 | 1533 | S15E67 | M1.2 | SF | 3825 | |||
| 13 | 1749 | 1756 | 1803 | S14E63 | M1.4 | SF | 3825 | |||
| 13 | 2041 | 2049 | 2055 | S14E64 | M1.1 | SF | 3825 | |||
| 14 | 0310 | 0431 | 0722 | M1.0 | 1 | 3825 | ||||
| 14 | 0726 | 0741 | 0753 | M3.0 | 1 | 3825 | ||||
| 14 | 1513 | 1529 | 1547 | S15E56 | X4.5 | 2B | 1 | 3825 |
| LOC: approximate heliographic location | TYPE: radio burst type |
| XRAY: X-ray flare class | Cat: Catania sunspot group number |
| OP: optical flare class | NOAA: NOAA active region number |
| 10CM: peak 10 cm radio flux |
Geomagnetic Observations in Belgium
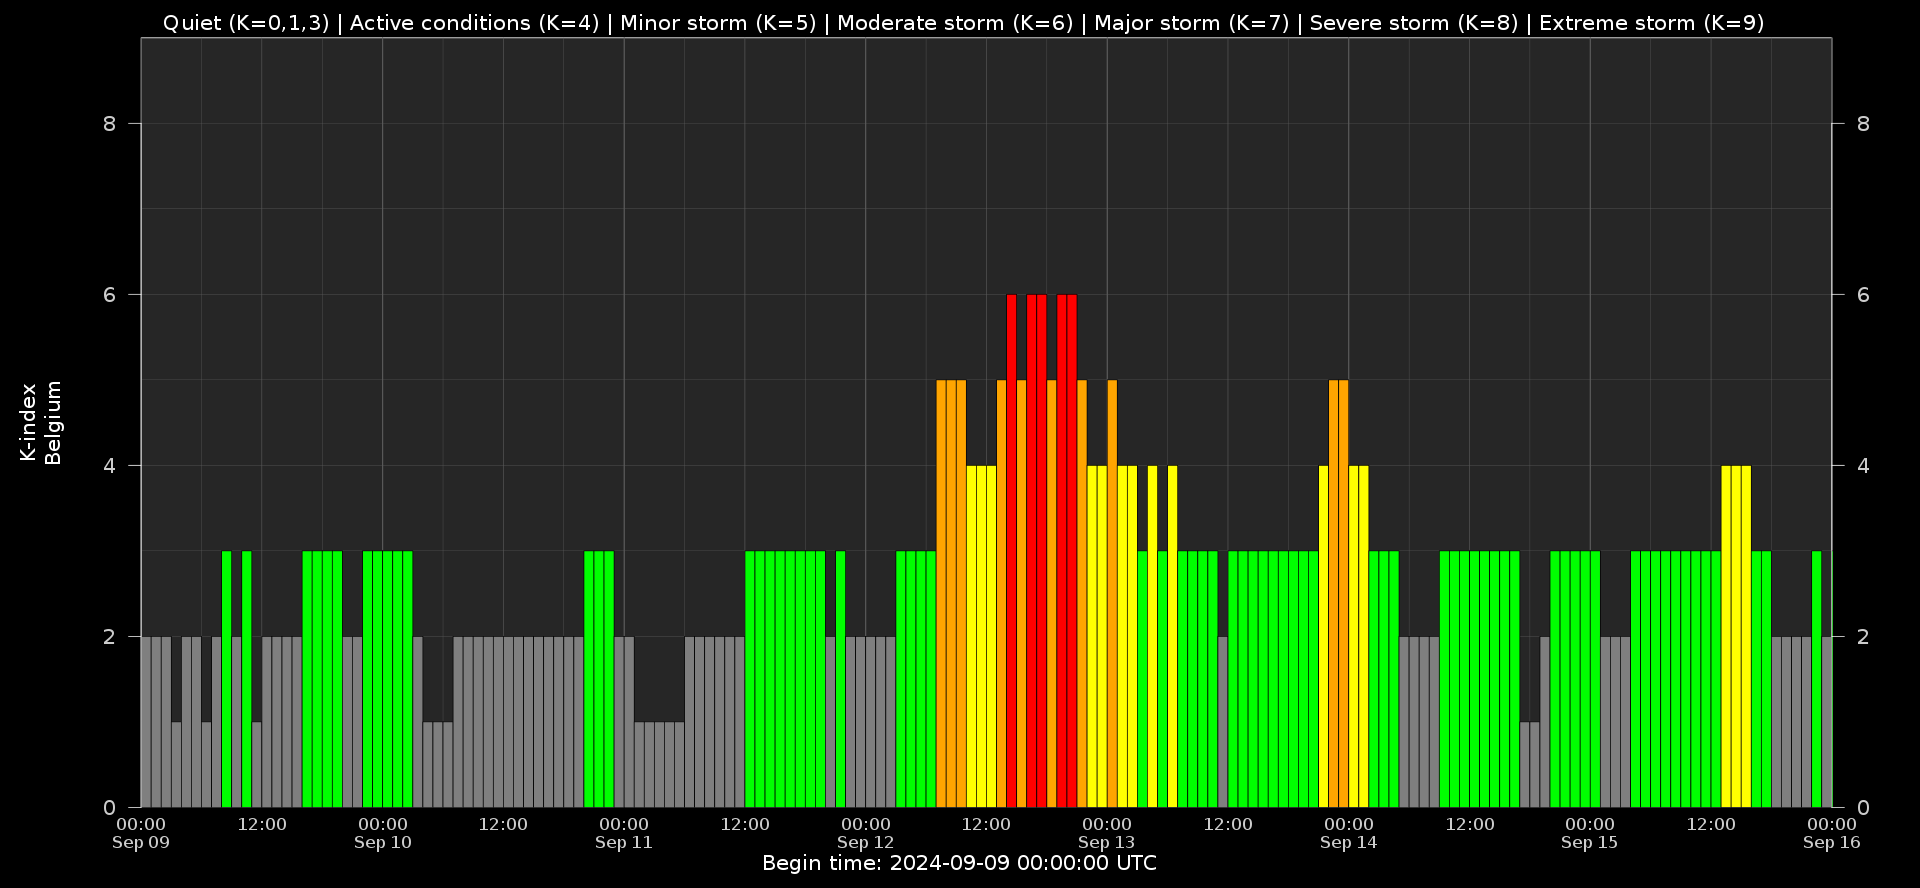
Local K-type magnetic activity index for Belgium based on data from Dourbes (DOU) and Manhay (MAB). Comparing the data from both measurement stations allows to reliably remove outliers from the magnetic data. At the same time the operational service availability is improved: whenever data from one observatory is not available, the single-station index obtained from the other can be used as a fallback system.
Both the two-station index and the single station indices are available here: http://ionosphere.meteo.be/geomagnetism/K_BEL/
Review of Ionospheric Activity
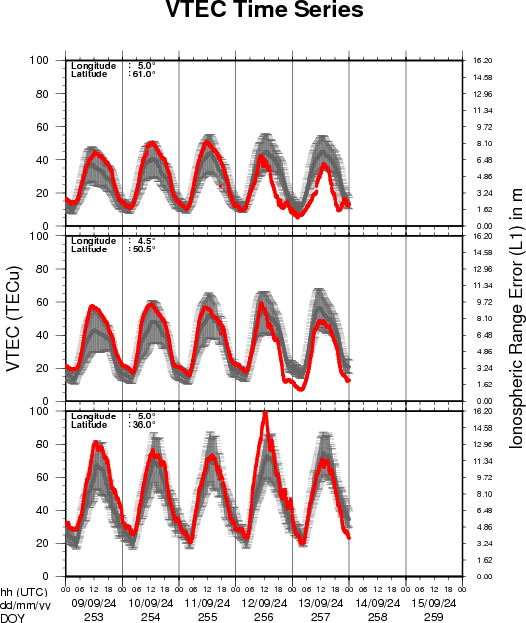
VTEC time series at 3 locations in Europe from 9 Sep 2024 till 15 Sep 2024
The top figure shows the time evolution of the Vertical Total Electron Content (VTEC) (in red) during the last week at three locations:
a) in the northern part of Europe(N 61deg E 5deg)
b) above Brussels(N 50.5deg, E 4.5 deg)
c) in the southern part of Europe(N 36 deg, E 5deg)
This top figure also shows (in grey) the normal ionospheric behaviour expected based on the median VTEC from the 15 previous days.
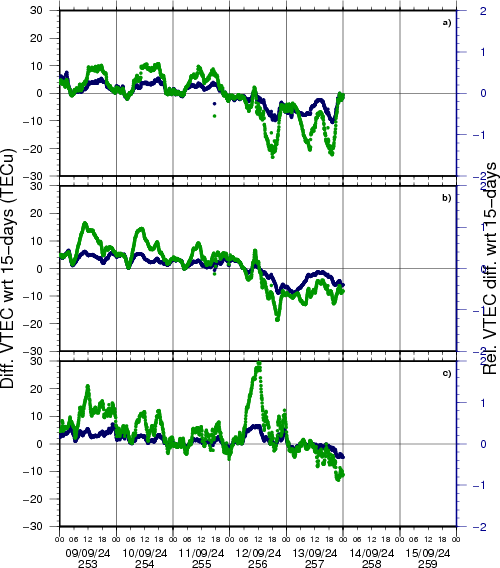
The time series below shows the VTEC difference (in green) and relative difference (in blue) with respect to the median of the last 15 days in the North, Mid (above Brussels) and South of Europe. It thus illustrates the VTEC deviation from normal quiet behaviour.
The VTEC is expressed in TECu (with TECu=10^16 electrons per square meter) and is directly related to the signal propagation delay due to the ionosphere (in figure: delay on GPS L1 frequency).
The Sun's radiation ionizes the Earth's upper atmosphere, the ionosphere, located from about 60km to 1000km above the Earth's surface.The ionization process in the ionosphere produces ions and free electrons. These electrons perturb the propagation of the GNSS (Global Navigation Satellite System) signals by inducing a so-called ionospheric delay.
See http://stce.be/newsletter/GNSS_final.pdf for some more explanations; for more information, see https://gnss.be/SpaceWeather
The SIDC Space Weather Briefing
The forecaster on duty presented the SIDC briefing that gives an overview of space weather from September 9 to 15.
The pdf of the presentation can be found here: https://www.stce.be/briefings/20240916_SWbriefing.pdf
Upcoming Activities
Courses, seminars and presentations with the Sun-Space-Earth system and Space Weather as the main theme. We provide occasions to get submerged in our world through educational, informative and instructive activities.
* Sep 23, STCE seminar - Measuring wind speeds visually from PSP/WISPR's moving vantage point
+ Measuring photospheric bright points' shapes to constrain wave heating of the solar corona, Space Pole, Brussels
* Sep 27, STCE at the Wisenight Science festival in the Planetarium, Brussel, https://wisenight.eu/
* Sep 30 - Oct 3, STCE Space Weather Introductory Course, Brussels, Belgium - Registrations are complete - https://events.spacepole.be/event/204/
* Oct 2, STCE Seminar - Solar Eruptions: Mechanisms and Modeling, Space Pole, Brussels
* Nov 25 - 27, STCE course: Space Weather impacts on ionospheric wave propagation, focus on GNSS and HF, Brussels, Belgium - Registrations are open, https://events.spacepole.be/event/206/
* Dec 5-6, STCE Course Space Weather impacts on aviation, Brussels, Belgium - Registrations are open, https://events.spacepole.be/event/205/
To register for a course and check the seminar details, surf to the STCE Space Weather Education Center: https://www.stce.be/SWEC
If you want your event in the STCE newsletter, contact us: stce_coordination at stce.be