- Table of Content
- 1.Solar Cycle 25...
- 2.Reminder: Call...
- 3.Review of spac...
- 4.PROBA2 Observa...
- 5.International ...
- 6.Noticeable Sol...
- 7.Geomagnetic Ob...
- 8.The SIDC Space...
- 9.STCE Courses a...
2. Reminder: Call for EUI and PROBA2 Guest Investigators
3. Review of space weather
4. PROBA2 Observations (16 Sep 2024 - 22 Sep 2024)
5. International Sunspot Number by SILSO
6. Noticeable Solar Events
7. Geomagnetic Observations in Belgium
8. The SIDC Space Weather Briefing
9. STCE Courses and lectures
Solar Cycle 25 maximum
Written by Laure Lefèvre, Director of the SIDC/SILSO
The Sun has been very active during the last few months. Since April this year, many large and complex sunspot groups have adorned the solar disk driving the daily sunspot number regularly to well above 250 (see the SIDC/USET (https://www.sidc.be/uset/ ) image for 7 August underneath). These active regions often were the source of strong solar flares, and the associated solar eruptions -if earth-directed- eventually would rattle the Earth’s magnetic field. The majestic aurorae thus created were sometimes visible from countries further away from the polar regions, such as in May this year when the colorful display was also visible from Belgium (see this newsitem https://www.sidc.be/index.php/article/extremely-severe-geomagnetic-storm ). Is all this happening because we are close to the maximum of the current solar cycle?
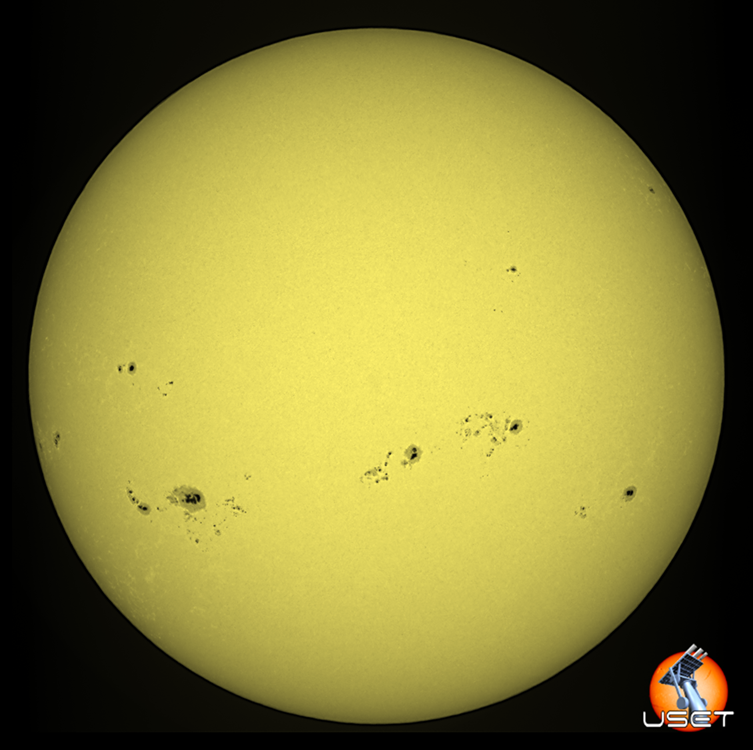
Observation of the Sun at USET on August 7th, 2024
The first question that we need to answer is how the actual value of the maximum of a solar cycle is computed. In order to assess the minima and maxima of the solar cycle, we use what we call the monthly smoothed sunspot number (https://www.sidc.be/SILSO/faq6 ). That is basically an averaging of monthly mean values over 13 months, from 6 months before to 6 months after a base month. According to this quantity, the value of the monthly smoothed sunspot number for the current month (September 2024) will only be known in April next year.
In 2019, the Solar Cycle Prediction Panel -a team of scientists from all over the world- convened to gather and combine predictions for the (at that time) still infant Solar Cycle 25. The results of this gathering were published shortly thereafter: the Solar Cycle Prediction Panel (https://www.swpc.noaa.gov/news/solar-cycle-25-forecast-update ) expected the cycle maximum value of the smoothed monthly sunspot number to be between 105-125 (a narrow range!) with the peak occurring between November 2024 and March 2026.
So, five years later, where are we now with respect to the progress of this solar cycle? The most recent value computed for this monthly smoothed sunspot number is for February 2024 and it amounts to 137, which is already and clearly outside of the uncertainty range published in 2019, and -more importantly- it is still on the rise.
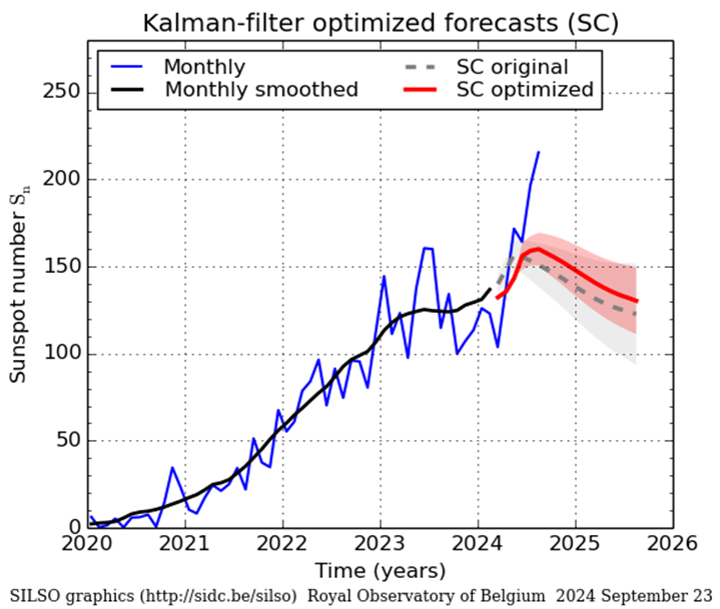
Solar activity prediction from WDC SILSO
In terms of prediction accuracy, the closer we are to the actual maximum, the more the various prediction methods will converge. At this point in the solar cycle, the WDC SILSO (https://www.sidc.be/SILSO/forecasts ) predicts a maximum between 138 and 161 that would take place sometime between May and October 2024 (graph above) , while NOAA (https://testbed.spaceweather.gov/products/solar-cycle-progression-updated-prediction-experimental ) is now predicting a similar range between 137 and 164 but within a broader time window between February 2024 and January 2025. The website of the SIDC/SILSO (https://www.sidc.be/SILSO/home ) provides you a front row seat to watch the further unfolding of this story to its climax!
Reminder: Call for EUI and PROBA2 Guest Investigators

The EUI and SWAP/LYRA PI teams welcome research proposals for the 2025 round of their Guest Investigator Program for research based on EUI, SWAP and/or LYRA data analysis by scientists outside the PI teams.
Selected proposers will be invited to spend a few weeks with the PI team at the Royal Observatory in Brussels to obtain expert knowledge on the instruments, to participate in the planning of observations according to the needs of their proposal, and to conduct their research.
Each Guest Investigator may receive reimbursement for travel, accommodation and living expenses.
Proposals must be received by November 1, 2024 (23:59 CET) and visits should be scheduled in 2025.
Details on the 2025 Guest Investigator Call can be found on this webpage: https://www.sidc.be/GuestInvestigator/GI_call_2025
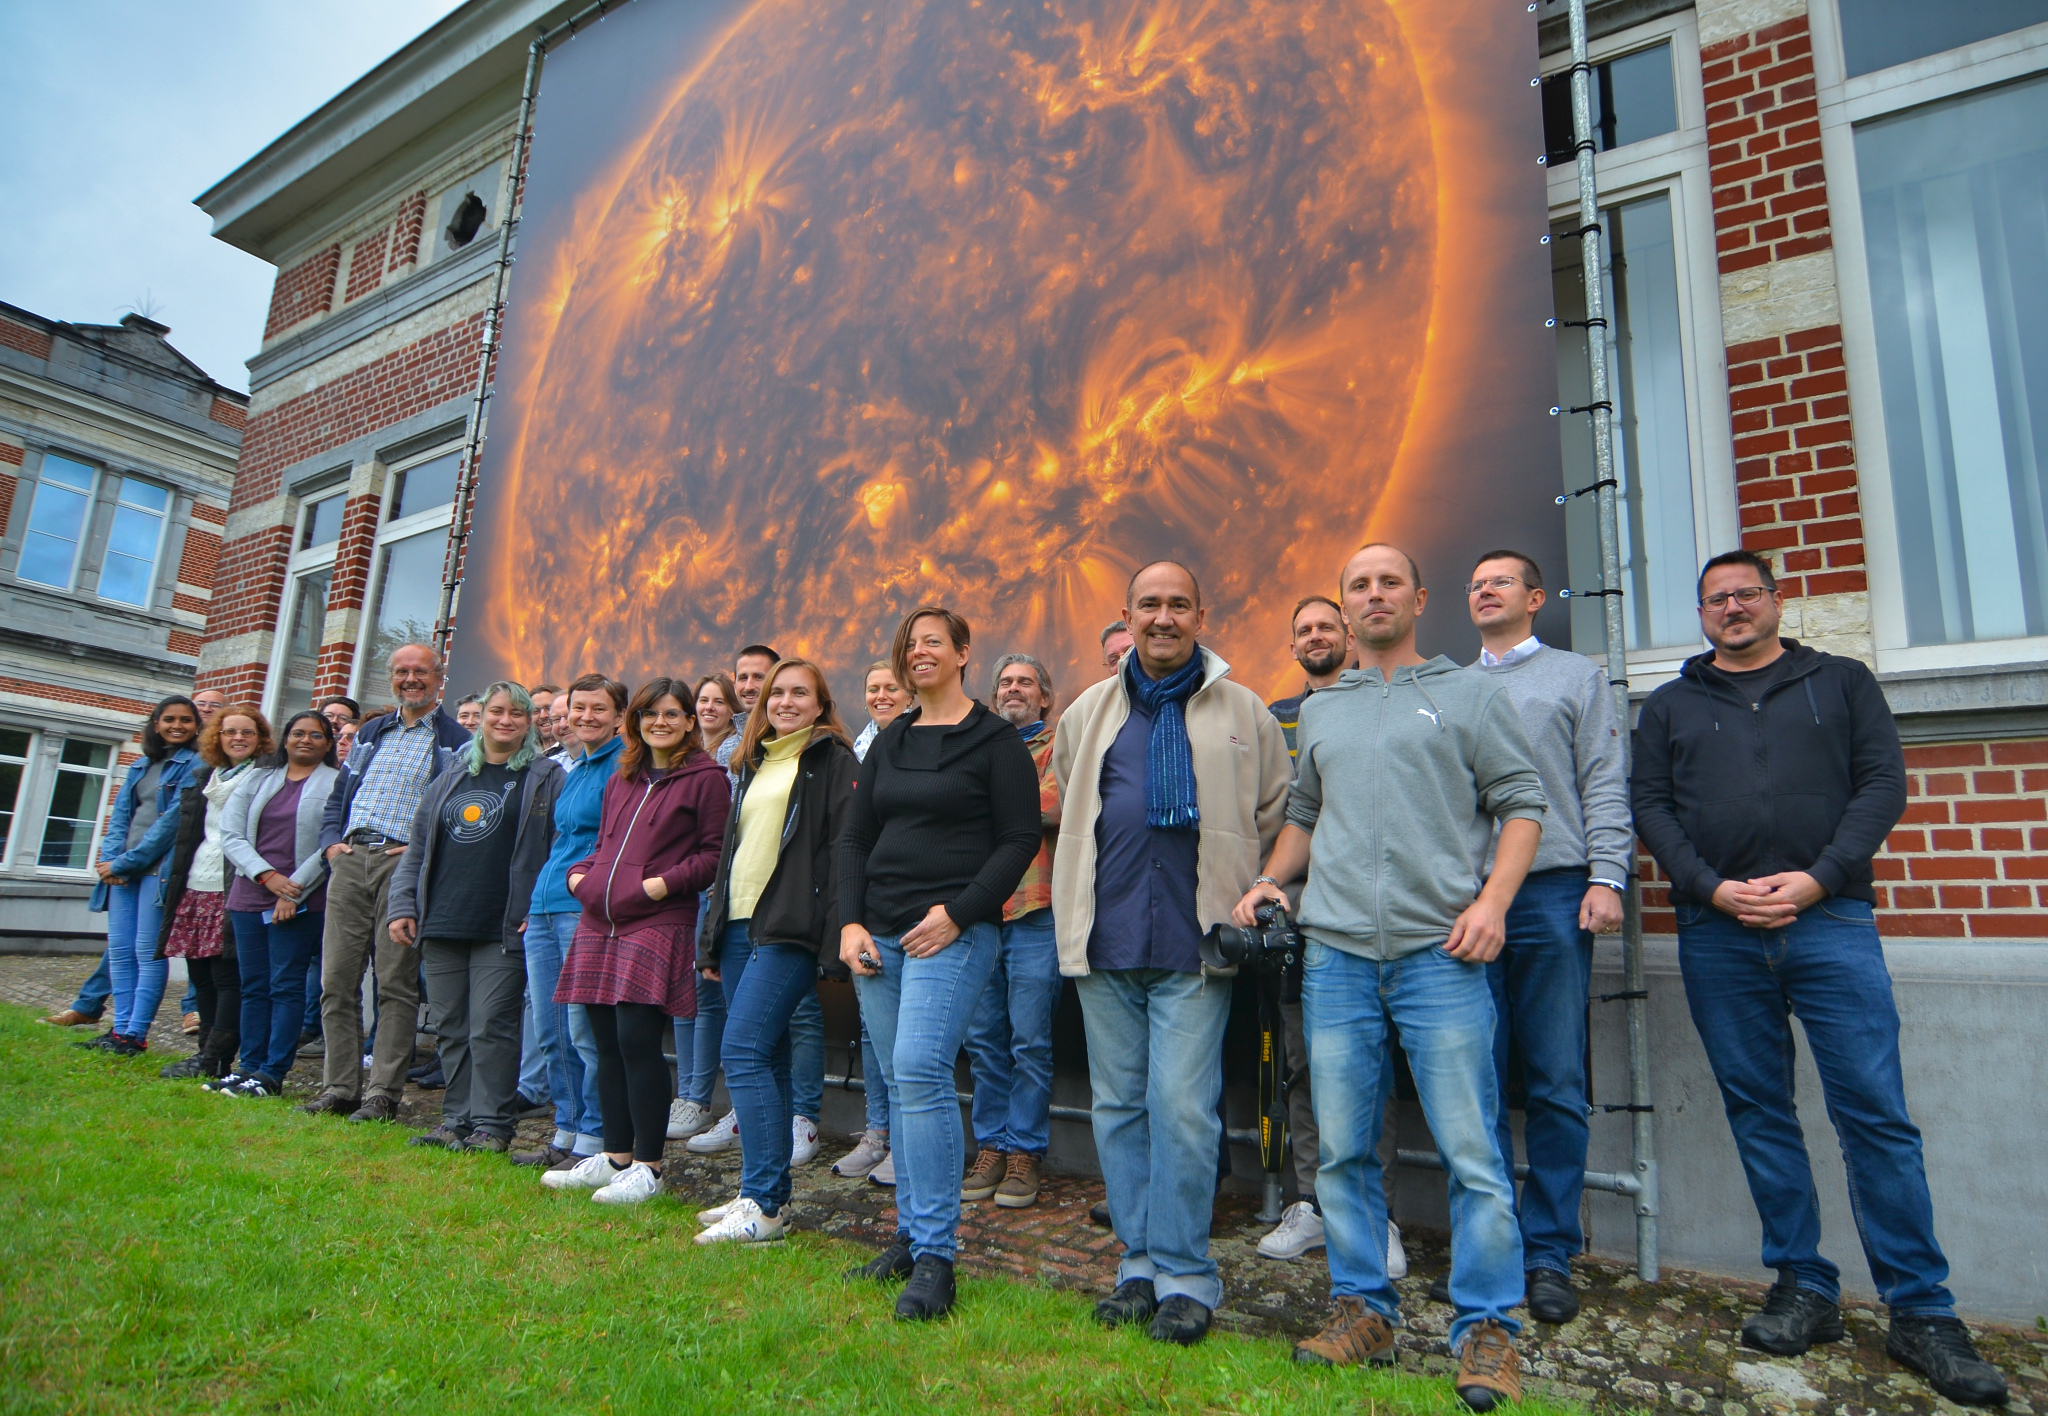
When selected, you will get to work with these wonderful people:
Review of space weather
Solar Active Regions (ARs) and flares
The solar flaring activity over the past week was low. The largest flare had an x-ray flux of C9.6. It occurred on Sept 16th, peaking at 23:57 UTC and originated from the NOAA Active Region 3825 (beta-gamma). There were over fifteen numbered and several unnumbered active regions on the visible solar disc. The beginning of the week was dominated by activity from NOAA AR 3824 and NOAA AR 3825, while NOAA AR 3828 became the largest and most complex region in the second half of the week.
Coronal mass ejections
No Earth-directed coronal mass ejections (CMEs) were detected in the available coronagraph imagery throughout the week.
Coronal Holes
Multiple positive polarity coronal holes have crossed the central meridian, but no clear signatures of high speed streams were observed in the solar wind 1 hour upstream the Earth (L1).
Proton flux levels
The greater than 10 MeV proton flux was gradually increasing at the beginning of the week and has exceeded the 10 pfu minor radiation storm threshold in the UTC morning of Sept 17th. The 10 MeV proton flux returned to nominal levels by the end of Sept 17th and remained at nominal levels throughout the remaining of the week.
Electron fluxes at GEO
The greater than 2 MeV electron flux as measured by GOES 16 and GOES 18 was below the 1000 pfu threshold for most of Sept 17th and Sept 18th and was periodically exceeding the 1000 pfu threshold on the other days. The electron fluence was either at nominal levels or at the border of nominal to moderate levels throughout the entire week.
Solar wind
A high speed solar wind passed the Earth at the beginning of the week. A fast forward shock was detected in the solar wind at the L1 point around 22:49 UTC on Sept 16th. The shock was attributed to an expected arrival of a halo coronal mass ejection (CME), which lifted off the solar surface on Sept 14th. The interplanetary magnetic field jumped from 9 nT to 16 nT and the solar wind velocity initially increased from 455 to 498 km/s/. In the hours following the shock, the interplanetary magnetic field reached up to 19.9 nT with Bz -18 nT and velocities approaching 600 km/s. The solar wind conditions were mildly elevated on Sept 18th and Sept 19th under the waning influence of the Interplanetary CME arrival. Towards the end of the week the solar wind was slow to nominal. The interplanetary magnetic field was directed away from the Sun and switched towards the Sun on Sept 21st.
Geomagnetism
The week started with quiet to active geomagnetic conditions. Early Sept 17th, a severe geomagnetic storm developed with NOAA Kp reaching 8-. At that period, only a major storm hit the region over Potsdam and a minor storm over Belgium. This activity was a direct consequence of the ICME arrival at Earth. The geomagnetic conditions on Sept 18th and Sept 19th were quiet to active with NOAA Kp indicating an isolated minor geomagnetic storm in the early UTC hours of Sept 19th. Quiet to unsettled geomagnetic conditions followed for the remaining of the week.
PROBA2 Observations (16 Sep 2024 - 22 Sep 2024)
Solar Activity
Solar flare activity fluctuated from low to moderate during the week.
In order to view the activity of this week in more detail, we suggest to go to the following website from which all the daily (normal and difference) movies can be accessed: https://proba2.oma.be/ssa
This page also lists the recorded flaring events.
A weekly overview movie (SWAP week 756) can be found here: https://proba2.sidc.be/swap/data/mpg/movies/weekly_movies/weekly_movie_2024_09_16.mp4.
Details about some of this week's events can be found further below.
If any of the linked movies are unavailable they can be found in the P2SC movie repository here: https://proba2.oma.be/swap/data/mpg/movies/.
Sunday September 22

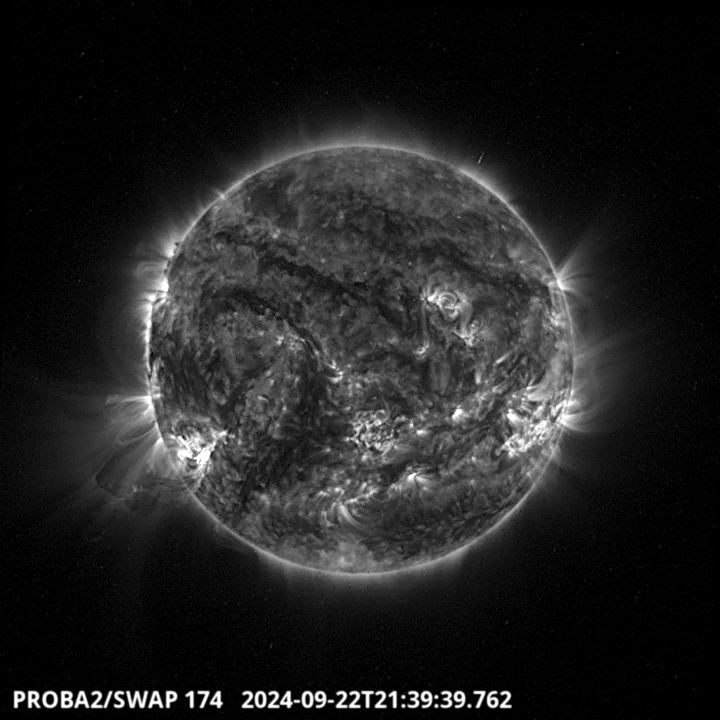
The largest and only M-flare of this week was an M3.7, and it was observed by LYRA (top panel) and SWAP (bottom panel). The flare peaked on 2024-Sep-22 at 21:39 UT and it was associated with a filament eruption. It occurred in the south-eastern quadrant, originating from active region NOAA3835.
Find a SWAP movie of the event here: https://proba2.sidc.be/swap/movies/20240922_swap_movie.mp4.
International Sunspot Number by SILSO
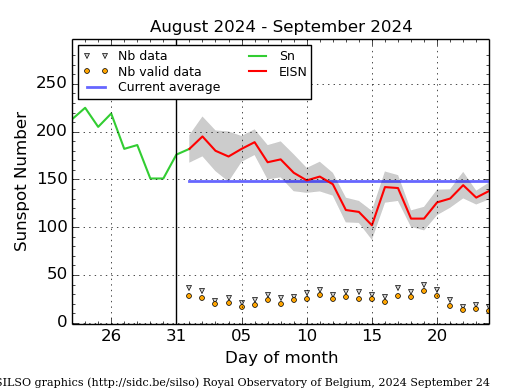
The daily Estimated International Sunspot Number (EISN, red curve with shaded error) derived by a simplified method from real-time data from the worldwide SILSO network. It extends the official Sunspot Number from the full processing of the preceding month (green line), a few days more than one solar rotation. The horizontal blue line shows the current monthly average. The yellow dots give the number of stations that provided valid data. Valid data are used to calculate the EISN. The triangle gives the number of stations providing data. When a triangle and a yellow dot coincide, it means that all the data is used to calculate the EISN of that day.
Noticeable Solar Events
| DAY | BEGIN | MAX | END | LOC | XRAY | OP | 10CM | TYPE | Cat | NOAA |
| 22 | 2112 | 2139 | 2205 | S20E63 | M3.7 | 2N | III/2VI/2 | 3835 |
| LOC: approximate heliographic location | TYPE: radio burst type |
| XRAY: X-ray flare class | Cat: Catania sunspot group number |
| OP: optical flare class | NOAA: NOAA active region number |
| 10CM: peak 10 cm radio flux |
Geomagnetic Observations in Belgium
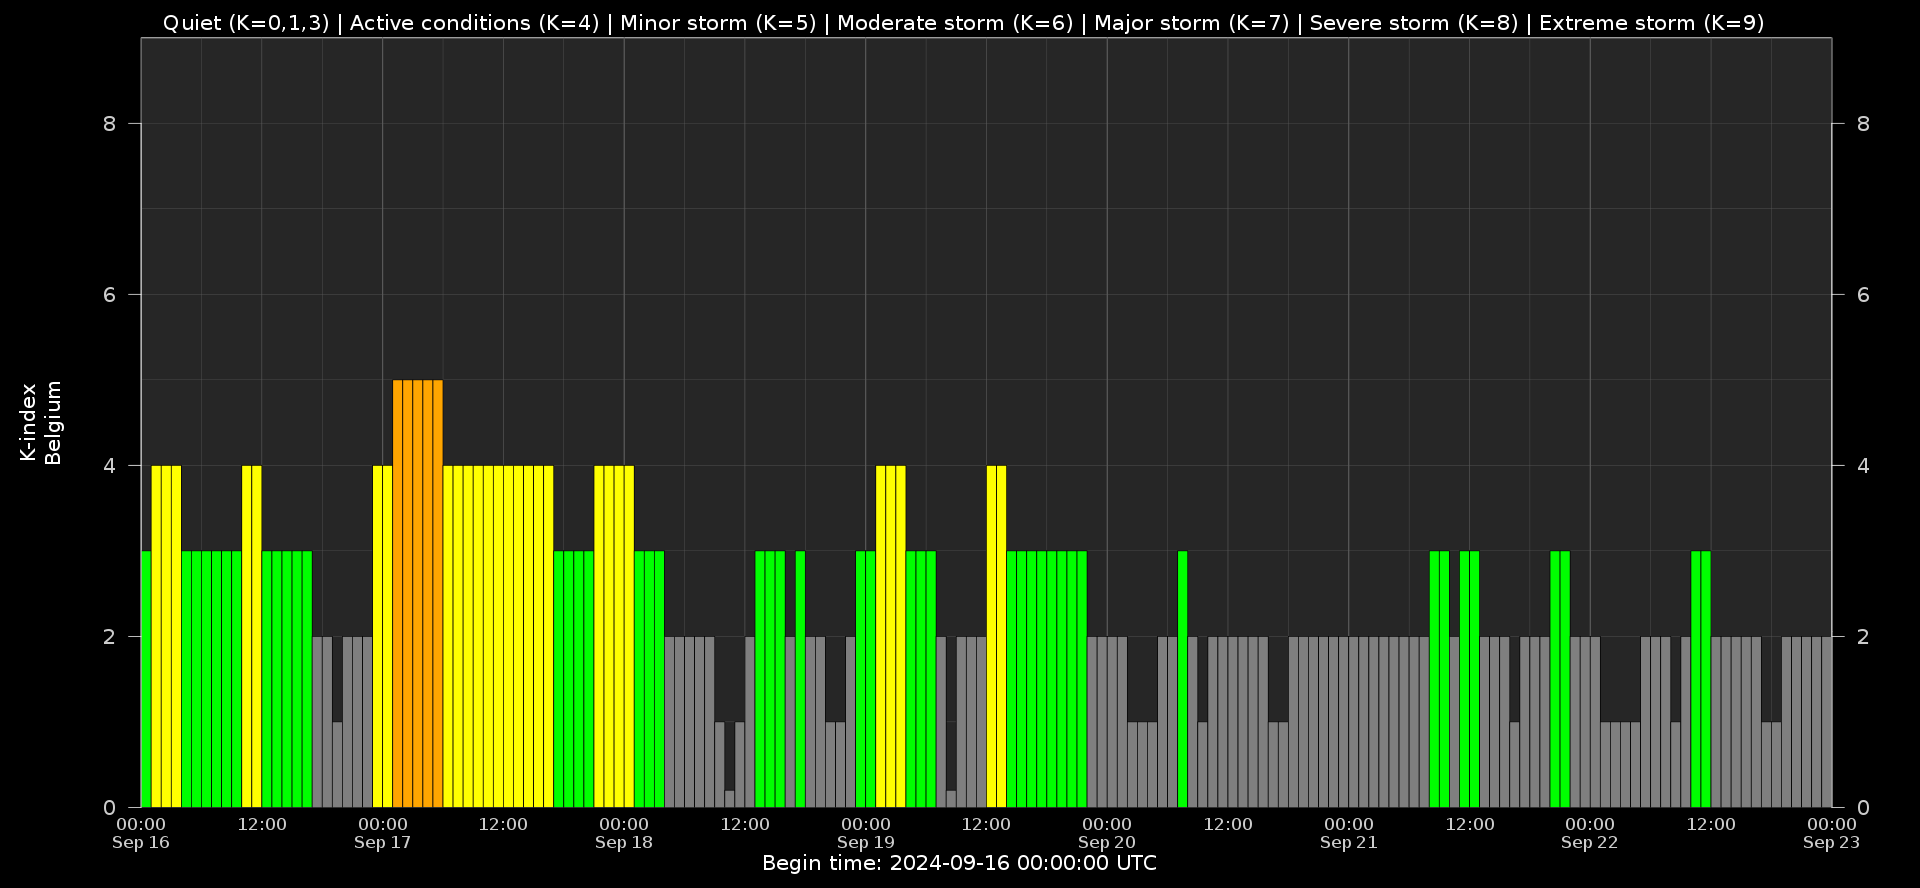
Local K-type magnetic activity index for Belgium based on data from Dourbes (DOU) and Manhay (MAB). Comparing the data from both measurement stations allows to reliably remove outliers from the magnetic data. At the same time the operational service availability is improved: whenever data from one observatory is not available, the single-station index obtained from the other can be used as a fallback system.
Both the two-station index and the single station indices are available here: http://ionosphere.meteo.be/geomagnetism/K_BEL/
The SIDC Space Weather Briefing
The Space Weather Briefing presented by the forecaster on duty from Sept 15 to 22.
The pdf of the presentation can be found here: https://www.stce.be/briefings/20240923_SWbriefing.pdf
STCE Courses and lectures
Courses, seminars and presentations with the Sun-Space-Earth system and Space Weather as the main theme. We provide occasions to get submerged in our world through educational, informative and instructive activities.
* Sep 27, STCE at the Wisenight Science festival in the Planetarium, Brussel, https://wisenight.eu/
* Sep 30 - Oct 3, STCE Space Weather Introductory Course, Brussels, Belgium - Registrations are complete - https://events.spacepole.be/event/204/
* Oct 2, STCE Seminar - Solar Eruptions: Mechanisms and Modeling, Space Pole, Brussels
* Oct 21 - 22, Second e-SWAN school - data, models and observations relevant to Space Weather and the Ionosphere, by the STCE - Registrations are open, https://events.spacepole.be/event/209/
* Nov 25 - 27, STCE course: Space Weather impacts on ionospheric wave propagation, focus on GNSS and HF, Brussels, Belgium - Registrations are open, https://events.spacepole.be/event/206/
* Dec 5-6, STCE Course Space Weather impacts on aviation, Brussels, Belgium - Registrations are open, https://events.spacepole.be/event/205/
To register for a course and check the seminar details, surf to the STCE Space Weather Education Center: https://www.stce.be/SWEC
If you want your event in the STCE newsletter, contact us: stce_coordination at stce.be