- Table of Content
- 1.Top 10 lists
- 2.Second E-SWAN ...
- 3.The October 2 ...
- 4.Review of Sola...
- 5.International ...
- 6.PROBA2 Observa...
- 7.Noticeable Sol...
- 8.Geomagnetic Ob...
- 9.Review of Iono...
- 10.The SIDC Space...
- 11.Upcoming Activ...
2. Second E-SWAN school - registrations are open
3. The October 2 solar eclipse
4. Review of Solar and Geomagnetic Activity
5. International Sunspot Number by SILSO
6. PROBA2 Observations
7. Noticeable Solar Events
8. Geomagnetic Observations in Belgium
9. Review of Ionospheric Activity
10. The SIDC Space Weather Briefing
11. Upcoming Activities
Top 10 lists
Solar activity is now passing through the phase of solar cycle maximum. So, it would be good to have an idea on how strong this solar cycle (SC25) has been in terms of intensity of solar flares, proton events and geomagnetic storms. The data period runs up to 1 October.
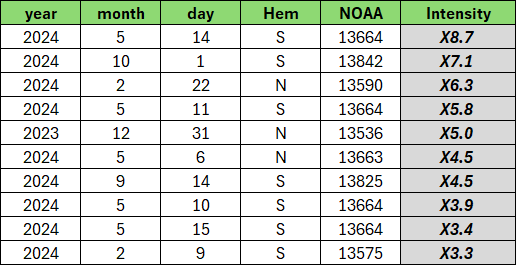
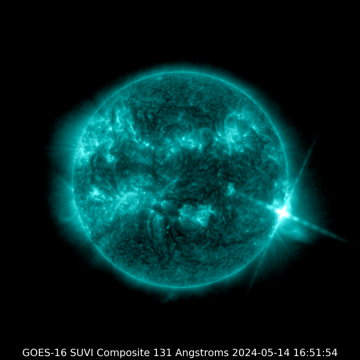
The strongest solar flare so far during SC25, so up to 1 October, was an X8.7 flare produced by famous sunspot region NOAA 13664 on 14 May 2024 (see this STCE newsitem at https://www.stce.be/news/704/welcome.html ). This active region has 4 entries in the Top 10 of strongest flares, as shown in the table above. It is very likely that even stronger flares have been produced but on the Sun's far side, as observed by instruments on board of Solar Orbiter. Examples are on 20 May and on 22 July 2024, when intensities of X12 (https://www.stce.be/news/712/welcome.html ) and X14 (https://www.stce.be/news/716/welcome.html ) may have been reached. For comparison purposes, the strongest flare observed in the GOES-era was the X40 flare (rescaled) that occurred on 4 November 2003.
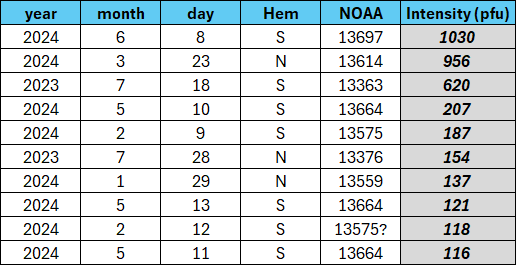
So far this solar cycle, the Sun has produced about 2 dozen of minor proton events, i.e. when the larger than 10 MeV proton flux reached values between 10 and 100 pfu. Another 10 proton events have exceeded 100 pfu, and of those only one exceeded 1000 pfu. So the strongest proton event so far (1030 pfu) took place on 8 June 2024 and was related to an M9 flare produced by active region NOAA 13697, which was the return of NOAA 13664 (https://www.stce.be/news/705/welcome.html ). Two proton events have been associated to a minor Ground Level Enhancement (GLE), i.e. when the secondary particles from these proton events were measured by ground based neutron detectors. This was on 28 October 2021 and on 11 May 2024. For reference, the previous solar cycle had no GLEs, but the strongest proton event reached a peak of 6530 pfu (8 March 2012). The largest proton event during the GOES-era so far was on 23-24 March 1991 (43.000 pfu).
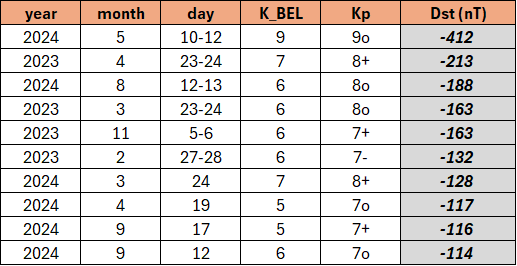
As far as geomagnetic storms goes, it's no surprize that the strongest storm was the famous event from 10-12 May earlier this year (see this STCE newsitem at https://www.stce.be/news/701/welcome.html ). The table above ranks the geomagnetic disturbances according to the Dst index (provisional values; expressed in nT; the more negative, the stronger the storm ; Kyoto WDC https://wdc.kugi.kyoto-u.ac.jp/ ). After the -412 nT of the May 2024 storm, the intensity of the geomagnetic storms in the list drops off quickly with -so far- only one more storm with a Dst smaller than -200 nT and only 3 with intensities between -150 and -200 nT. As a reference, the geomagnetic storm of 13-14 March 1989 had a Dst of -589 nT, and the 20 November 2003 storm reached -422 nT. The table also mentions the corresponding Kp index (https://kp.gfz-potsdam.de/en/ ) as well as the local K index for Belgium (K_BEL : http://ionosphere.meteo.be/geomagnetism/K_BEL/ ).
Though we are now at solar cycle maximum and gradually may see a gentle decrease in sunspot numbers and solar flare, we may still expect strong space weather storms. Indeed, the strongest flares and geomagnetic storms usually seem to occur 2-3 years after solar cycle maximum, such as e.g. in 2003 and 2005 during SC23 and 2015 and 2017 during SC24. And because we basically haven't seen any strong proton event, it's almost certain we can still expect a really strong proton event (5000 pfu or larger) in the next few years. So it may be wise to keep that umbrella nearby, we may still need it!
Second E-SWAN school - registrations are open
Second E-SWAN school: Data, models and observations relevant to Space Weather and the Ionosphere
The European Space Weather Week is highly interdisciplinary by nature and its participants are very diverse. Scientists, engineers, satellite operators, power grid technicians, communication and navigation specialists, people working in aviation, space weather service providers, they all have something in common: they want to expand their horizons and gain a better understanding of space weather and its impacts.
The aim of this school is to help early careers and people new to the field gain a basic understanding of the different types of data that are used to study, monitor and predict space weather and ionospheric effects. After finishing the lectures, these newcomers should have a basic understanding of the different data sets that will be presented during the conference and how to interpret them.
The school will cover the basics of space weather, as well as space weather and ionospheric data, models, and indices.
The course is given by qualified STCE staff. Lectures on particular subjects will be given by STCE experts who gained expertise through scientific research, involvement in space missions as well as space weather operations, monitoring, and forecasting.
Prepare for an unconventional course at the speed of light.
Time is ticking - don't let the bomb burst.
Chop chop, kaboom!
Practical information:
October 21 and 22, 2024 - 14h-17h CET
Enter the zoom room at 13:50 to get all information before launch at 14:00 CET sharp.
Registration is free, but mandatory: https://events.spacepole.be/e/ESWW2024school

The October 2 solar eclipse
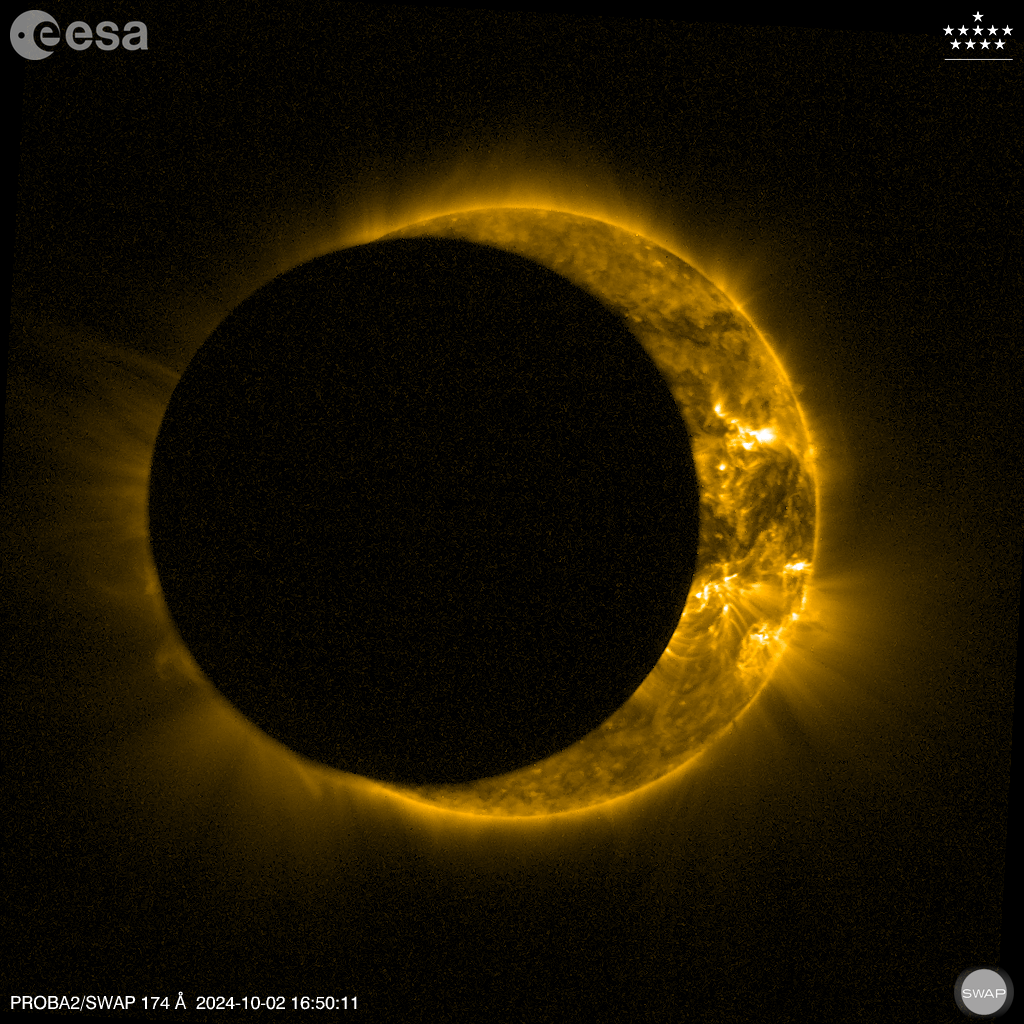
After all the excitement surrounding the Great American Eclipse earlier this year, it is easy to forget that another one of these mesmerising events was scheduled for the fall. This second eclipse of the year was an annular one (as observed from ground), which is even more rare than a regular (partial) eclipse. During an annular eclipse, the Moon is further from Earth in its orbit and thus appears smaller than during a total solar eclipse. As a result it can not cover the complete solar disk. We observe a ring (an annulus) of bright sunlight surrounding the Moon.
The October 2 annular eclipse was difficult to observe from ground. Its shadow passed over the very tip of South America, so only observers in Chile and Argentina were able to enjoy this spectacle. Larger parts of South America and even New Zealand could observe a partial eclipse with various degrees of occultation.
PROBA2, on the other hand, profited from its fast sun-sunchronous orbit to observe the event multiple times. The Moon passed 5 times in the field-of-view of the SWAP instrument, of which 3 transits obscured at least part of the solar disk. Two covered a significant part of the solar disk, obscuring up to 75% and 62% of the solar surface.
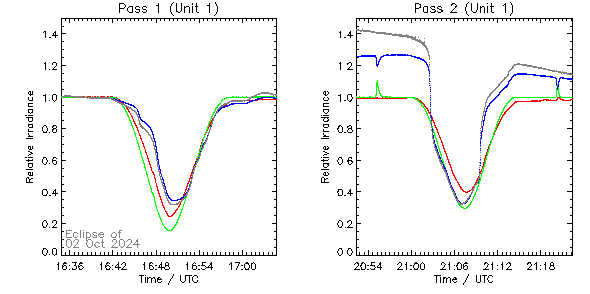
As for all eclipses, LYRA activated one of its backup units, which acquires in parallel with the nominal unit. The instrument monitors the progressive extinction of the solar light in its channels that we observe in the ultraviolet (red and green curves) and extreme ultraviolet (black and blue curves). The signal extinction caused by the Moon passing in front of the Sun, as observed across the four channels of the backup unit, is presented below. During the second passage, this extinction occurred while the Sun was recovering from an eruption, which explains the overall decrease in signal observed before and after the eclipse in two of the LYRA channels (blue and black).
All observations and movies can be found in this directory: https://proba2.sidc.be/Events/2024-Oct-02-SolarEclipse/
Review of Solar and Geomagnetic Activity
WEEK 1239 from 2024 Sep 23
Solar Active Regions and flares
There were 17 active regions (ARs) visible throughout the week. Only NOAA AR 3842 evolved into a complex magnetic field configuration (beta-gamma-delta) and created the last M-class flare of the week, on 29 September. There were four other M-class flares, from NOAA ARs 3835 (22 September), 3836 (23 September), 3828 (25 September), 3839 (26 September).
Coronal mass ejections
A partial halo CME with apparent angular width around 180 degrees erupted on 22 September at 21:37 UTC (first seen by LASCO C2), with a speed of around 1300 km/s. It was mostly directed to the southeast and it had an Earth-directed component which finally did not arrive to the Earth.
A partial halo CME with angular width around 150 degrees erupted on 26 September, first seen by LASCO C2 at 09:12 UTC. This event was back-sided.
Coronal Holes
A small equatorial positive polarity coronal hole crossed the central meridian on 21 September.
Another small equatorial negative polarity coronal hole crossed central meridian on 26 September.
Proton flux levels
The greater than 10 MeV GOES proton flux was at nominal levels the full week.
Electron fluxes at GEO
The greater than 2 MeV electron flux was below the threshold level, except for brief periods on 22, 23 and 25 September when it was slightly above.
The electron fluence was at normal levels throughout the week.
Solar wind
The week started with slow solar wind at L1. On 24 September, solar wind conditions measured in L1 were slightly disturbed with the interplanetary magnetic field reaching 13 nT and Bz down to -10 nT. The solar wind speed remained below 490 km/s. This is probably due to the arrival of a CME from 19 September.
On 25 September, solar wind conditions near Earth showed the arrival of the expected (mild) high speed stream from a positive polarity equatorial coronal hole, with solar wind speed up to 550 km/s. The interplanetary magnetic field reached 12 nT and Bz went down to -10 nT. These conditions continued for about 48 hours.
During 27 and 28 September, slow solar wind conditions were observed at L1. On 29 September the solar wind parameters were disturbed under the influence of high speed streams (HSSs) from the negative polarity coronal hole which crossed the central meridian on 26 September. The solar wind speed ranged between 310 km/s to 530 km/s. The North-South component (Bz) ranged between -12 and 13 nT. The interplanetary magnetic field ranged from 2 nT to 15 nT.
Geomagnetism
The geomagnetic conditions were mostly quiet to unsettled during the week, except on 23 September (K_Bel and Kp up to 4) due to an ICME, 25-26 September (K_Bel up to 5 and Kp up to 4) due to a HSS and 29 September (K_Bel and Kp up to 4) due to a HSS.
International Sunspot Number by SILSO
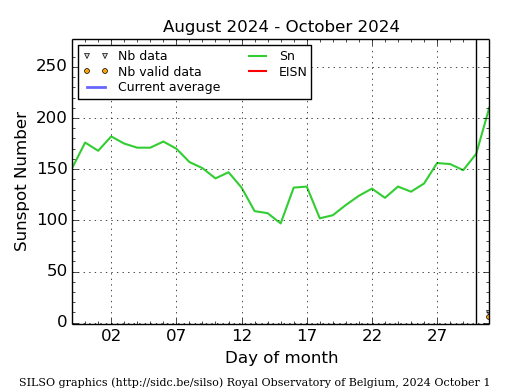
The daily Estimated International Sunspot Number (EISN, red curve with shaded error) derived by a simplified method from real-time data from the worldwide SILSO network. It extends the official Sunspot Number from the full processing of the preceding month (green line), a few days more than one solar rotation. The horizontal blue line shows the current monthly average. The yellow dots give the number of stations that provided valid data. Valid data are used to calculate the EISN. The triangle gives the number of stations providing data. When a triangle and a yellow dot coincide, it means that all the data is used to calculate the EISN of that day.
PROBA2 Observations
Solar Activity
Solar flare activity fluctuated from low to moderate during the week.
In order to view the activity of this week in more detail, we suggest to go to the following website from which all the daily (normal and difference) movies can be accessed: https://proba2.oma.be/ssa
This page also lists the recorded flare events.
A weekly overview movie (SWAP week 757) can be found here: https://proba2.sidc.be/swap/data/mpg/movies/weekly_movies/weekly_movie_2024_09_23.mp4.
Details about some of this week's events can be found further below.
If any of the linked movies are unavailable they can be found in the P2SC movie repository here: https://proba2.oma.be/swap/data/mpg/movies/.
Sunday September 29
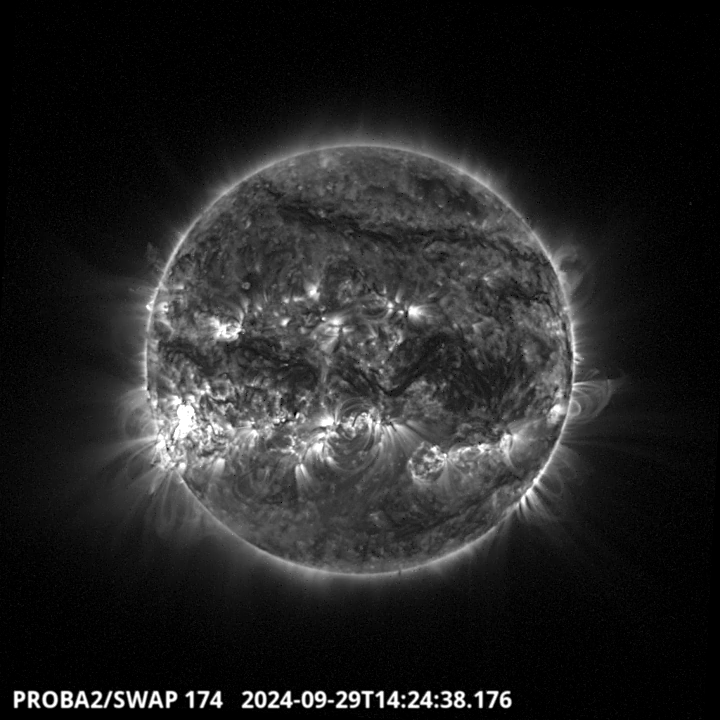
The largest flare of this week was a two-part M1.7, and it was observed by LYRA (top panel) and SWAP (bottom panel). The two peaks occurred on 2024-Sep-29 at 14:24 and 14:41 UT. The event originated from active region NOAA 3842, located in the south-eastern quadrant.
Find a SWAP movie of the event here: https://proba2.sidc.be/swap/movies/20240929_swap_movie.mp4.
Noticeable Solar Events
| DAY | BEGIN | MAX | END | LOC | XRAY | OP | 10CM | TYPE | Cat | NOAA |
| 23 | 1423 | 1456 | 1534 | N22W33 | M1.3 | S | 3836 | |||
| 25 | 2257 | 2312 | 2323 | S12W46 | M1.3 | 1F | 6 | 3828 | ||
| 26 | 2258 | 2312 | 2320 | M1.4 | 3839 | |||||
| 29 | 1249 | 1253 | 1258 | S11E25 | M1.0 | SF | ||||
| 29 | 1409 | 1424 | 1431 | S15E51 | M1.7 | 1F | III/1 | 3842 | ||
| 29 | 1431 | 1441 | 1446 | M1.7 | 3842 |
| LOC: approximate heliographic location | TYPE: radio burst type |
| XRAY: X-ray flare class | Cat: Catania sunspot group number |
| OP: optical flare class | NOAA: NOAA active region number |
| 10CM: peak 10 cm radio flux |
Geomagnetic Observations in Belgium
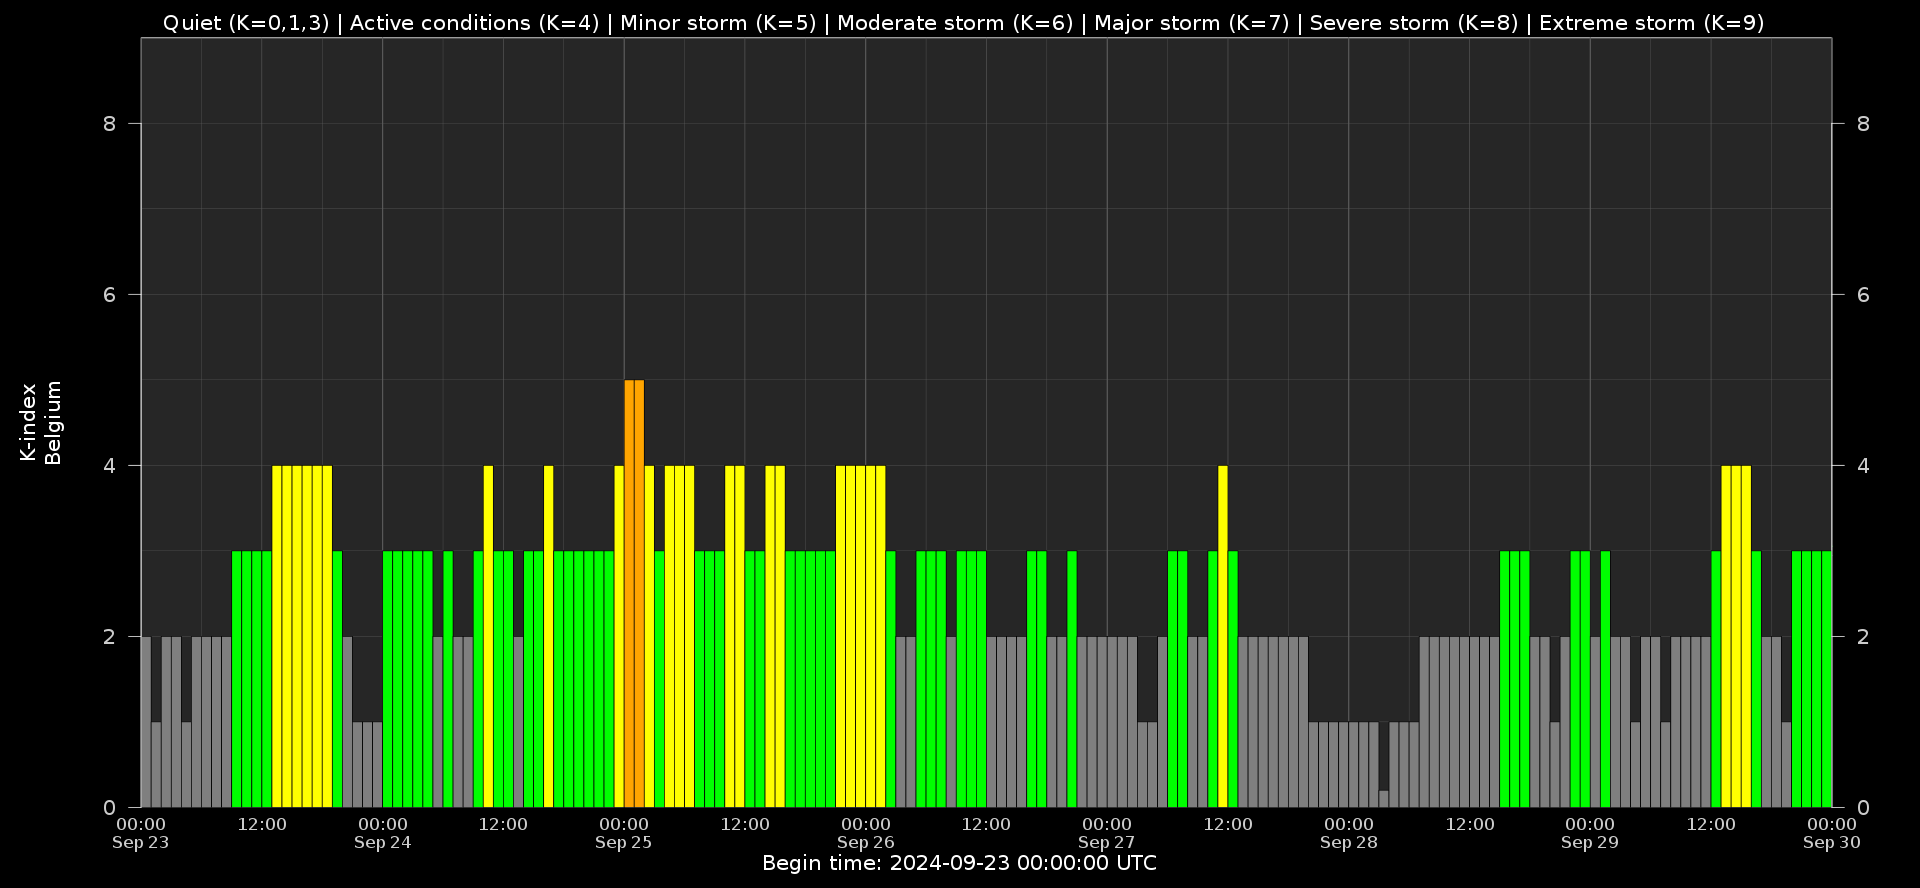
Local K-type magnetic activity index for Belgium based on data from Dourbes (DOU) and Manhay (MAB). Comparing the data from both measurement stations allows to reliably remove outliers from the magnetic data. At the same time the operational service availability is improved: whenever data from one observatory is not available, the single-station index obtained from the other can be used as a fallback system.
Both the two-station index and the single station indices are available here: http://ionosphere.meteo.be/geomagnetism/K_BEL/
Review of Ionospheric Activity
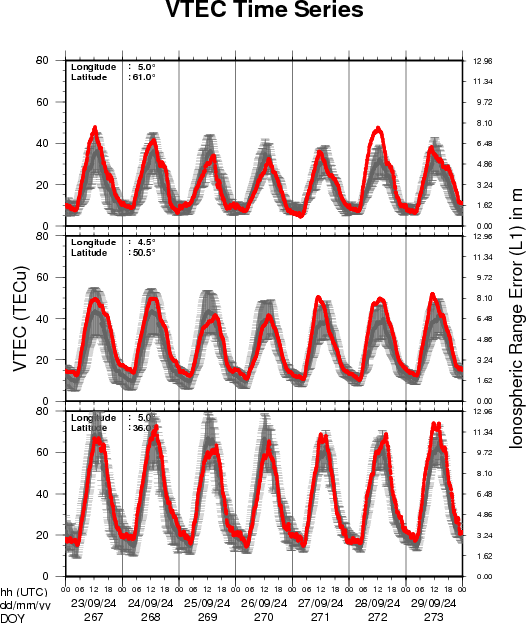
VTEC time series at 3 locations in Europe from 23 Sep 2024 till 29 Sep 2024
The top figure shows the time evolution of the Vertical Total Electron Content (VTEC) (in red) during the last week at three locations:
a) in the northern part of Europe(N 61deg E 5deg)
b) above Brussels(N 50.5deg, E 4.5 deg)
c) in the southern part of Europe(N 36 deg, E 5deg)
This top figure also shows (in grey) the normal ionospheric behaviour expected based on the median VTEC from the 15 previous days.
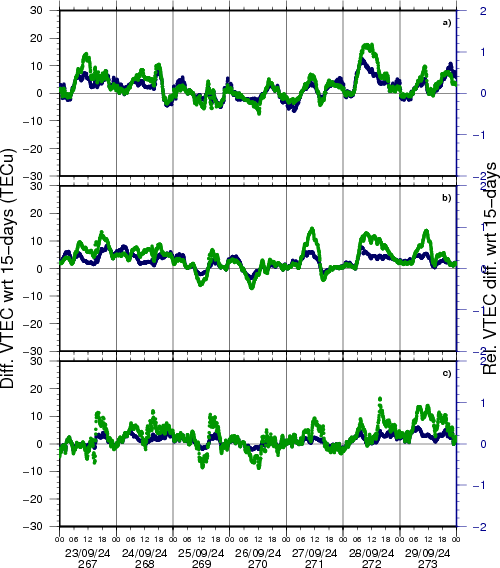
The time series below shows the VTEC difference (in green) and relative difference (in blue) with respect to the median of the last 15 days in the North, Mid (above Brussels) and South of Europe. It thus illustrates the VTEC deviation from normal quiet behaviour.
The VTEC is expressed in TECu (with TECu=10^16 electrons per square meter) and is directly related to the signal propagation delay due to the ionosphere (in figure: delay on GPS L1 frequency).
The Sun's radiation ionizes the Earth's upper atmosphere, the ionosphere, located from about 60km to 1000km above the Earth's surface.The ionization process in the ionosphere produces ions and free electrons. These electrons perturb the propagation of the GNSS (Global Navigation Satellite System) signals by inducing a so-called ionospheric delay.
See http://stce.be/newsletter/GNSS_final.pdf for some more explanations; for more information, see https://gnss.be/SpaceWeather
The SIDC Space Weather Briefing
The forecaster on duty presented the SIDC briefing that gives an overview of space weather from September 23 to 29.
The pdf of the presentation can be found here: https://www.stce.be/briefings/20240930_SWbriefing.pdf
Upcoming Activities
Courses, seminars and presentations with the Sun-Space-Earth system and Space Weather as the main theme. We provide occasions to get submerged in our world through educational, informative and instructive activities.
* Oct 21 - 22, Second e-SWAN school - data, models and observations relevant to Space Weather and the Ionosphere, by the STCE - Registrations are open, https://events.spacepole.be/event/209/
* Nov 25 - 27, STCE course: Space Weather impacts on ionospheric wave propagation, focus on GNSS and HF, Brussels, Belgium - Registrations are open, https://events.spacepole.be/event/206/
* Dec 5-6, STCE Course Space Weather impacts on aviation, Brussels, Belgium - Registrations are open, https://events.spacepole.be/event/205/
To register for a course and check the seminar details, surf to the STCE Space Weather Education Center: https://www.stce.be/SWEC
If you want your event in the STCE newsletter, contact us: stce_coordination at stce.be