- Table of Content
- 1.Impacts from a...
- 2.Press Release:...
- 3.Space Weather ...
- 4.Review of sola...
- 5.International ...
- 6.PROBA2 Observa...
- 7.Noticeable Sol...
- 8.Geomagnetic Ob...
- 9.Review of Iono...
- 10.The SIDC Space...
- 11.Upcoming Activ...
2. Press Release: Solar Storm - chances for Aurora in Belgium
3. Space Weather Introductory Course - September edition
4. Review of solar and geomagnetic activity
5. International Sunspot Number by SILSO
6. PROBA2 Observations
7. Noticeable Solar Events
8. Geomagnetic Observations in Belgium
9. Review of Ionospheric Activity
10. The SIDC Space Weather Briefing
11. Upcoming Activities
Impacts from a severe geomagnetic storm
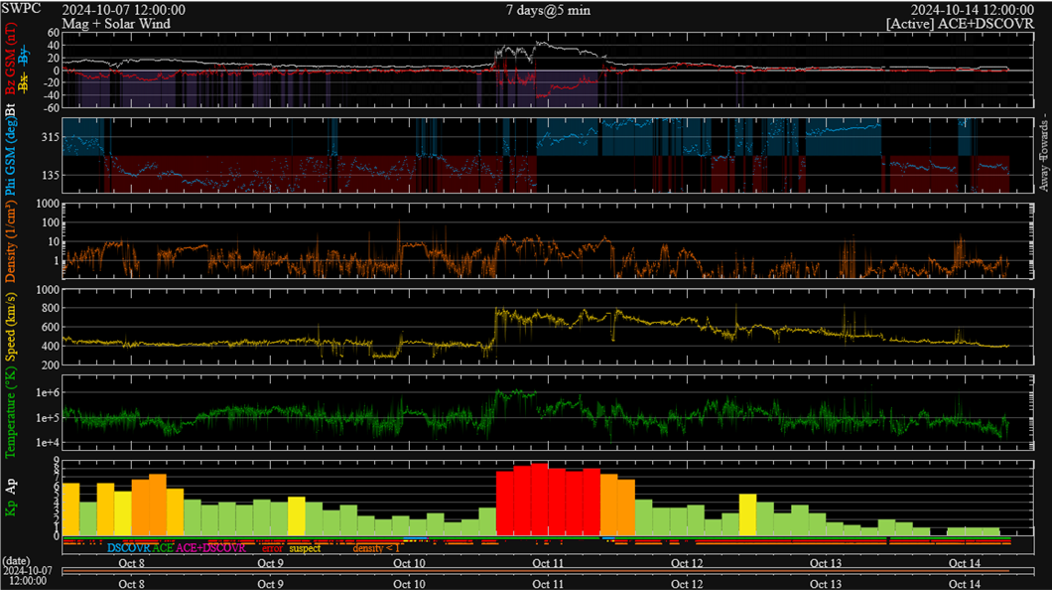
The interplanetary coronal mass ejection (ICME) that was associated with the X1.8 solar flare early on 9 October arrived shortly after noon on 10 October (STCE newsitem at https://www.stce.be/news/728/welcome.html ). Solar wind speed (yellow curve) jumped from 400 to around 800 km/s, while, at its strongest, Bz (red curve) reached -46 nT and was around -45 nT for nearly 2 hours. The resulting geomagnetic storm was at severe levels for 18 consecutive hours, and reached 9- during the 21-24UTC interval on 10 October (around local midnight in Belgium). A map combining solar wind data and the Kp index can be found underneath (DSCOVR - https://www.swpc.noaa.gov/products/real-time-solar-wind ). The provisional Dst index reached -335 nT during the 01-02UTC interval on 11 October. Both indices made this the second strongest geomagnetic storm so far this solar cycle, only superseded by the 10-11 May storm earlier this year when the Kp and Dst index reached resp. 9o and -412 nT.
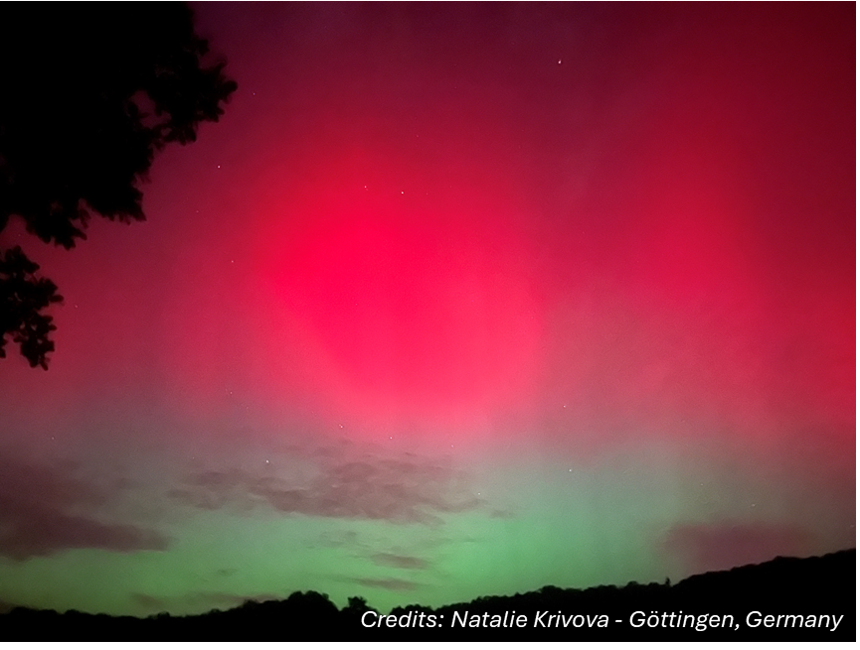
Though this storm was slightly less severe than the May storm, aurora have been observed and/or photographed as far south as California and Texas in the United States, and from Italy and Greece in Europe (Spaceweather.com - https://www.spaceweather.com/ ). Also observers in South-Africa and Australia reported on the colourful lights in the night sky. Aurora were well observed from the Netherlands and Germany, and through cloud breaks from Belgium (HLN, VRT). The impressive image underneath was taken by Natalie Krivova from G�ttingen, Germany late on 10 October.
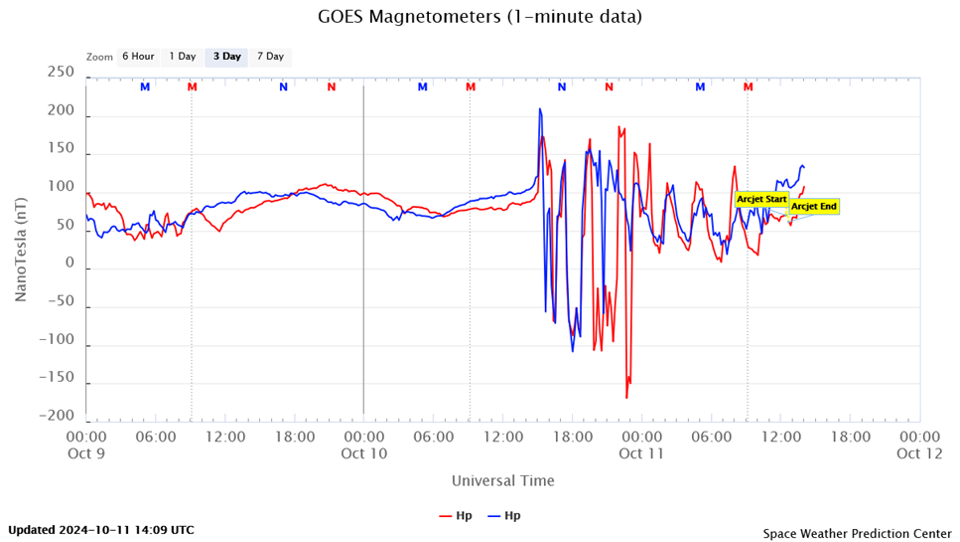
Satellites in geostationary orbits such as GOES were exposed to the turbulent solar wind as the ICME pushed the protective magnetopause closer to the Earth than the altitude these satellites were orbiting. This can be seen in the graph underneath showing measurements of a component of the Earth's magnetic field by GOES (https://www.swpc.noaa.gov/products/goes-magnetometer ). Between about 15UTC and 01UTC, there are clearly strong variations in the observed values, a lot stronger than the quiet daily undulation. It means that GOES was exposed to the turbulent solar wind for about 10 hours, complicating spacecraft operations and research.
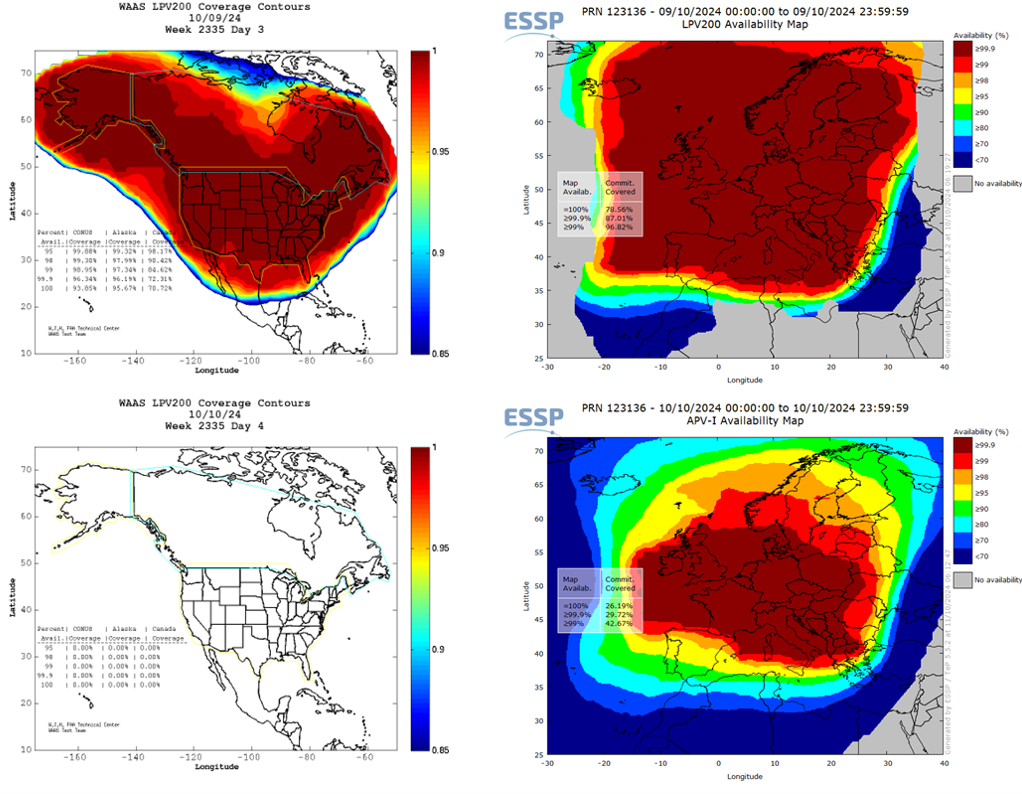
Certain GNSS applications (Global Navigation Satellite Systems, such as GPS and Galileo) were disturbed or entirely unavailable. This was for example reflected in the reduced availability of some GNSS-based aviation tools, such as LPV200 - the vertically-guided landing approach aid for airplanes to as low as 200 feet (61 meters) above ground level (WAAS (USA), EGNOS (Europe) ; STCE Newsitem https://www.stce.be/news/616/welcome.html for more info). A brown colour is good availability, blue means significantly degraded. For WAAS, LPV200 availability was even absent from around 20UTC on 10 October until 12UTC on 11 October, i.e. during the most powerful phase of the geomagnetic storm. Some advisories were sent to the civil aviation for disturbances of GNSS (PECASUS - https://pecasus.eu/ ). Also, so far, no reports were filed about crashed drones or desperate farmers as was the case during the May storm (STCE newsitem at https://www.stce.be/news/701/welcome.html ).
The GNSS section of the Royal Observatory of Belgium (ROB/GNSS - https://gnss.be/SpaceWeather/VTEC_Time_Series.php ) recorded a very strong negative phase of the associated ionospheric storm (see this STCE newsitem for more info on the phases of an ionospheric storm https://www.stce.be/news/640/welcome.html ). As a result, from 11 October onwards, the upper portion of the high frequencies (HF ; 3-30 MHz) was depressed at certain locations and for certain intervals. PECASUS/CRC has sent several advisories to civil aviation for this so-called post storm depression, as well as for auroral absorption - another source contributing to disturbed HF communications.
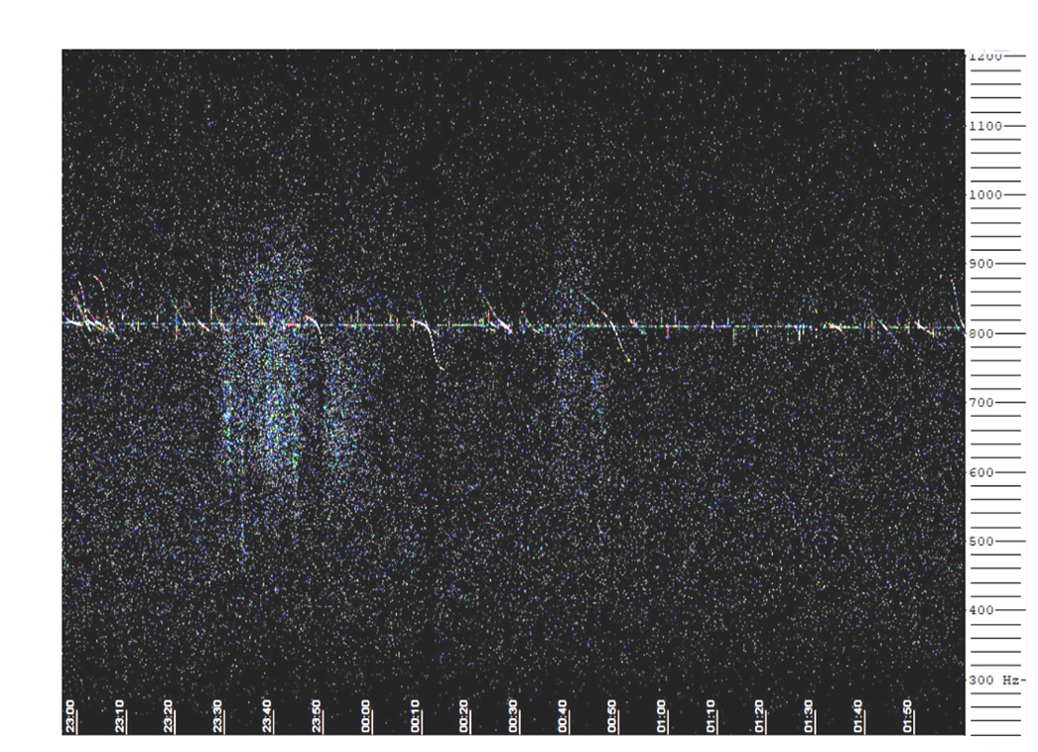
Belgian radio meteor observers from the BRAMS network (Belgian RAdio Meteor Stations ; https://brams.aeronomie.be/ ; see this STCE newsitem for more info on BRAMS https://www.stce.be/news/512/welcome.html ) recorded considerable noise in their radio displays hampering a good detection of any radio signature from a passing meteor. In the image underneath, time is on the horizontal axis and vertically there's band of a few 100 Hz wide near the radio frequency of the beacon at 49.99 MHz (Ypres, Belgium; courtesy Felix Verbelen). The reversed "S"-shapes are reflections from passing airplanes. The strongest noise is visible between 23:30 and 24:00UTC on 10 October, right around the time of the most severe phase of the geomagnetic storm. The disturbance on these radio beacons was much less pronounced than during the May storm, when even the direct signal was barely visible in the spectrograms during the main phase of the storm (see the STCE newsitem at https://www.stce.be/news/701/welcome.html ).
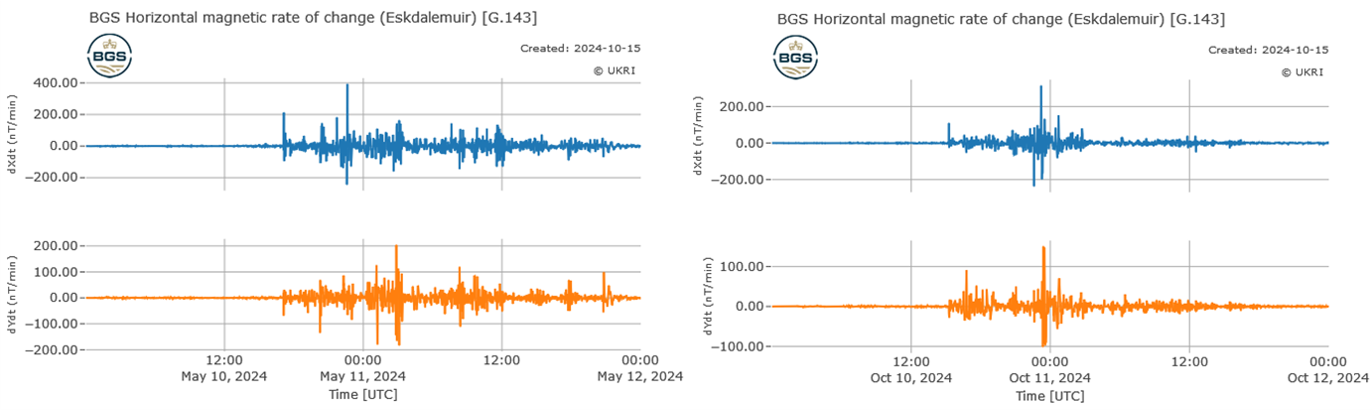
Geomagnetically Induced Currents (GIC ; see this STCE newsitem for an example https://www.stce.be/news/529/welcome.html ) have also been observed worldwide, but -so far- also here no reports of strong effects or damage. As readily could be seen in the NOAA/USGS maps (https://www.swpc.noaa.gov/products/geoelectric-field-models-1-minute ), the observed voltages about 5V/km) were slightly lower than in May, and only a quarter of the values observed during the big storm of March 1989 which was the cause of the Quebec power grid failure. Similar conclusions can be drawn for Europe. The Eskdalemuir Observatory in Scotland (BGS - https://geomag.bgs.ac.uk/data_service/space_weather/geoelectric.html) recorded rates of change in the magnetic field components as large as 315 nT/min (see maps underneath; from ESA SWx portal at https://swe.ssa.esa.int/ ), which is slightly weaker than in May this year (395 nT/min) and about a third of what was recorded by this observatory during the March 1989 storm (934 nT/min - see C. Beggan - https://nora.nerc.ac.uk/id/eprint/500436/ ).
So, though the 10-11 October storm certainly was not as strong than the 10-11 May 2024 storm, it certainly left its footprint in various technological domains.
Press Release: Solar Storm - chances for Aurora in Belgium
By the STCE, the Belgian space weather institute
On October 9, 03:56 Belgian time, the Sun released an extreme solar flare of category X. This is an intense light flash. We define 5 categories: A,B,C,M and X. An X-flare is 10000 (!) times stronger than an A-flare. A solar flare has an immediate impact on radio communication on the day side of the Earth as radio waves are attenuated. It can even occur that radio communication is completely impossible.
The solar flare was also accompanied by a shower of energetic particles that entered the atmosphere at the Earth's poles and, like the flash of light, made radio communication difficult. These particles also added noise to the observations of a telescope aboard the Solar Orbiter satellite.
Along with the flash of light, a solar cloud of magnetised plasma escaped, which we observed shortly thereafter in images of the solar atmosphere. A plasma cloud consists of an extremely hot gas that is electrically charged and carries a magnetic field.
The active area where the light flash occurred and the cloud escaped was in the center of the solar disk, on the Sun-Earth line. Therefore we know that this cloud is coming straight toward Earth. The clouds that escaped from the Sun over the past few days have cleared the path to Earth, making it easier for this cloud to move through space. As a result, the October 9 plasma cloud is faster than an average solar cloud: an estimated 1900 kilometers per second (that's nearly 7 million kilometers per hour!). An average solar cloud takes several days to travel the distance between the Sun and the Earth. Very fast plasma clouds, like this one from October 9, can race to Earth in less than a day.
When the cloud's magnetic field is orientated opposite to the Earth's magnetic field, the cloud can shake and even break up the magnetic field lines of the Earth. This causes charged particles in the Earth's environment to be launched at high speeds toward the poles, where they collide with atoms in the Earth's atmosphere and create auroras in an oval around the Earth's poles. In this way, auroras result from a geomagnetic storm. Only when the cloud passes the 2 satellites that are right in front of Earth, will we know the orientation of the cloud's magnetic field. Until then, we can only guess.
Aurora is visible in Belgium with the naked eye when we face a magnetic storm of magnitude 9 on a scale between 0 and 9. When this is the case, there is a very good chance that the auroral oval will extend over Belgium. Auroras form at altitudes starting from 100 km and are only visible when it is sufficiently dark and the view is not obstructed by clouds.
Besides auroras, there are also adverse effects associated with a magnetic storm on Earth. Radio communication at the poles becomes difficult or even impossible, and errors can creep into satellite positioning.
Space weather forecast by the STCE
Since the solar flare occurred, the STCE space weather office is on alert. The STCE is closely monitoring the situation and estimating the magnitude of the magnetic storm. According to the forecast team, a magnetic storm of strength 7 to 9 is possible. The STCE has issued a warning with an estimated arrival time of the cloud on Thursday, October 10 in the afternoon (local time). So in case of clear skies, it is definitely worth taking a look at the northern sky during the night of October 10-11. Follow the progress of the space storm on the STCE website: https://www.stce.be/
Newsflash with observations and impacts of the storm - English/Scientific: https://www.stce.be/news/728/welcome.html
Press Release: https://www.stce.be/Strong_solar_eruption_chances_for_aurora_in_Belgium
Space Weather Introductory Course - September edition
Between September 30 and October 3, another 8 brave students were subjected to STCE's onorthodox (but highly effective) space weather trainings.
They have successfully completed the Space Weather Introductory Course and scored very high on their tests the week after. Congratulations!

Review of solar and geomagnetic activity
WEEK 1241 from 2024 Oct 07
Solar Active Regions and flares
Solar flaring activity has been mostly at moderate to high levels throughout the week, with four X-class flares and ten M-class flares recorded. The two strongest events were an X2.1 flare and an X1.8 flare. The first one (SIDC Flare 2245), peaking at 19:13 UTC on October 07, was produced by SIDC Sunspot Group (SG) 257 (NOAA AR 3842). The second one (SIDC Flare 2255), peaking at 01:56 UTC on October 09, was produced by SIDC SG 217 (NOAA AR 3848).
There was a total of thirteen numbered active regions (ARs) on the visible disk, with a few of them developing to a complex magnetic type (beta-delta or beta-gamma-delta). Of particular interest were SIDC Sunspot Groups 257 and 217 (NOAA ARs 3842 and 3848), both producing strong flares. The most complex active region towards the end of the week was SIDC Sunspot Group 281 (NOAA AR 3852).
Coronal mass ejections
A few Coronal Mass Ejections (CMEs) were detected during the week. A partial halo CME has been detected around 20:30 UTC on October 07 in LASCO/C2 and LASCO/C3 coronagraph imagery. It was most likely associated with the X2.1 flare peaking at 19:13 UTC on October 07, produced by SIDC Sunspot Group 257 (NOAA AR 3842). A partial halo CME was detected in LASCO/C2 and LASCO/C3 coronagraph imagery around 01:20 UTC on October 13, probably associated with eruptive activity beyond the west limb.
The most important event was a halo CME, observed in LASCO/C2 coronagraph imagery around 02:30 UTC on October 09. It was most likely related to the X1.8 flare peaking at 01:56 UTC on October 09 and a large filament eruption west of SIDC Sunspot Group 217 (NOAA AR 3848). Analysis of the event suggested a velocity of around 1900 km/s. An associated type IV radio emission was detected, starting at 01:43 UTC on October 09.
Coronal Holes
Two coronal holes have crossed the central meridian during the last week. The first was a northern, mid-latitude, negative polarity coronal hole. The second was a southern, mid-latitude, positive polarity coronal hole. Both have fully crossed the central meridian on October 11.
Proton flux levels
The greater than 10 MeV proton flux was below the 10 pfu threshold at the beginning of the week but it was then enhanced on October 08. Moderate solar radiation storm conditions (S2), with brief major storm conditions (S3) were recorded between 05:00 UTC on October 10 and 06:00 UTC on October 11, following the X1.8 flare and the halo coronal mass ejection (CME) on October 09. The greater than 10 MeV proton flux has since decreased to background levels, with enhanced values still observed until October 13.
Electron fluxes at GEO
The greater than 2 MeV electron flux as measured by GOES 16 and GOES 18 was enhanced at the beginning of the week (October 07-08) but remained below the 1000 pfu threshold. The 2MeV electron flux as measured by GOES 18 briefly reached the threshold around 21:00 UTC on October 09. It then decreased but remained enhanced (both for GOES 16 and GOES 18) for the rest of the week.
The 24-hour electron fluence was at nominal levels throughout the week.
Solar wind
The solar wind conditions were enhanced at the beginning of the week, following the arrival of an Interplanetary Coronal Mass Ejection (ICME) that was reported on October 06. Speed values reached 540 km/s. The interplanetary magnetic field reached a maximum of 17 nT. The Bz component varied between -11 nT and 16 nT. The interplanetary magnetic field angle varied between the positive and negative sector. The solar wind conditions were enhanced for the next two days, returning to the slow wind regime late on October 09.
A shock was detected in the solar wind data (from ACE and DSCOVR) at 14:45 UTC on October 10, due to the arrival of an ICME, related to the halo CME observed at 02:30 UTC on October 09. The interplanetary magnetic field jumped from 9 nT to 25 nT, with the Bz component changing from 6 nT to -25 nT. The solar wind speed jumped from 460 km/s to around 790 km/s. The solar wind density at the shock jumped from 9 ppcc to around 25 ppcc (data from DSCOVER). The maximum magnetic field value was around 46 nT (at 22:00 UTC on October 10), with the Bz component reaching values of around -46 nT at the same time. The interplanetary magnetic field angle changed from positive to negative at 22:00 UTC on October 10.
The solar wind conditions were enhanced until October 13, when they started to return again to the slow wind regime.
Geomagnetism
Geomagnetic conditions globally and locally were at minor storm levels (NOAA Kp 5+, K BEL 5) at the beginning of the week, as a consequence of the Interplanetary Coronal Mass Ejection (ICME) arrival that was reported on October 06. On October 08, geomagnetic conditions globally reached major storm levels (NOAA Kp 7- to 7+). A gradual decrease to active and then unsettled levels followed.
On October 10, geomagnetic conditions globally escalated to severe storm levels (reaching Kp 9-) and major storm levels locally (K BEL 7). This geomagnetic storm was due to the ICME arrival from the CME that lifted off at 02:30 on October 09.
Towards the end of the week, the geomagnetic conditions globally and locally receded to active and quiet levels.
International Sunspot Number by SILSO
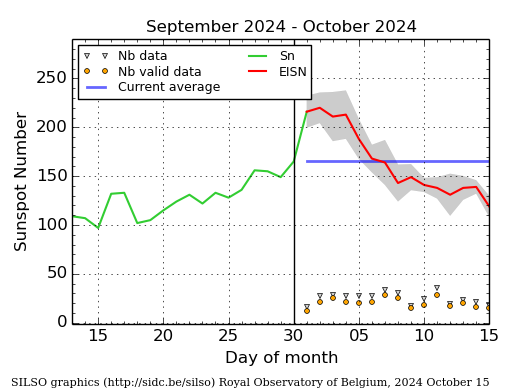
The daily Estimated International Sunspot Number (EISN, red curve with shaded error) derived by a simplified method from real-time data from the worldwide SILSO network. It extends the official Sunspot Number from the full processing of the preceding month (green line), a few days more than one solar rotation. The horizontal blue line shows the current monthly average. The yellow dots give the number of stations that provided valid data. Valid data are used to calculate the EISN. The triangle gives the number of stations providing data. When a triangle and a yellow dot coincide, it means that all the data is used to calculate the EISN of that day.
PROBA2 Observations
Solar Activity
Solar flare activity fluctuated from low to very high during the week.
In order to view the activity of this week in more detail, we suggest to go to the following website from which all the daily (normal and difference) movies can be accessed: https://proba2.oma.be/ssa
This page also lists the recorded flaring events.
A weekly overview movie can be found here (SWAP week 759): https://proba2.sidc.be/swap/data/mpg/movies/weekly_movies/weekly_movie_2024_10_07.mp4
Details about some of this week's events can be found further below.
If any of the linked movies are unavailable they can be found in the P2SC movie repository here: https://proba2.sidc.be/swap/data/mpg/movies/
Monday Oct 07
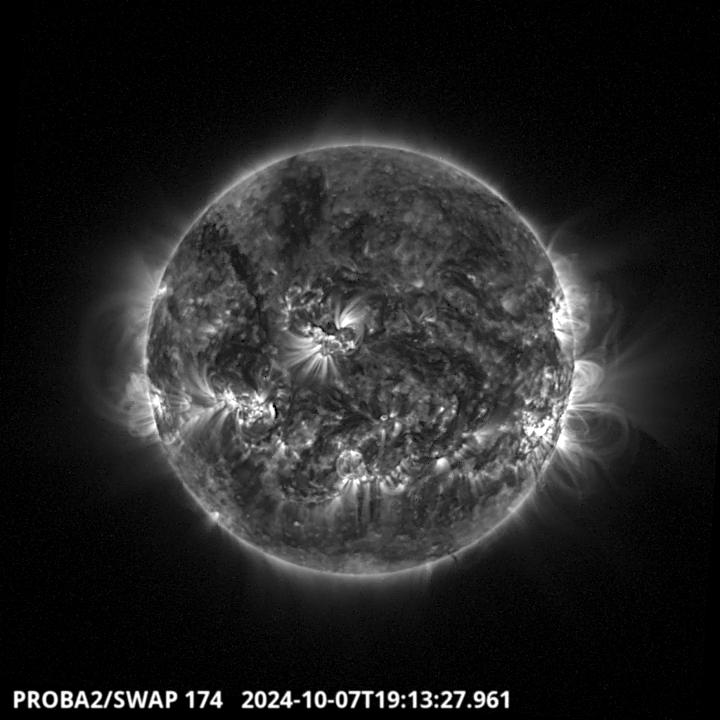
The largest flare of the week is a X2.1. It originated from the NOAA active region 3842 located on the South West part of the solar disk; this flare peaked around 19:13 UT. Find a SWAP movie of the event here: https://proba2.sidc.be/swap/movies/20241007_swap_movie.mp4
Monday Oct 08
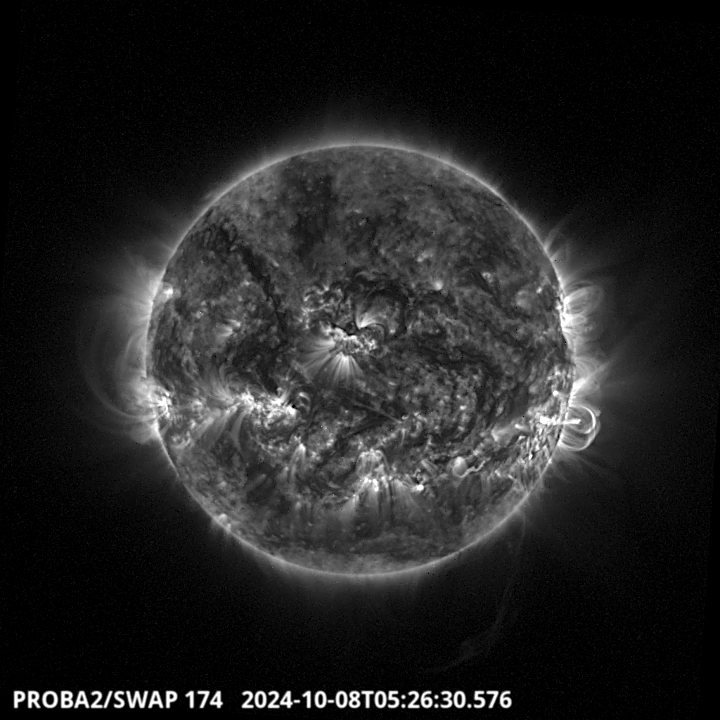
A filament eruption occurs around 05:26 UT in the South-West part of the solar disk. This eruption
produced a CME. Find a SWAP movie of the event here: https://proba2.sidc.be/swap/movies/20241008_swap_movie.mp4
Noticeable Solar Events
| DAY | BEGIN | MAX | END | LOC | XRAY | OP | 10CM | TYPE | Cat | NOAA |
| 07 | 1803 | 1838 | 1902 | S20W64 | M1.3 | SF | 31 | 3842 | ||
| 07 | 1902 | 1913 | 1931 | S19W63 | X2.1 | 2B | II/2IV/1 | 31 | 3842 | |
| 08 | 0843 | 0851 | 0857 | S12W65 | M1.2 | SF | 31 | 3842 | ||
| 07 | 2003 | 2059 | 2127 | X1.0 | III/2 | |||||
| 09 | 0125 | 0156 | 0243 | X1.8 | III/2IV/2II/3 | 36 | 3848 | |||
| 09 | 0541 | 0546 | 0602 | M1.6 | VI/2 | 40 | 3849 | |||
| 09 | 1544 | 1547 | 1553 | S12W87 | X1.4 | 1N | III/3IV/1 | 31 | 3842 | |
| 09 | 2259 | 2312 | 2321 | M7.7 | VI/2 | 31 | 3842 | |||
| 10 | 1147 | 1201 | 1210 | M1.3 | III/2 | |||||
| 10 | 1210 | 1219 | 1223 | M1.1 | III/2 | 3842 | ||||
| 10 | 1651 | 1700 | 1712 | M1.0 | III/2 | 3842 | ||||
| 10 | 2154 | 2230 | 2310 | S24W40 | M3.0 | SF | III/1 | 3842 | ||
| 11 | 1548 | 1604 | 1607 | S9E23 | M1.4 | SF | VI/1CTM/1 | 45 | 3854 | |
| 11 | 1607 | 1633 | 1646 | S9E23 | M2.1 | SF | VI/1 | 45 | 3854 |
| LOC: approximate heliographic location | TYPE: radio burst type |
| XRAY: X-ray flare class | Cat: Catania sunspot group number |
| OP: optical flare class | NOAA: NOAA active region number |
| 10CM: peak 10 cm radio flux |
Geomagnetic Observations in Belgium
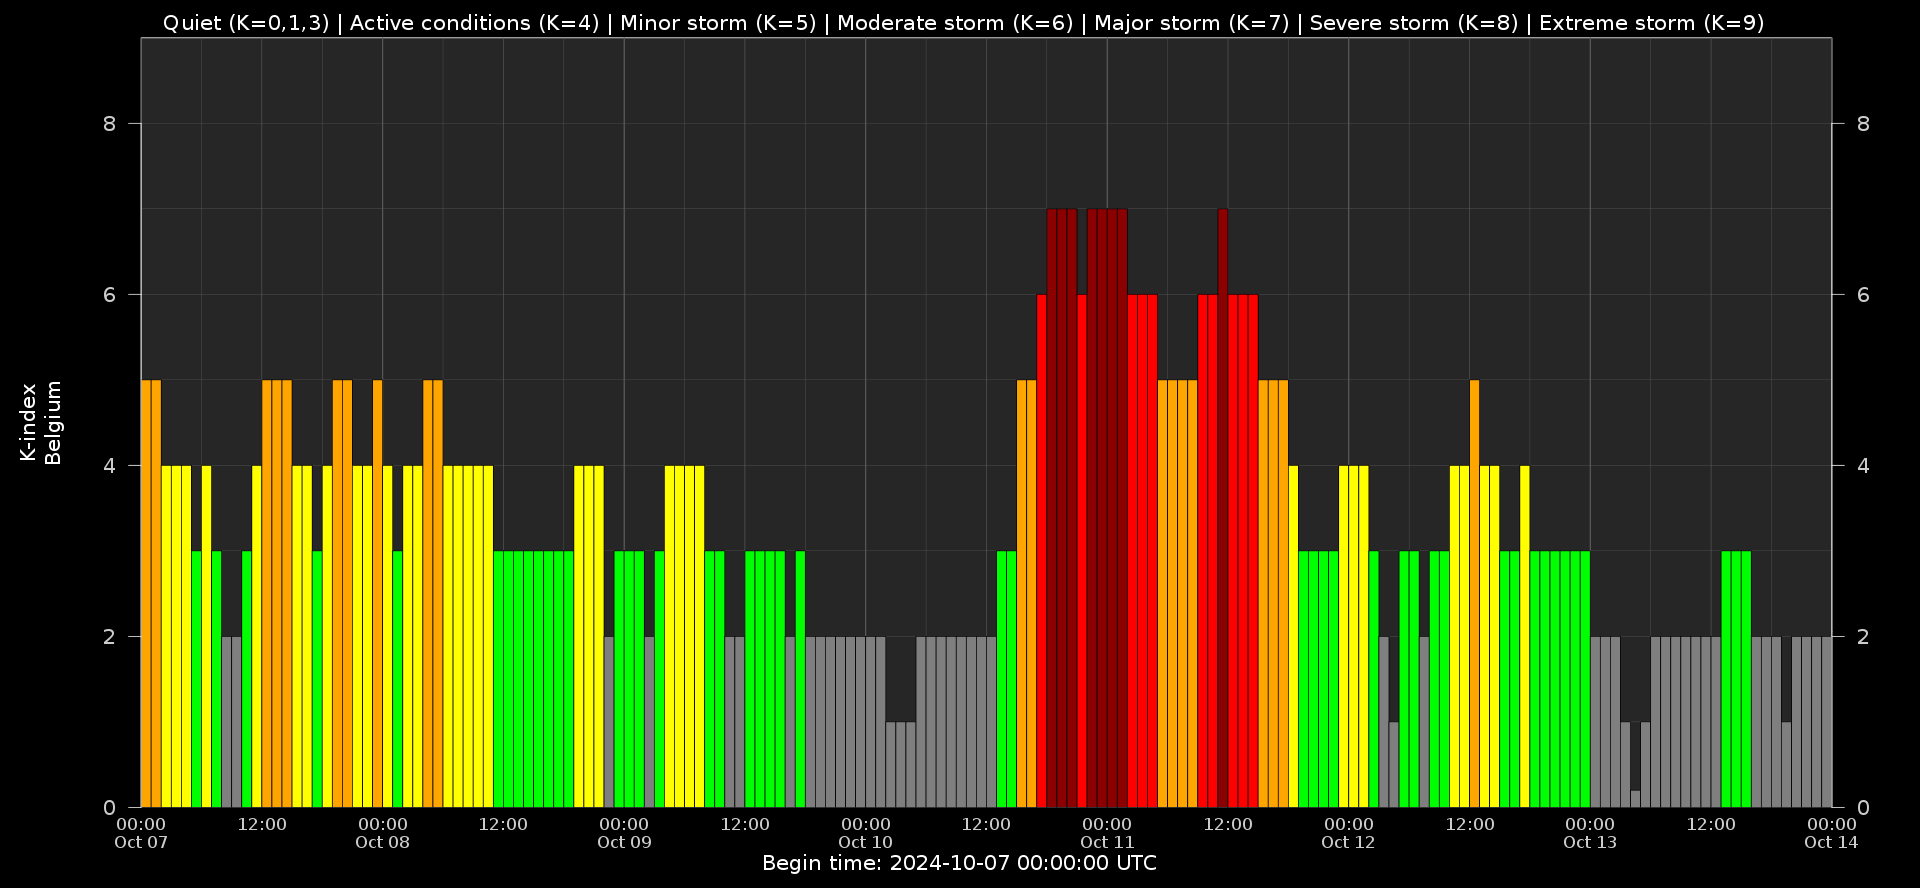
Local K-type magnetic activity index for Belgium based on data from Dourbes (DOU) and Manhay (MAB). Comparing the data from both measurement stations allows to reliably remove outliers from the magnetic data. At the same time the operational service availability is improved: whenever data from one observatory is not available, the single-station index obtained from the other can be used as a fallback system.
Both the two-station index and the single station indices are available here: http://ionosphere.meteo.be/geomagnetism/K_BEL/
Review of Ionospheric Activity
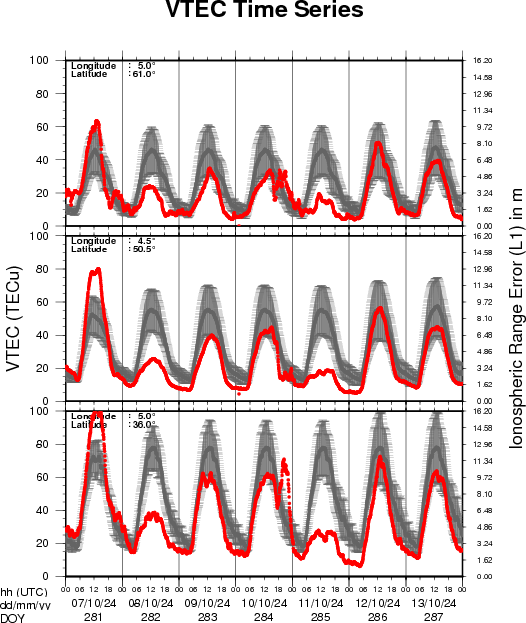
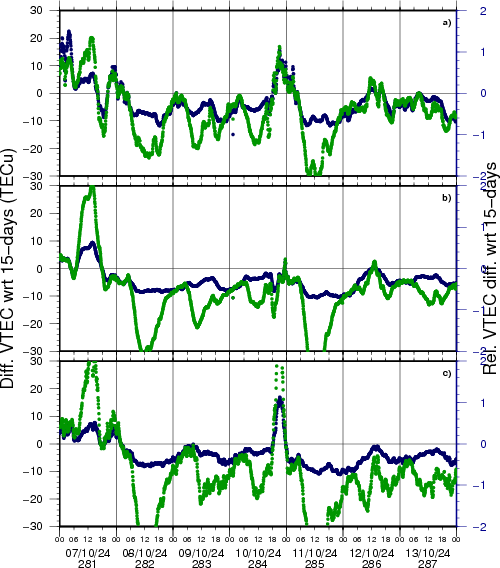
VTEC time series at 3 locations in Europe from 7 Oct 2024 till 13 Oct 2024
The top figure shows the time evolution of the Vertical Total Electron Content (VTEC) (in red) during the last week at three locations:
a) in the northern part of Europe(N 61deg E 5deg)
b) above Brussels(N 50.5deg, E 4.5 deg)
c) in the southern part of Europe(N 36 deg, E 5deg)
This top figure also shows (in grey) the normal ionospheric behaviour expected based on the median VTEC from the 15 previous days.
The time series below shows the VTEC difference (in green) and relative difference (in blue) with respect to the median of the last 15 days in the North, Mid (above Brussels) and South of Europe. It thus illustrates the VTEC deviation from normal quiet behaviour.
The VTEC is expressed in TECu (with TECu=10^16 electrons per square meter) and is directly related to the signal propagation delay due to the ionosphere (in figure: delay on GPS L1 frequency).
The Sun's radiation ionizes the Earth's upper atmosphere, the ionosphere, located from about 60km to 1000km above the Earth's surface.The ionization process in the ionosphere produces ions and free electrons. These electrons perturb the propagation of the GNSS (Global Navigation Satellite System) signals by inducing a so-called ionospheric delay.
See http://stce.be/newsletter/GNSS_final.pdf for some more explanations; for more information, see https://gnss.be/SpaceWeather
The SIDC Space Weather Briefing
The forecaster on duty presented the SIDC briefing that gives an overview of space weather from 7 to 13 October.
The pdf of the presentation can be found here: https://www.stce.be/briefings/20241014_SWbriefing.pdf

Upcoming Activities
Courses, seminars and presentations with the Sun-Space-Earth system and Space Weather as the main theme. We provide occasions to get submerged in our world through educational, informative and instructive activities.
* Oct 21 - 22, Second e-SWAN school - data, models and observations relevant to Space Weather and the Ionosphere, by the STCE - Registrations are open, https://events.spacepole.be/event/209/
* Dec 5-6, STCE Course Space Weather impacts on aviation, Brussels, Belgium - Registrations are open, https://events.spacepole.be/event/205/
To register for a course and check the seminar details, surf to the STCE Space Weather Education Center: https://www.stce.be/SWEC
If you want your event in the STCE newsletter, contact us: stce_coordination at stce.be