- Table of Content
- 1.Comparing 2 so...
- 2.e-SWAN school ...
- 3.Review of spac...
- 4.PROBA2 Observa...
- 5.International ...
- 6.Noticeable Sol...
- 7.Geomagnetic Ob...
- 8.The SIDC space...
- 9.Review of Iono...
- 10.STCE Space Wea...
2. e-SWAN school by the STCE
3. Review of space weather
4. PROBA2 Observations (21 Oct 2024 - 27 Oct 2024)
5. International Sunspot Number by SILSO
6. Noticeable Solar Events
7. Geomagnetic Observations in Belgium
8. The SIDC space weather briefing
9. Review of Ionospheric Activity
10. STCE Space Weather Education Center
Comparing 2 solar storms
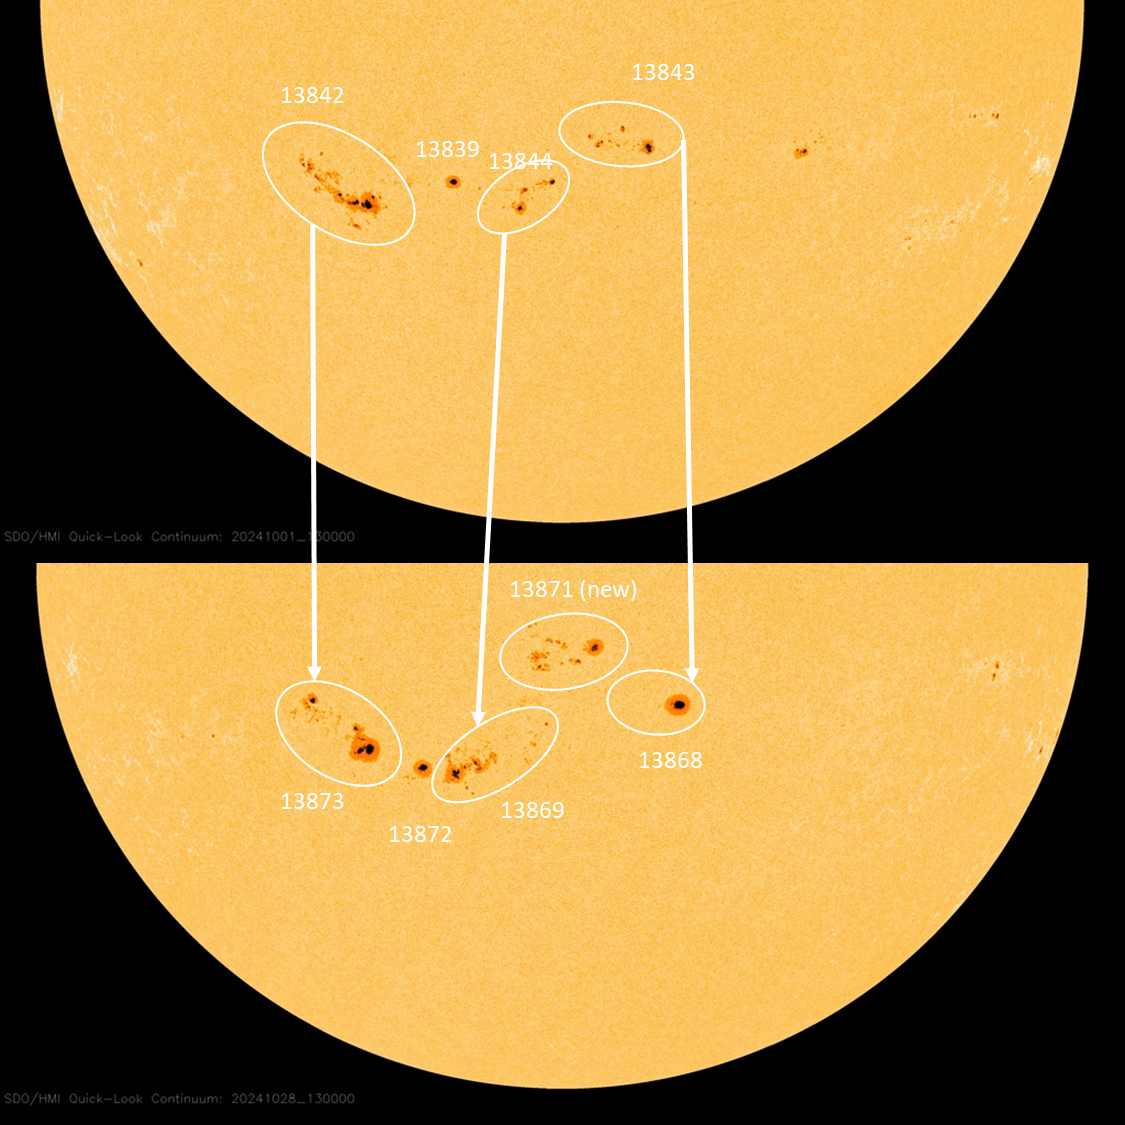
The Sun produced an X-class flare on both 24 and 26 October, events that were discussed in the STCE newsflashes at https://www.stce.be/news/731/welcome.html and at https://www.stce.be/news/732/welcome.html . The first X-class flare, an X3.3 event, was produced by NOAA 13869. The X1.8 flare from 26 October was produced by NOAA 13873. These sunspot regions were part of a string of sunspot groups visible in the southeast solar quadrant. They are in the same location on the Sun as another series of sunspot groups just a solar rotation ago. The latter were the source of some of the strongest solar flares so far this solar cycle (STCE newsitem at https://www.stce.be/news/727/welcome.html ). Underneath is an annotated white light image of the solar disk on 1 October (upper image) and on 28 October (lower image). The numbers refer to the NOAA active regions, the arrows link the old with the returning and/or new sunspot regions. Only for the returning groups NOAA 13872/13869, it is not so clear how much is the remainder of the old sunspot duo NOAA 13839/13844, and how much is from newly emerged sunspots. Different group splittings are possible.
Both X-class flares were associated with Type II and Type IV radio emission (see the STCE SWX classification page at https://www.stce.be/educational/classification#radio ), as well as mild radio bursts at all observed frequencies. In both cases, also a Tenflare was observed, i.e. more than a doubling of the solar radio flux at 2800 MHz (at a wavelength of 10.7 cm) above the pre-event background. Values recorded were resp. 5900 sfu and 4200 sfu. The greater than 10 MeV proton flux became mildly enhanced following the X3.3 flare, but finally crossed the alert threshold on 26 October at 19:10UTC, driven by the X1.8 flare. This can be seen in the annotated images underneath of the GOES x-ray flux (top) and GOES proton flux (bottom). The proton event reached a maximum of 364 pfu on 28 October, but was still above the 100 pfu level at the time of this writing. At this level ("S2" on the NOAA scales - https://www.swpc.noaa.gov/noaa-scales-explanation ), satellites may have experienced an occasional single event upset (SEU , a glitch in the software operations), and High Frequency communications (HF Com ; 3-30 MHz) may have been somewhat disturbed over the polar regions.


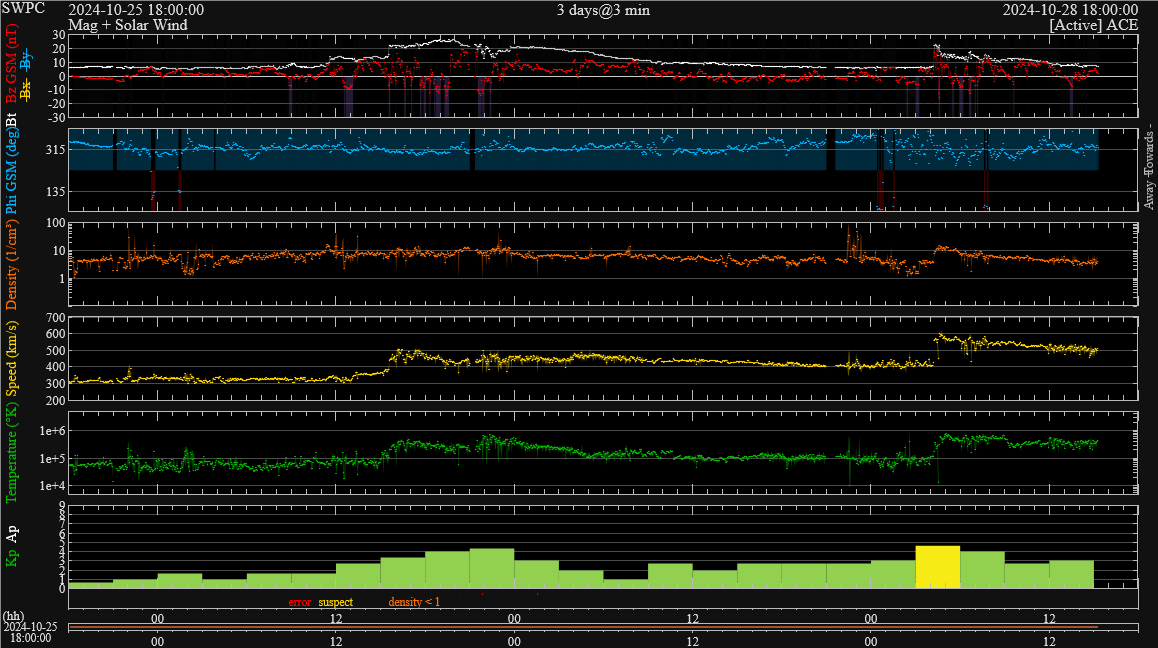
Both eruptions were associated with a asymmetric halo coronal mass ejection (CME ; see the SOHO/LASCO C3 coronagraphic imagery above), due to the close proximity of the source regions near the southeast solar limb. The CMEs had a speed of resp. about 1300 km/s and 1600 km/s. In both cases, the bulk of the CME was directed away from Earth, but both delivered a glancing blow to the earth environment. Travel time for these interplanetary CMEs was resp. about 59 hours and 45 hours. Shock-like structures were observed in the solar wind as recorded by DSCOVR on 26 and 28 October, with maximum speeds observed of resp. about 500 and 600 km/s (yellow curve in graphs underneath). The arrival of the first ICME on 26 October resulted in a modest spike in the greater than 10 MeV proton flux around 16:30UTC, remaining just below the 10 pfu alert threshold (see annotated graph above). This is called an Energetic Storm Particle (ESP) event, which is a type of solar energetic particle (SEP) events characterized by the usually rapid increase (at least 20% above background) in the greater than 10 MeV proton flux associated with a shock driven by a CME (Ameri et al. 2023 https://doi.org/10.1016/j.asr.2022.12.014 ). Such an ESP signature was much less obvious from the ICME that arrived early on 28 October, with maybe a hint around 04:45UTC. The resulting geomagnetic disturbance from these ICMEs was all-in-all mild, as could be expected from a glancing blow. The global Kp index reached resp. active and minor storming conditions, whereas the K_BEL was at resp. active and unsettled conditions. The passage of both structures left no obvious fingerprint in the evolution of the Dst index (Disturbance storm time index - https://www.stce.be/educational/classification#geomag ), which remained at quiet levels (Dst > -30 nT).
e-SWAN school by the STCE
The STCE explored new ways for online courses at the second e-SWAN on Data, models and observations relevant to Space Weather and the Ionosphere, prior to the European Space Weather Week.
We explored satellite data, sunspots data, solar wind models, magnetosphere observations, radio spectrograms, ionograms, polar cap absorption, ... by means of white board exercises, yes/no quizes, drag and drop tools, polls.
The course passed at high speed trying to not to loose the participants attention: https://events.spacepole.be/event/209/
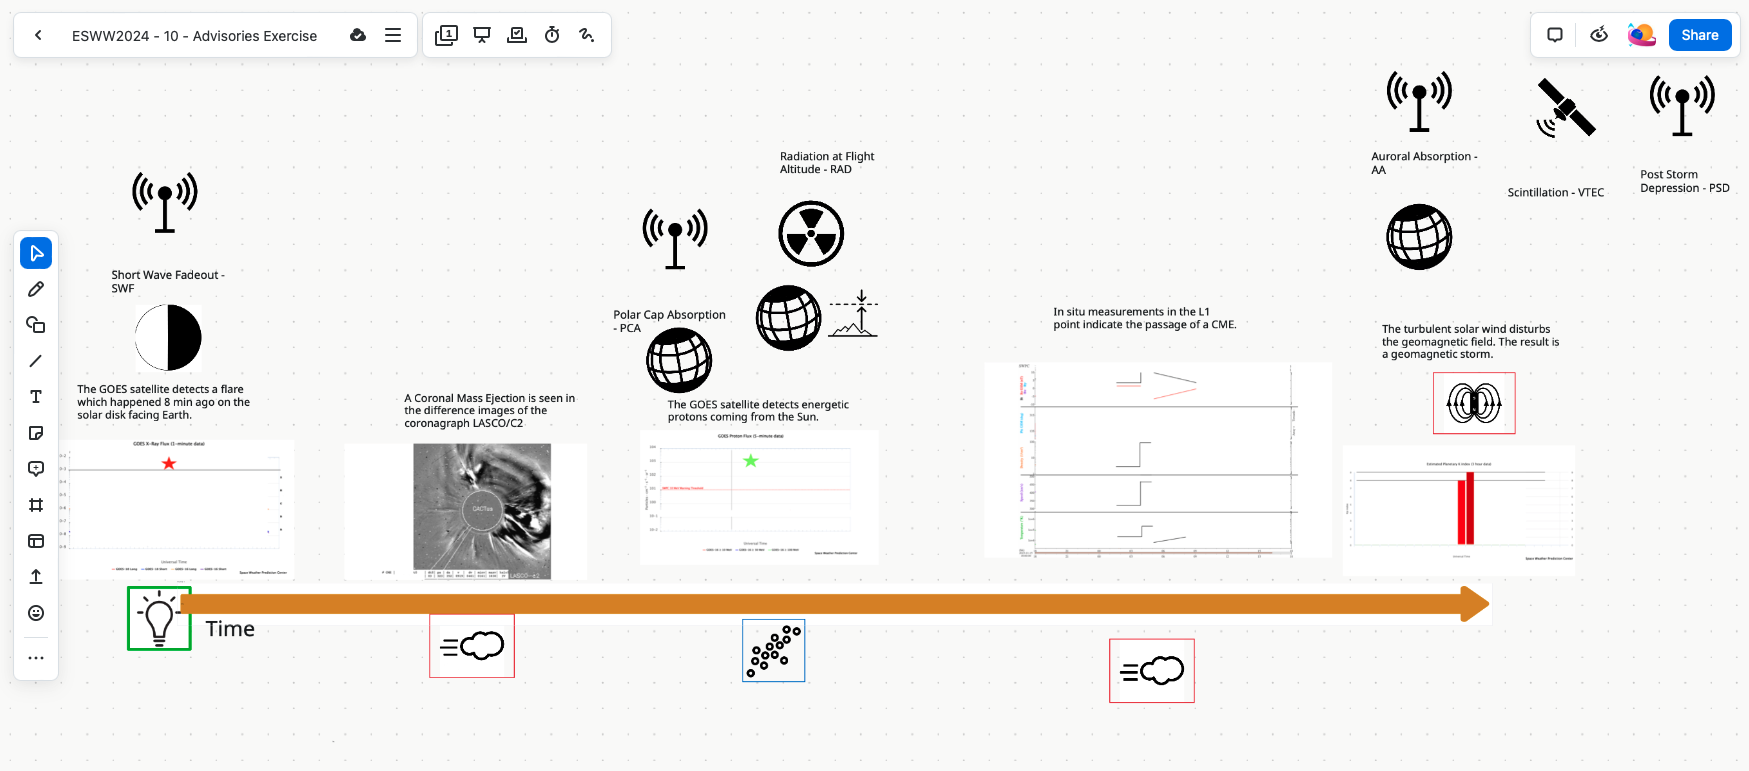
The building of a time line of advisories for civil aviation and the currents in the magnetosphere went nicely together:

Review of space weather
Solar Active Regions (ARs) and flares
Solar flaring activity was low at the start of the week. Activity reached high levels on October 24 and 26 and remained moderate for the rest of the week. There were 22 active regions visible throughout the week. A total of 34 C-class flares, 7 M-class flares and 2 X-class flares were recorded. Most of the flares were produced by NOAA ARs 3869, 3872, 3873 and 3878.
The largest flare was an X3.3, with peak time 03:57 UTC on October 24, associated with NOAA AR 3869. Type II and Type IV radio emission were detected at 03:46 UTC on Oct 24 during the flaring activity.
The second largest flare was an X1.8 flare, peaking at 07:19 UTC on October 26, produced by NOAA Active Region 3873. This event was also associated with a Type II and Type IV radio burst, detected at 06:29 UTC on October 26.
Coronal mass ejections
Two fast halo CMEs were observed over the week.
The first CME was observed in SOHO/LASCO-C2 coronagraph data starting at around 03:48 UTC on October 24, associated with the X3.3 flare. This CME, primarily directed to the southeast from Earth's perspective, had an estimated speed exceeding 1300 km/s. While the bulk of the ejecta was expected to miss Earth, a glancing blow was expected on October 26. A shock associated with this CME was indeed detected in the solar wind at around 15:35 UTC on October 26.
The second fast halo CME was recorded at 06:48 UTC on October 26, associated with the X1.8 flare. This CME also primarily directed to the southeast from Earth's perspective with an estimated speed of approximately 1500 km/s. Analysis indicated that most of this CME's ejecta would miss Earth, although a potential glancing blow was expected by October 28. This was confirmed when a shock was detected in the solar wind at around 04:17 UTC on October 28.
Coronal Holes
Two coronal holes crossed the central meridian during the past week. The first, a small equatorial negative polarity coronal hole, fully crossed the central meridian on October 24. The second was a small, negative polarity, low-latitude coronal hole that crossed the central meridian on October 25.
Proton flux levels
The greater than 10 MeV proton flux, as recorded by GOES-18, exceeded the 10 pfu threshold on October 26 at 19:10 UTC and continued rising, crossing the 100 pfu threshold at 09:15 UTC on October 27. This gradual increase began on October 24 at 04:15 UTC. Two halo coronal mass ejections (CMEs), along with strong flaring activity from NOAA AR 3869 and 3873, were likely associated with this particle event.
Electron fluxes at GEO
The greater than 2 MeV electron flux, as measured by GOES 16 and GOES 18, was below the 1000 pfu threshold during the last week. The electron fluence was at normal levels throughout the entire week.
Solar wind
The solar wind was slow at the beginning of the week. The solar wind became slightly disturbed on October 22, likely due to the mild influence of a high-speed stream (HSS) from a positive polarity coronal hole that started to cross the central meridian on October 18. The interplanetary magnetic field (IMF) reached values up to 12 nT, and the solar wind speed increased from around 300 km/s to 430 km/s. The ICME which arrived on October 26 possibly mixed with a mild HSS from a small negative polarity coronal hole. A shock was detected in the solar wind around 15:35 UTC on October 26, with the IMF jumping from 14 nT to 22 nT and the solar wind speed rising from 370 km/s to 440 km/s. Following the arrival of the ICME, the IMF reached values up to 26 nT, and the southward component of the IMF fluctuated between -18 nT and 19 nT.
Geomagnetism
Geomagnetic conditions over the past week were quiet to unsettled. Active conditions were recorded locally over Belgium (K-BEL: 4) between 15:00-18:00 UTC and 21:00-00:00 UTC on October 22, as well as globally (NOAA Kp: 4- to 4+) between 03:00 and 09:00 UTC on October 24, influenced by a high-speed stream (HSS). The arrival of an ICME led to further active levels reached both globally (NOAA Kp: 4 to 4+) and locally over Belgium (K-BEL: 4) between 18:00 and 00:00 UTC on October 26.
PROBA2 Observations (21 Oct 2024 - 27 Oct 2024)
Solar Activity
Solar flare activity fluctuated from low to high during the week.
In order to view the activity of this week in more detail, we suggest to go to the following website from which all the daily (normal and difference) movies can be accessed: https://proba2.oma.be/ssa
This page also lists the recorded flaring events.
A weekly overview movie can be found here (SWAP week 761). https://proba2.sidc.be/swap/data/mpg/movies/weekly_movies/weekly_movie_2024_10_21.mp4
Details about some of this week's events can be found further below.
If any of the linked movies are unavailable they can be found in the P2SC movie repository here https://proba2.sidc.be/swap/data/mpg/movies/.
Thursday Oct 24
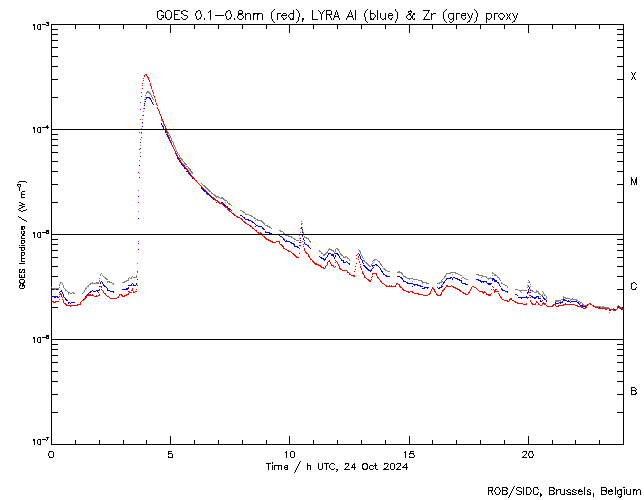
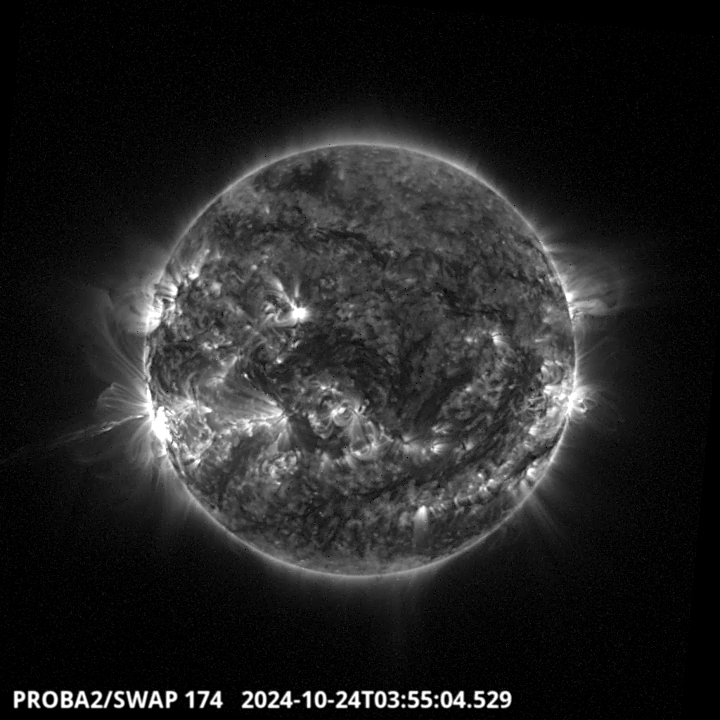
The largest flare of the week is a X3.3 visible on the LYRA and SWAP image above. It was
produced by the 3860 NOAA active region located on the South East limb of the solar disk.
Find a SWAP movie of the event here. https://proba2.sidc.be/swap/movies/20241024_swap_movie.mp4
Saturday Oct 26
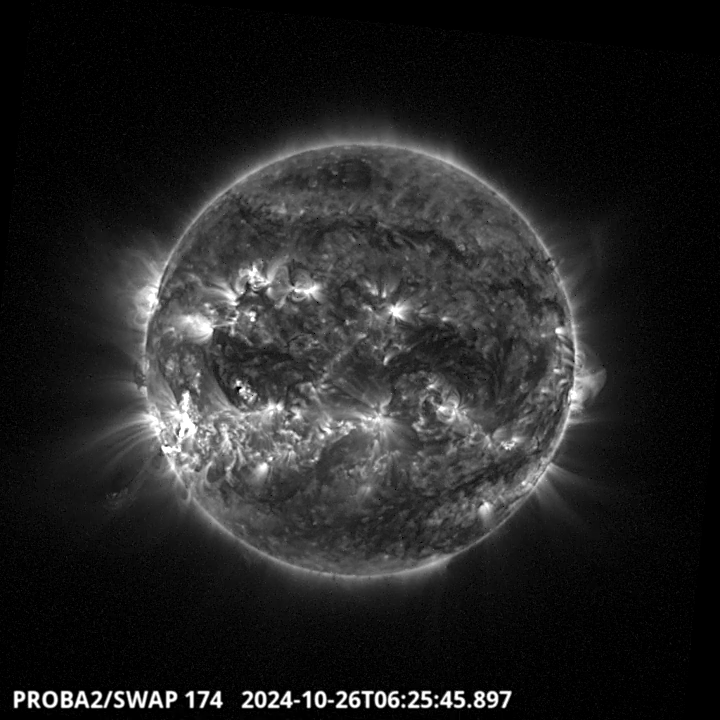
A M9.5 flare erupted around 6:23 UT, it originated from the active region NOAA 3873. It was followed
by another flare, a X1.8 peaking at 7:19 and issued from the same active region located on the South
East part of the solar disk. Find a SWAP movie of the event here. https://proba2.sidc.be/swap/movies/20241026_swap_movie.mp4
International Sunspot Number by SILSO
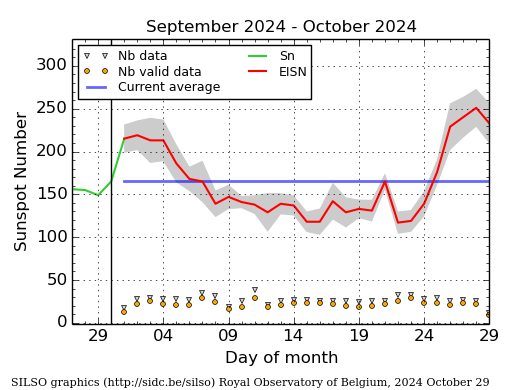
The daily Estimated International Sunspot Number (EISN, red curve with shaded error) derived by a simplified method from real-time data from the worldwide SILSO network. It extends the official Sunspot Number from the full processing of the preceding month (green line), a few days more than one solar rotation. The horizontal blue line shows the current monthly average. The yellow dots give the number of stations that provided valid data. Valid data are used to calculate the EISN. The triangle gives the number of stations providing data. When a triangle and a yellow dot coincide, it means that all the data is used to calculate the EISN of that day.
Noticeable Solar Events
| DAY | BEGIN | MAX | END | LOC | XRAY | OP | 10CM | TYPE | Cat | NOAA |
| 24 | 0330 | 0357 | 0428 | S5E86 | X3.3 | SF | VI/3III/2II/1IV/2 | 67 | 3869 | |
| 24 | 1022 | 1029 | 1034 | S15E87 | M1.2 | SF | 67 | 3869 | ||
| 25 | 0723 | 0733 | 0738 | S10E75 | M1.1 | SF | III/3V/3 | 3873 | ||
| 26 | 0557 | 0623 | 0632 | S11E56 | M9.5 | 3 | II/2IV/3 | 3873 | ||
| 26 | 1136 | 1150 | 1157 | M2.2 | ||||||
| 26 | 1158 | 1206 | 1213 | M2.8 | ||||||
| 26 | 1404 | 1416 | 1430 | S10E50 | M1.6 | S | VI/2 | |||
| 26 | 0632 | 0719 | 0756 | S17E64 | X1.8 | 2 | II/2IV/3 | 3873 | ||
| 27 | 2305 | 2324 | 2344 | M2.8 | VI/2III/1 | 3878 |
| LOC: approximate heliographic location | TYPE: radio burst type |
| XRAY: X-ray flare class | Cat: Catania sunspot group number |
| OP: optical flare class | NOAA: NOAA active region number |
| 10CM: peak 10 cm radio flux |
Geomagnetic Observations in Belgium
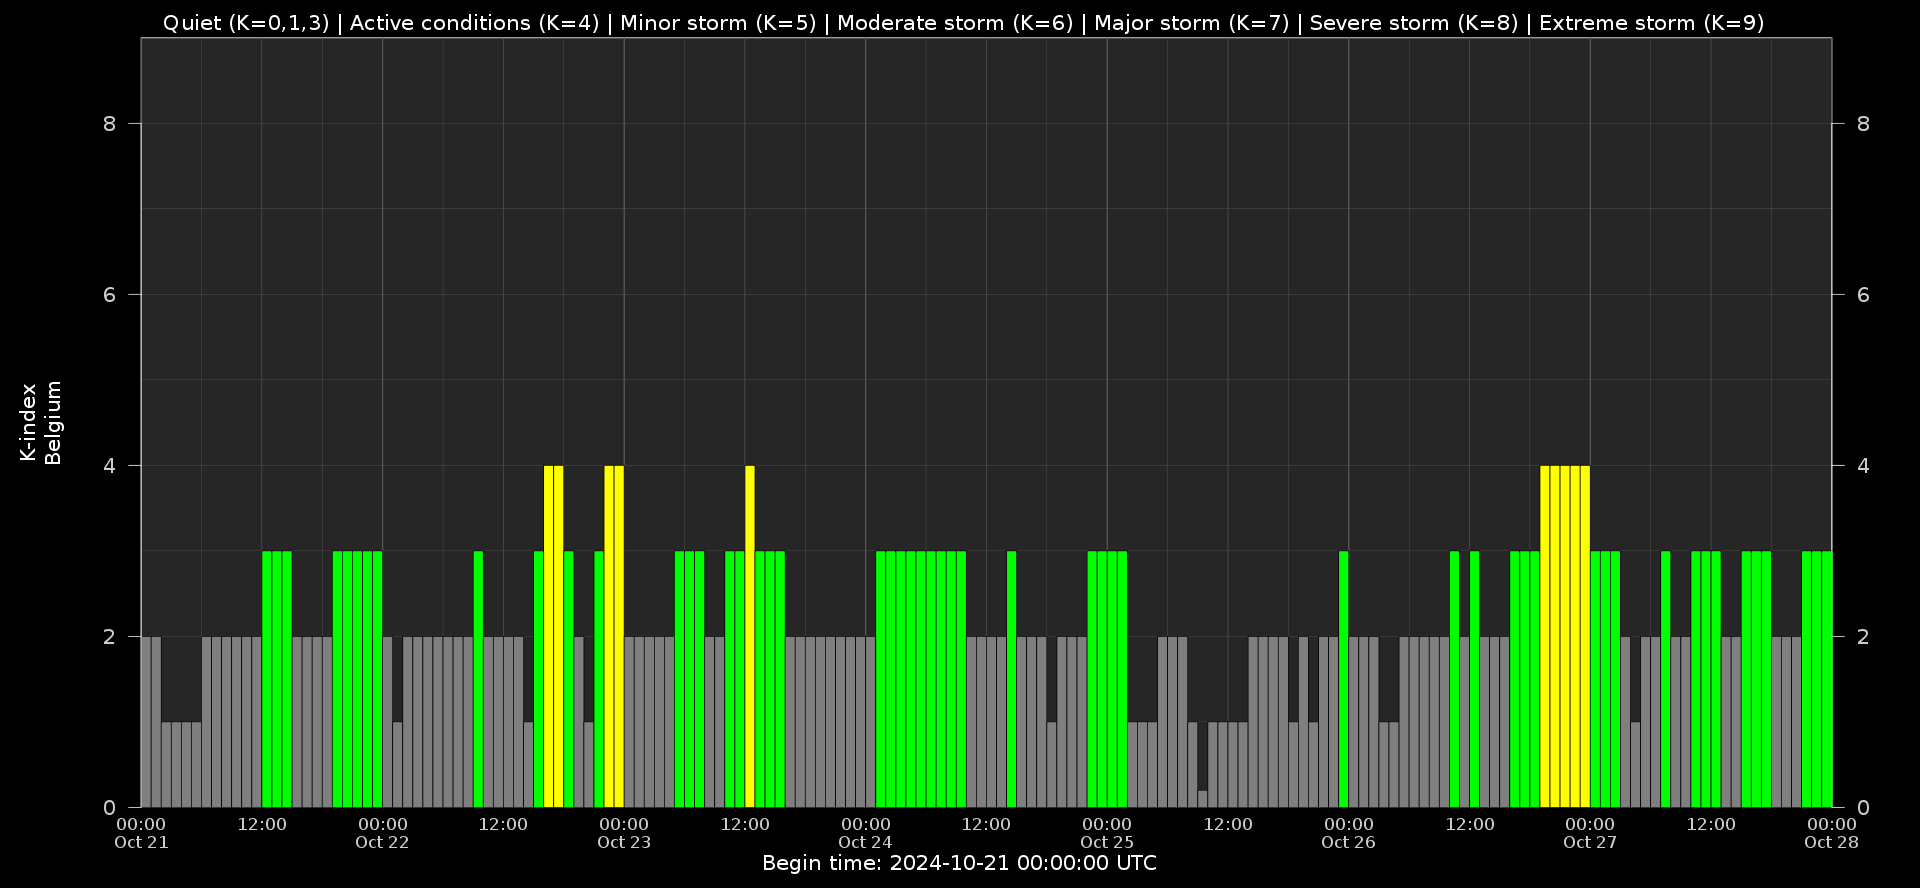
Local K-type magnetic activity index for Belgium based on data from Dourbes (DOU) and Manhay (MAB). Comparing the data from both measurement stations allows to reliably remove outliers from the magnetic data. At the same time the operational service availability is improved: whenever data from one observatory is not available, the single-station index obtained from the other can be used as a fallback system.
Both the two-station index and the single station indices are available here: http://ionosphere.meteo.be/geomagnetism/K_BEL/
The SIDC space weather briefing
The Space Weather Briefing presented by the forecaster on duty from Oct 20 to 27.
The pdf of the presentation can be found here: https://www.stce.be/briefings/20241028_SWbriefing.pdf
Review of Ionospheric Activity
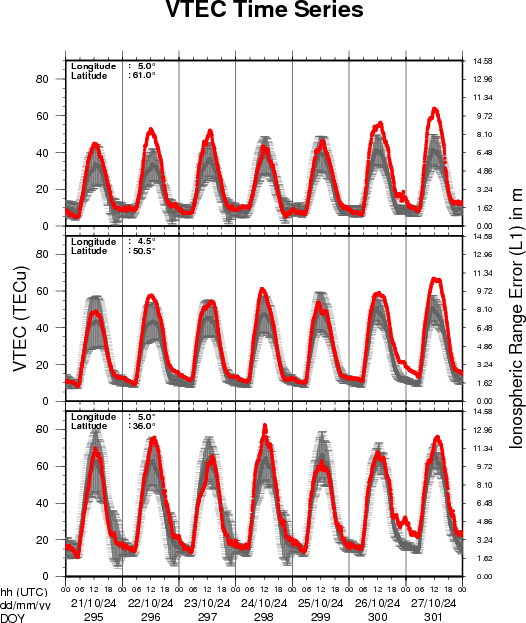
VTEC time series at 3 locations in Europe from 21 Oct 2024 till 27 Oct 2024
The top figure shows the time evolution of the Vertical Total Electron Content (VTEC) (in red) during the last week at three locations:
a) in the northern part of Europe(N 61deg E 5deg)
b) above Brussels(N 50.5deg, E 4.5 deg)
c) in the southern part of Europe(N 36 deg, E 5deg)
This top figure also shows (in grey) the normal ionospheric behaviour expected based on the median VTEC from the 15 previous days.
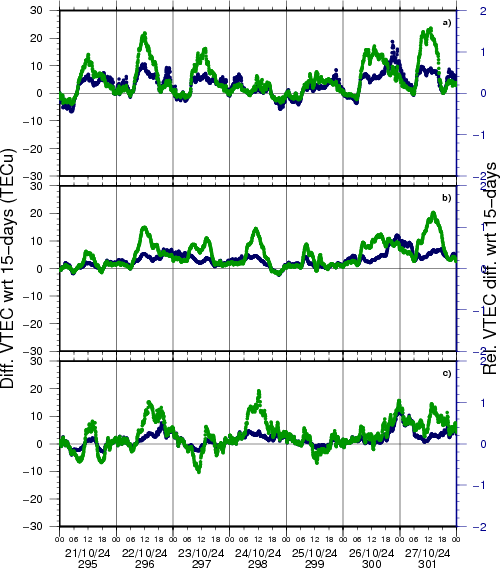
The time series below shows the VTEC difference (in green) and relative difference (in blue) with respect to the median of the last 15 days in the North, Mid (above Brussels) and South of Europe. It thus illustrates the VTEC deviation from normal quiet behaviour.
The VTEC is expressed in TECu (with TECu=10^16 electrons per square meter) and is directly related to the signal propagation delay due to the ionosphere (in figure: delay on GPS L1 frequency).
The Sun's radiation ionizes the Earth's upper atmosphere, the ionosphere, located from about 60km to 1000km above the Earth's surface.The ionization process in the ionosphere produces ions and free electrons. These electrons perturb the propagation of the GNSS (Global Navigation Satellite System) signals by inducing a so-called ionospheric delay.
See http://stce.be/newsletter/GNSS_final.pdf for some more explanations; for more information, see https://gnss.be/SpaceWeather
STCE Space Weather Education Center
Courses, seminars and presentations with the Sun-Space-Earth system and Space Weather as the main theme. We provide occasions to get submerged in our world through educational, informative and instructive activities.
* Nov 4-8, European Space Weather Week, Coimbra, Portugal, https://esww2024.org/
* Dec 5-6, STCE Course Space Weather impacts on aviation, Brussels, Belgium - Registrations are open, https://events.spacepole.be/event/205/
* Jan 28-30, Role of the ionosphere and space weather in military communications, Brussels, Belgium - Registrations are open, https://events.spacepole.be/event/208/
* Mar 17-18, 2025, Inleiding tot het ruimteweer, enkel voor leden van volkssterrenwachten, Brussels, Belgium - registrations are open, https://events.spacepole.be/event/213/
* Mar 24, 2025, STCE Lecture From Physics to Forecasting, ESA Academy's Space Weather Training Course
To register for a course and check the seminar details, surf to the STCE Space Weather Education Center: https://www.stce.be/SWEC
If you want your event in the STCE newsletter, contact us: stce_coordination at stce.be
