- Table of Content
- 1.Proba-3 - Prep...
- 2.ESWW2025 Banne...
- 3.Power grids du...
- 4.Review of sola...
- 5.International ...
- 6.Noticeable Sol...
- 7.Geomagnetic Ob...
- 8.Review of Iono...
- 9.The SIDC Space...
- 10.Upcoming Activ...
2. ESWW2025 Banner and poster competition OPEN
3. Power grids during the 10-11 May storm
4. Review of solar and geomagnetic activity
5. International Sunspot Number by SILSO
6. Noticeable Solar Events
7. Geomagnetic Observations in Belgium
8. Review of Ionospheric Activity
9. The SIDC Space Weather Briefing
10. Upcoming Activities
Proba-3 - Preparing for launch
Now that the satellites have safely reached the launch site in India, the final preparations and tests are ongoing. Proba-3 is nearly ready for launch!
The launch is still planned for December 4 and with little more than 2 weeks to go, we are on the edge of our seats!
Follow the final journey here: https://blogs.esa.int/proba-3/
Marie from Redwire Space can also fill you in on the recent progress: https://www.youtube.com/watch?v=ixEuT3Ka-d4
ESWW2025 Banner and poster competition OPEN
As for previous editions of the ESWW, we call upon the community to design a banner and poster for the conference.
The ESWW2025 contest assignment is to make a design in the theme Technological expansion of the Arctic: the new frontiers of space weather.
The winning design is used for the website banner, the ESWW2025 poster, announcements, presentations, etc.
Participation is very simple: send your design before December 16, 17:00 CET to the LOC ( esww2025 [dot] loc [at] gmail [dot] com ). We only need a picture/image/cartoon/ ... and no text. Also mention your names(s) and affiliation(s).
This competition is open to all and multiple submissions are allowed. The winner will receive a free registration to ESWW2025. Team submissions are accepted, but only one free ticket can be offered to the team.
In case your design wins, you will be asked to provide it with a minimum resolution of 150dpi and in format(s) suitable for use as a banner and as a poster (portrait).

Power grids during the 10-11 May storm
The 20th European Space Weather Week (ESWW - https://esww2024.org/ ) took place in Coimbra, Portugal from 4 to 8 November. A very well-attended session was the "Severe Space Weather Events and Impacts of May 2024", distributed over 3 (half) days.
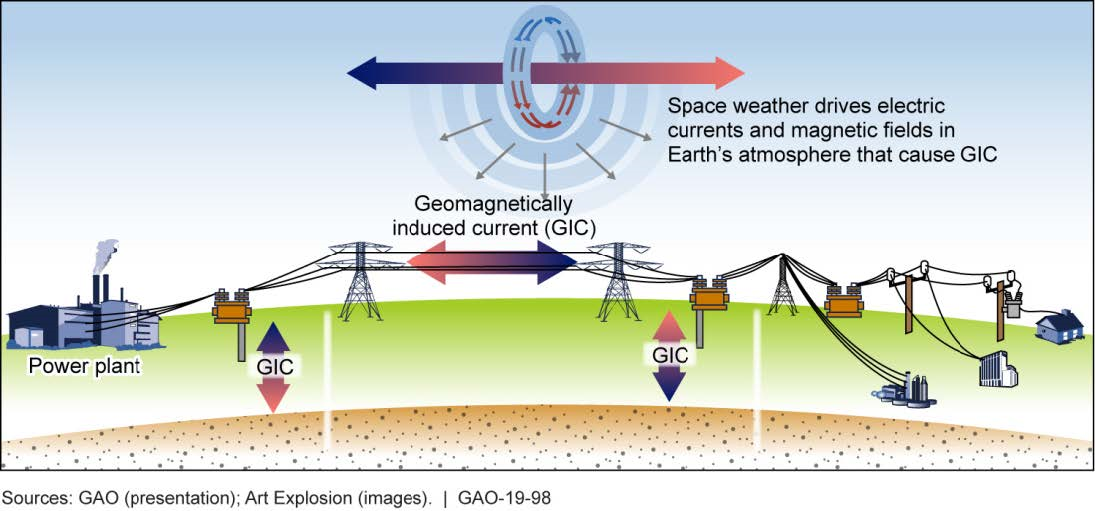
One of the recurring themes was the impact on the power grids, caused by the geomagnetically induced currents (GICs). These electrical currents are flowing in the Earth's subsurface and can enter the grid structure through the grounding devices. GICs are the result of an electrical field generated by rapid variations of the geomagnetic field following the impact of a space weather disturbance, usually a strong coronal mass ejection (CME). The intensity of GICs is expressed in Ampères ("A") and depends not only on the intensity of the magnetic disturbances and the latitude of the station, but also on the ground conductivity i.e. how well the current can flow through the ground (rock, clay,...), and the configuration of the technological systems where such currents are induced. Another important factor controlling GICs is the existence of the sharp electrical conductivity boundary between land and ocean, i.e. the coastal areas.
The strength of the electric field is expressed in volts per kilometer (V/km), with -depending on the location- typical values ranging from a fraction of a V/km during quiet space weather, to more than 10 V/km during a severe geomagnetic storm. The electric field itself changes on a time scale similar to the driving geomagnetic variation. The latter is called the rate-of-change of the Earth's magnetic field ("dB/dt") and is usually expressed in nT/min, though nT/s can be used during extremely severe storms when dB/dt can reach 10-20 nT/s. (Royal Academy of engineering - 2013 ; Despirak et al. 2024 https://doi.org/10.1016/j.jastp.2024.106293 ). The sketch underneath is courtesy of the US Government Accountability Office (https://www.gao.gov/products/gao-19-98 ).
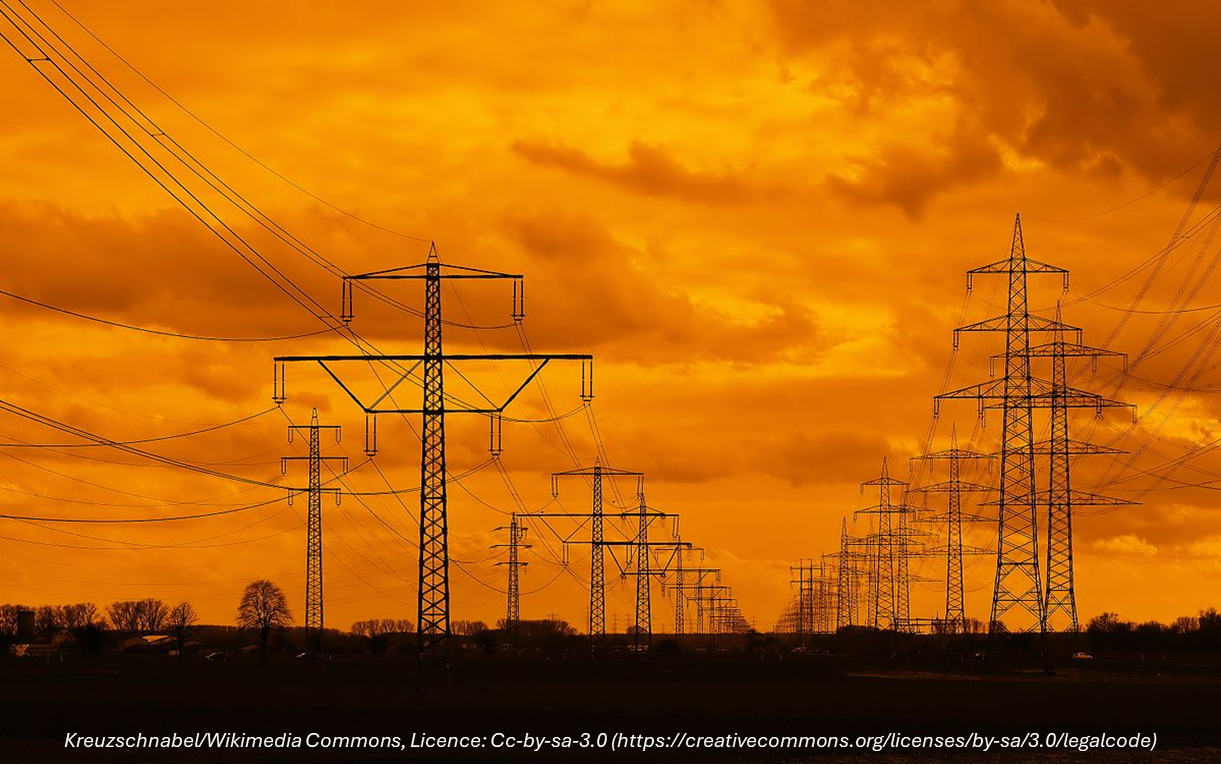
Most researchers were quick in emphasizing that the 10-11 May 2024 storm, despite reaching extreme storm levels, was certainly not as strong as e.g. the March 1989 or the October 2003 storms. The power grids certainly "felt" the impact of the geomagnetic storm, but it did not cause any damage.
- In the United Kingdom, the rate-of-change remained below 400 nT/min, with GICs up to 50 A. No problems were reported by the grid operators, although this was the 3rd largest storm after the storms in 1989 and 2003.
- In New Zealand, a grid emergency was declared on 10 May and some power lines were taken out as part of a mitigation plan. It is thought that without those measures, GICs would have been twice as high as the observed 100 A. Transformer tripping was observed on the southern island of New-Zealand.
- Some power grids in East and Central Europe reported problems on 10 May around 22:30UTC, which corresponded to a large spike in the magnetic field variation.
- Severe disturbances were also seen on the lines connecting Sweden with Denmark at the beginning of the storm, as well as with Poland around 22:30UTC on 10 May -the same time as in Central Europe- when there was a sudden loss of 600 MW, i.e. half a nuclear power plant. Some coordination meetings were held with the organizers of the Eurosongfestival that took place in Malmö (Sweden) on 7, 9 and 11 May 2024. That's indeed the same Malmö that experienced a power black-out during the Halloween storms in October 2003. With the Eurosong semi-finals taking place before the storm, and the final late on 11 May well after the most intense phase of the geomagnetic storm, no mitigation actions were taken. It was also noted that the disturbances were more present in central Sweden and at the coastal regions.
- In Alberta (Canada), GICs up to 170 A and an electric field of 1.1 V/km were recorded. Some tripping was reported, but there was no loss in service provisioning. Note that during the really major storms, GICS of several hundreds of Ampères have been recorded in the past.
- Japan reported no specific impact on its power grid system.
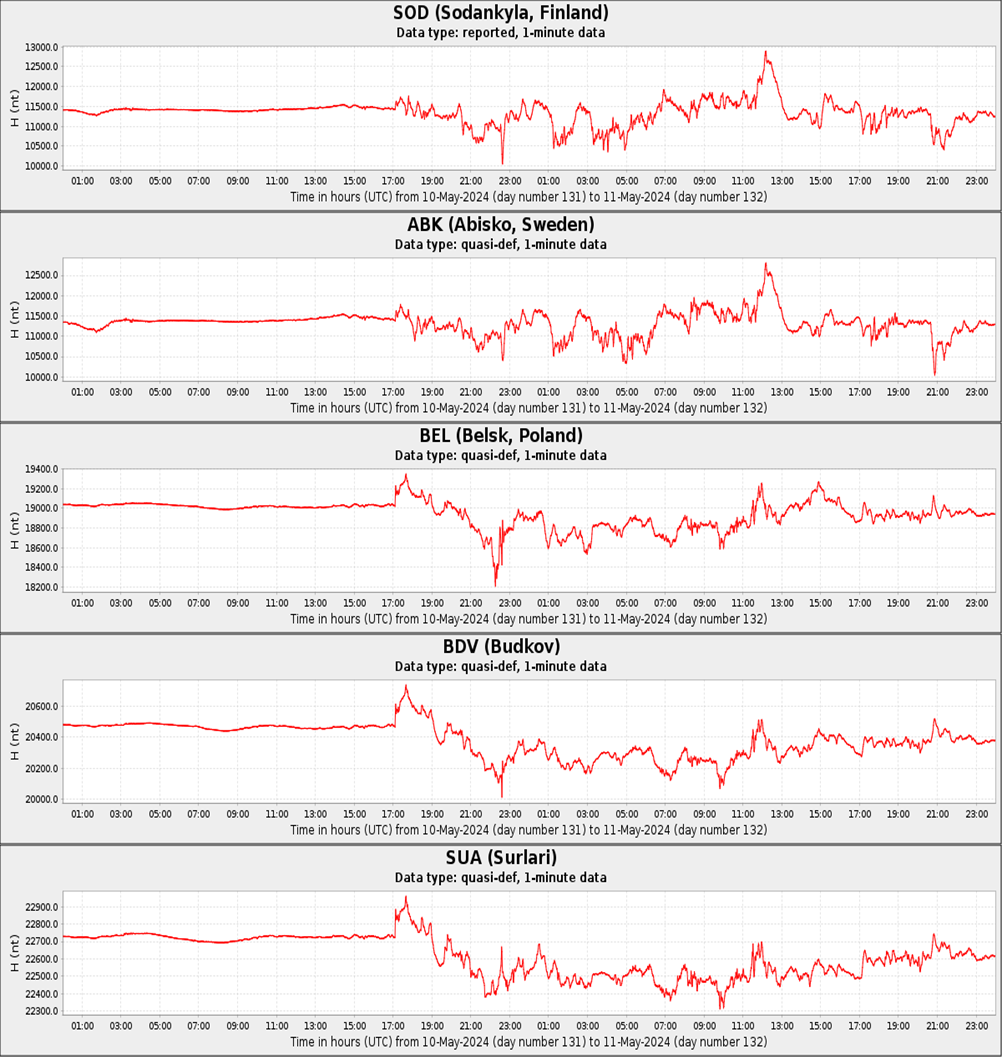
The magnetograms underneath show the evolution of the horizontal component of the Earth's magnetic field for stations in Finland, Sweden, Poland,Czech Republic and Romania (Intermagnet/BGS - https://imag-data.bgs.ac.uk/GIN_V1/GINForms2 ). Note the spike on 10 May around 22:30UTC.
Review of solar and geomagnetic activity
WEEK 1245 from 2024 Nov 04
Solar Active Regions and flares
Solar flaring activity this week started off at a moderate level on November 04, then went to high for the rest of the week. There were a total number of 17 active regions (ARs) observed on the visible solar disk over the week.
A total of 56 C-class flares, 41 M-class flares and 1 X-class flare were observed. The strongest of which was a X2.39-flare, with peak time at 13:40 UTC on November 06 and associated with SIDC Sunspot Group 305 (NOAA Active Region 3883). This AR produced most of the flaring activity throughout the week.
NOAA ARs 3872, 3887, 3889 and 3883 all produced M-class flares this week.
Coronal mass ejections
Multiple Coronal Mass Ejections (CMEs) were observed during the week. Out of the ones analyzed, one had an Earth directed component. A CME which was seen in SOHO/LASCO-C2 data at 00:36 UTC on November 04. This CME arrived at Earth around 14:20 UTC on November 07.
Coronal Holes
A negative polarity, high-latitude Coronal Hole (CH) in the norther hemisphere and a positive polarity mid-latitude CH in the Southern Hemisphere began to transition across the central meridian on November 06.
A positive polarity, low latitude CH started transitioning the central meridian on November 09 in the Northern Hemisphere.
No impact of a high-speed stream from these CHs was seen throughout the week but could have been obscured because the solar wind parameters were disturbed due to a ICME at the expected time of arrival.
Proton flux levels
The greater than 10 MeV GOES proton flux was enhanced but below the 10pfu threshold at the start of the week, gradually declining to background levels on November 05 and remained at background levels for the rest of the week.
Electron fluxes at GEO
The greater than 2 MeV electron flux rose above the 1000 pfu threshold between 15:30 and 18:10 UTC on November 07 but was at nominal levels for the rest of the week. The 24h electron fluence was at nominal levels.
Solar wind
At the beginning of the week, the solar wind was slightly elevated until it came under the influence of an ICME. A shock was registered in the solar wind data around 14:20 UTC on November 07. The interplanetary magnetic field quickly increased from 3 to 7 nT. The solar wind velocity increased from 380 to 420 km/s. After the ICME arrival, the interplanetary magnetic field reached a maximum of 21 nT and minimum Bz of -13 nT.
Throughout the week, the interplanetary magnetic field varied between 0.5 and 21 nT and the solar wind speed between 324 and 659 km/s.
Geomagnetism
Geomagnetic conditions were quiet to active locally and globally (K BEL 1-4 and Kp 1-4) at the start of the week until November 08 when the earth came under the influence of an ICME.
The geomagnetic conditions reached minor storm levels globally (Kp 5) and moderate storm levels locally (K BEL 6) on November 10.
International Sunspot Number by SILSO
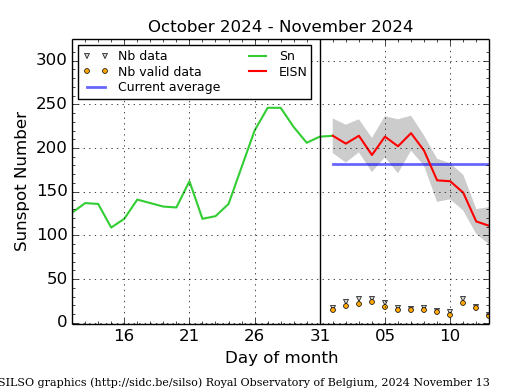
The daily Estimated International Sunspot Number (EISN, red curve with shaded error) derived by a simplified method from real-time data from the worldwide SILSO network. It extends the official Sunspot Number from the full processing of the preceding month (green line), a few days more than one solar rotation. The horizontal blue line shows the current monthly average. The yellow dots give the number of stations that provided valid data. Valid data are used to calculate the EISN. The triangle gives the number of stations providing data. When a triangle and a yellow dot coincide, it means that all the data is used to calculate the EISN of that day.
Noticeable Solar Events
| DAY | BEGIN | MAX | END | LOC | XRAY | OP | 10CM | TYPE | Cat | NOAA |
| 04 | 0052 | 0057 | 0102 | M1.5 | III/2 | 88 | 3883 | |||
| 04 | 0105 | 0140 | 0203 | M3.8 | II/1VI/3IV/1 | 88 | 3883 | |||
| 04 | 0338 | 0345 | 0353 | M1.1 | 91 | 3886 | ||||
| 04 | 0406 | 0415 | 0423 | M1.0 | 88 | 3883 | ||||
| 04 | 0431 | 0434 | 0438 | N17W11 | M1.4 | SF | 78 | 3878 | ||
| 04 | 0702 | 0708 | 0721 | S9E43 | M1.3 | SN | III/2 | 88 | 3883 | |
| 04 | 0829 | 0840 | 0847 | S7E42 | M1.2 | SF | 88 | 3883 | ||
| 04 | 1007 | 1017 | 1025 | S7E41 | M1.6 | SN | 88 | 3883 | ||
| 04 | 1405 | 1428 | 1450 | M1.1 | 88 | 3883 | ||||
| 04 | 1500 | 1508 | 1512 | M1.3 | 88 | 3883 | ||||
| 04 | 1538 | 1541 | 1545 | M5.5 | III/1 | 88 | 3883 | |||
| 05 | 0635 | 0654 | 0708 | M2.6 | ||||||
| 05 | 0911 | 0923 | 0949 | S7E28 | M1.0 | SF | III/2 | 88 | 3883 | |
| 05 | 1328 | 1339 | 1354 | M1.2 | 88 | 3883 | ||||
| 05 | 1358 | 1419 | 1427 | S6E24 | M2.9 | 2N | 88 | 3883 | ||
| 05 | 1505 | 1526 | 1543 | N16W42 | M4.1 | SF | II/1 | 75 | 3872 | |
| 06 | 0228 | 0238 | 0246 | M1.1 | 88 | 3883 | ||||
| 06 | 0302 | 0309 | 0314 | M1.2 | 88 | 3883 | ||||
| 06 | 0736 | 0804 | 0823 | S6E23 | M2.9 | S | VI/2III/1 | 88 | 3883 | |
| 06 | 0848 | 0850 | 0854 | N15W59 | M5.8 | SF | III/2 | 3887 | ||
| 06 | 1156 | 1204 | 1210 | S7E17 | M1.5 | SF | 88 | 3883 | ||
| 06 | 1256 | 1302 | 1311 | M1.2 | 3889 | |||||
| 06 | 1324 | 1340 | 1346 | N13W64 | X2.3 | SF | III/2 | 88 | 3883 | |
| 06 | 1427 | 1438 | 1445 | S11E38 | M5.3 | 1F | III/1 | 3889 | ||
| 06 | 1710 | 1718 | 1723 | M1.2 | 3889 | |||||
| 06 | 1853 | 1859 | 1913 | M1.1 | 3889 | |||||
| 06 | 2035 | 2042 | 2052 | M1.3 | 3889 | |||||
| 06 | 2310 | 2316 | 2321 | M1.1 | 3889 | |||||
| 07 | 0115 | 0127 | 0139 | S10E80 | M2.5 | SF | 3889 | |||
| 06 | 2342 | 0004 | 0016 | M1.6 | 3889 | |||||
| 07 | 0352 | 0420 | 0432 | S6E15 | M2.5 | 1N | 88 | 3883 | ||
| 07 | 0720 | 0726 | 0736 | S9E6 | M1.3 | 1 | III/2 | 88 | 3883 | |
| 07 | 0736 | 0743 | 0746 | S6E37 | M1.6 | S | 3889 | |||
| 07 | 0746 | 0754 | 0801 | M2.7 | 3889 | |||||
| 06 | 2243 | 2305 | 2310 | M1.1 | 3889 | |||||
| 07 | 1153 | 1202 | 1211 | S9E76 | M1.4 | 1F | 3889 | |||
| 07 | 1449 | 1506 | 1520 | S7E0 | M2.3 | 1F | VI/1 | 88 | 3883 | |
| 08 | 0253 | 0301 | 0312 | S7W5 | M1.5 | 1N | 88 | 3883 | ||
| 09 | 2044 | 2050 | 2054 | S8E36 | M1.2 | SN | 3889 | |||
| 10 | 0004 | 0015 | 0023 | S8E33 | M4.2 | 1B | 3889 | |||
| 10 | 1151 | 1206 | 1214 | S8E26 | M9.4 | 2B | III/2II/3 | 3889 | ||
| 10 | 2009 | 2021 | 2034 | S12E30 | M4.9 | 2N | 3889 |
| LOC: approximate heliographic location | TYPE: radio burst type |
| XRAY: X-ray flare class | Cat: Catania sunspot group number |
| OP: optical flare class | NOAA: NOAA active region number |
| 10CM: peak 10 cm radio flux |
Geomagnetic Observations in Belgium
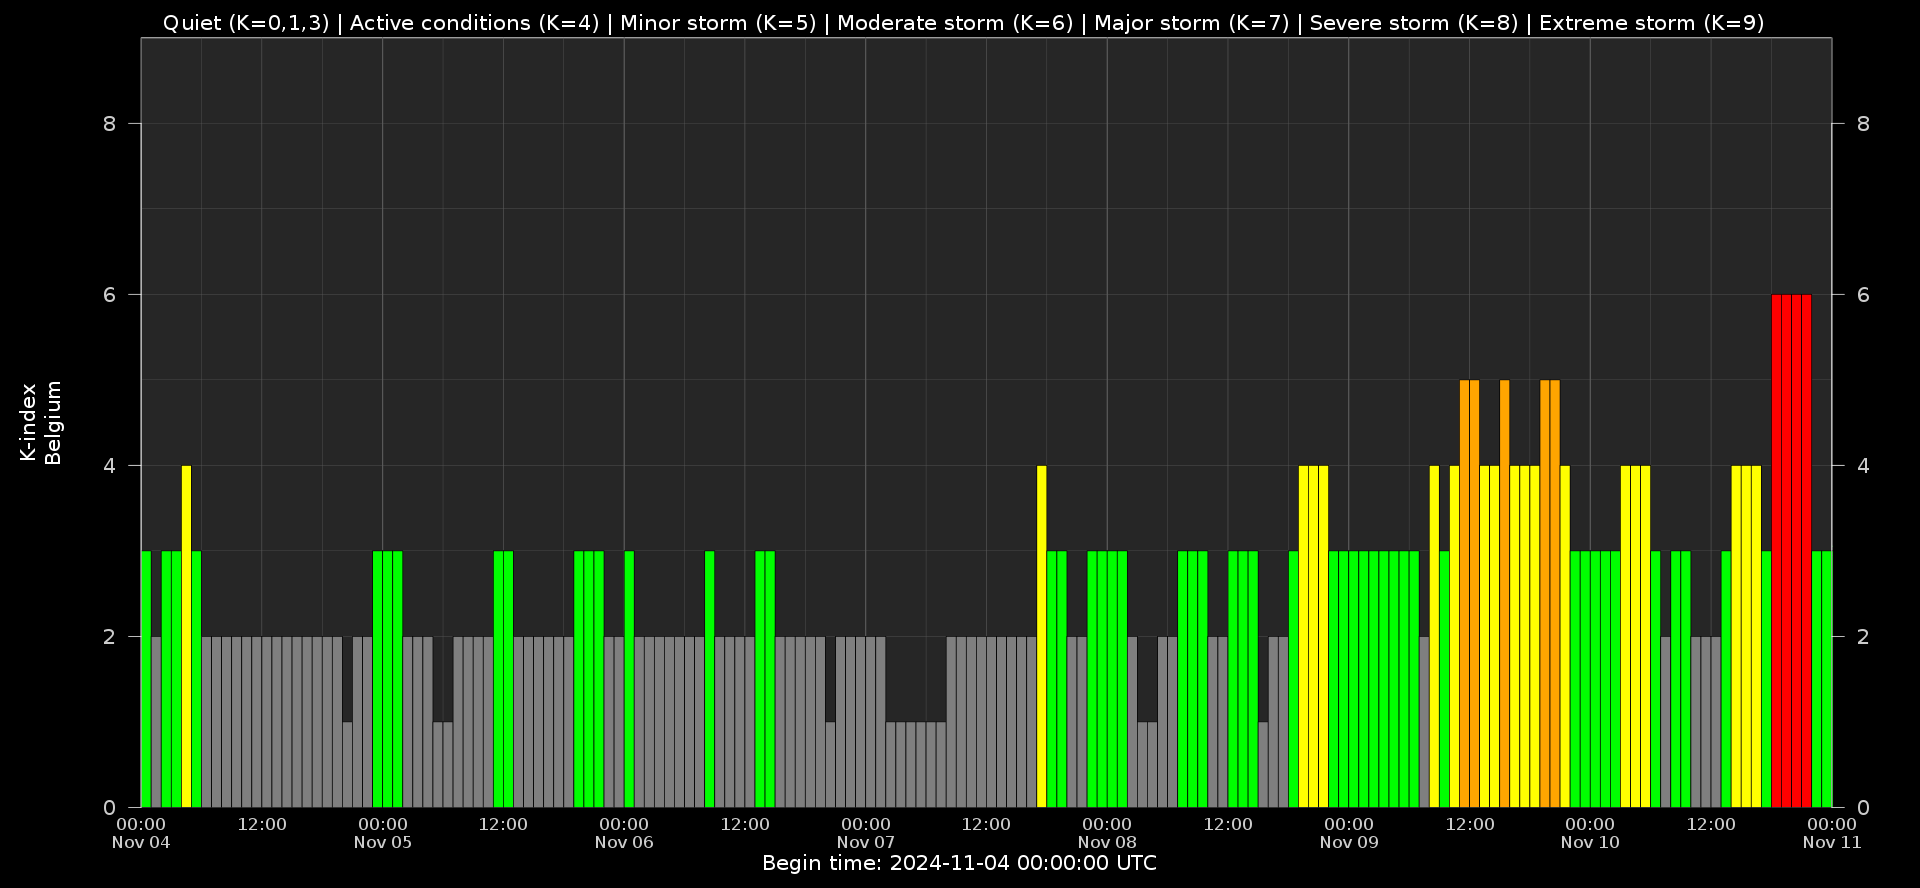
Local K-type magnetic activity index for Belgium based on data from Dourbes (DOU) and Manhay (MAB). Comparing the data from both measurement stations allows to reliably remove outliers from the magnetic data. At the same time the operational service availability is improved: whenever data from one observatory is not available, the single-station index obtained from the other can be used as a fallback system.
Both the two-station index and the single station indices are available here: http://ionosphere.meteo.be/geomagnetism/K_BEL/
Review of Ionospheric Activity
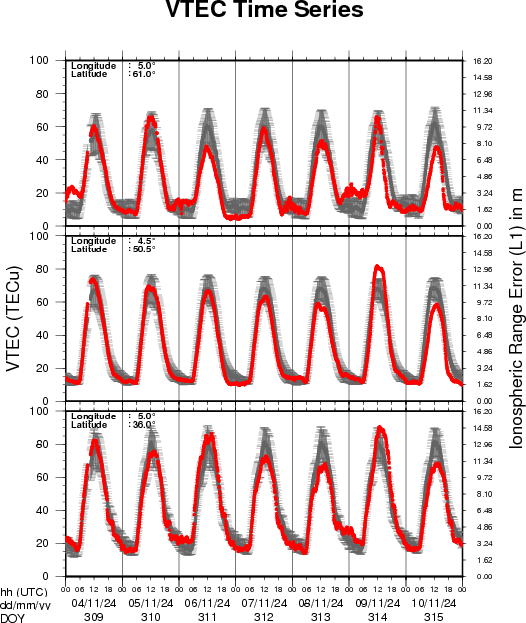
VTEC time series at 3 locations in Europe from 4 Nov 2024 till 10 Nov 2024
The top figure shows the time evolution of the Vertical Total Electron Content (VTEC) (in red) during the last week at three locations:
a) in the northern part of Europe(N 61deg E 5deg)
b) above Brussels(N 50.5deg, E 4.5 deg)
c) in the southern part of Europe(N 36 deg, E 5deg)
This top figure also shows (in grey) the normal ionospheric behaviour expected based on the median VTEC from the 15 previous days.
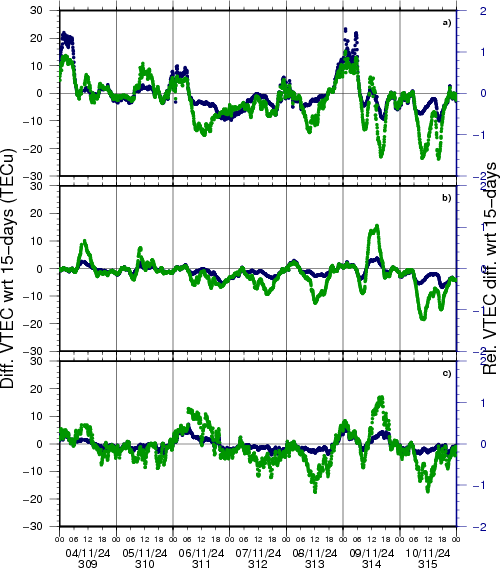
The time series below shows the VTEC difference (in green) and relative difference (in blue) with respect to the median of the last 15 days in the North, Mid (above Brussels) and South of Europe. It thus illustrates the VTEC deviation from normal quiet behaviour.
The VTEC is expressed in TECu (with TECu=10^16 electrons per square meter) and is directly related to the signal propagation delay due to the ionosphere (in figure: delay on GPS L1 frequency).
The Sun's radiation ionizes the Earth's upper atmosphere, the ionosphere, located from about 60km to 1000km above the Earth's surface.The ionization process in the ionosphere produces ions and free electrons. These electrons perturb the propagation of the GNSS (Global Navigation Satellite System) signals by inducing a so-called ionospheric delay.
See http://stce.be/newsletter/GNSS_final.pdf for some more explanations; for more information, see https://gnss.be/SpaceWeather
The SIDC Space Weather Briefing
The forecaster on duty presented the SIDC briefing that gives an overview of space weather from November 3 to 10.
The pdf of the presentation can be found here: https://www.stce.be/briefings/20241111_SWbriefing.pdf
Upcoming Activities
Courses, seminars and presentations with the Sun-Space-Earth system and Space Weather as the main theme. We provide occasions to get submerged in our world through educational, informative and instructive activities.
* Dec 5-6, 2024, STCE Course Space Weather impacts on aviation, online - full
* Jan 28-30, 2025, Role of the ionosphere and space weather in military communications, Brussels, Belgium - register: https://events.spacepole.be/event/208/
* Mar 17-18, 2025, Inleiding tot het ruimteweer, enkel voor leden van volkssterrenwachten, Brussels, Belgium - register: https://events.spacepole.be/event/213/
* Mar 24, 2025, STCE Lecture From Physics to Forecasting, ESA Academy's Space Weather Training Course
* April 28-30, 2025, STCE Space Weather Introductory Course, Brussels, Belgium - register: https://events.spacepole.be/event/214/
* May 26-27, 2025, STCE Course Space Weather impacts on aviation, online - register: https://events.spacepole.be/event/215/
* Jun 23-25, 2025, STCE Space Weather Introductory Course, Brussels, Belgium - register: https://events.spacepole.be/event/216/
* Sep 15-16, 2025, STCE Course Space Weather impacts on aviation, online - register: https://events.spacepole.be/event/218/
* Nov 17-19, 2025, STCE Space Weather Introductory Course, Brussels, Belgium - register: https://events.spacepole.be/event/217/
To register for a course and check the seminar details, surf to the STCE Space Weather Education Center: https://www.stce.be/SWEC
If you want your event in the STCE newsletter, contact us: stce_coordination at stce.be
Website: https://www.stce.be/SWEC