- Table of Content
- 1.Launch of Prob...
- 2.Out of the blu...
- 3.Review of sola...
- 4.International ...
- 5.Noticeable Sol...
- 6.Geomagnetic Ob...
- 7.Review of Iono...
- 8.The SIDC Space...
- 9.Upcoming Activ...
2. Out of the blue
3. Review of solar and geomagnetic activity
4. International Sunspot Number by SILSO
5. Noticeable Solar Events
6. Geomagnetic Observations in Belgium
7. Review of Ionospheric Activity
8. The SIDC Space Weather Briefing
9. Upcoming Activities
Launch of Proba-3 on December 4
ASPIICS onboard Proba-3 - Belgian research in the shadow of a satellite
Proba-3 is the latest ESA mission to be launched on December 4, 2024. Proba-3 consists of not one, but two satellites that will fly in precise formation around the Earth. One satellite will cast a shadow onto the other during 6 hours of the orbit, allowing the latter to observe a solar eclipse. During a solar eclipse, the solar atmosphere, or corona, becomes visible. The exploitation of ASPIICS, the instrument imaging the solar corona, is in the hands of the Royal Observatory of Belgium (ROB), where the associated scientific research will also be coordinated.
An artificial solar eclipse
One of the satellites carries a disk to obscure the sun, just as the moon does during a natural solar eclipse. The second satellite carries the instrument ASPIICS, the Association of Spacecraft for Polarimetric and Imaging Investigation of the Corona of the Sun, which takes advantage of these artificial solar eclipses to produce images of the solar corona.
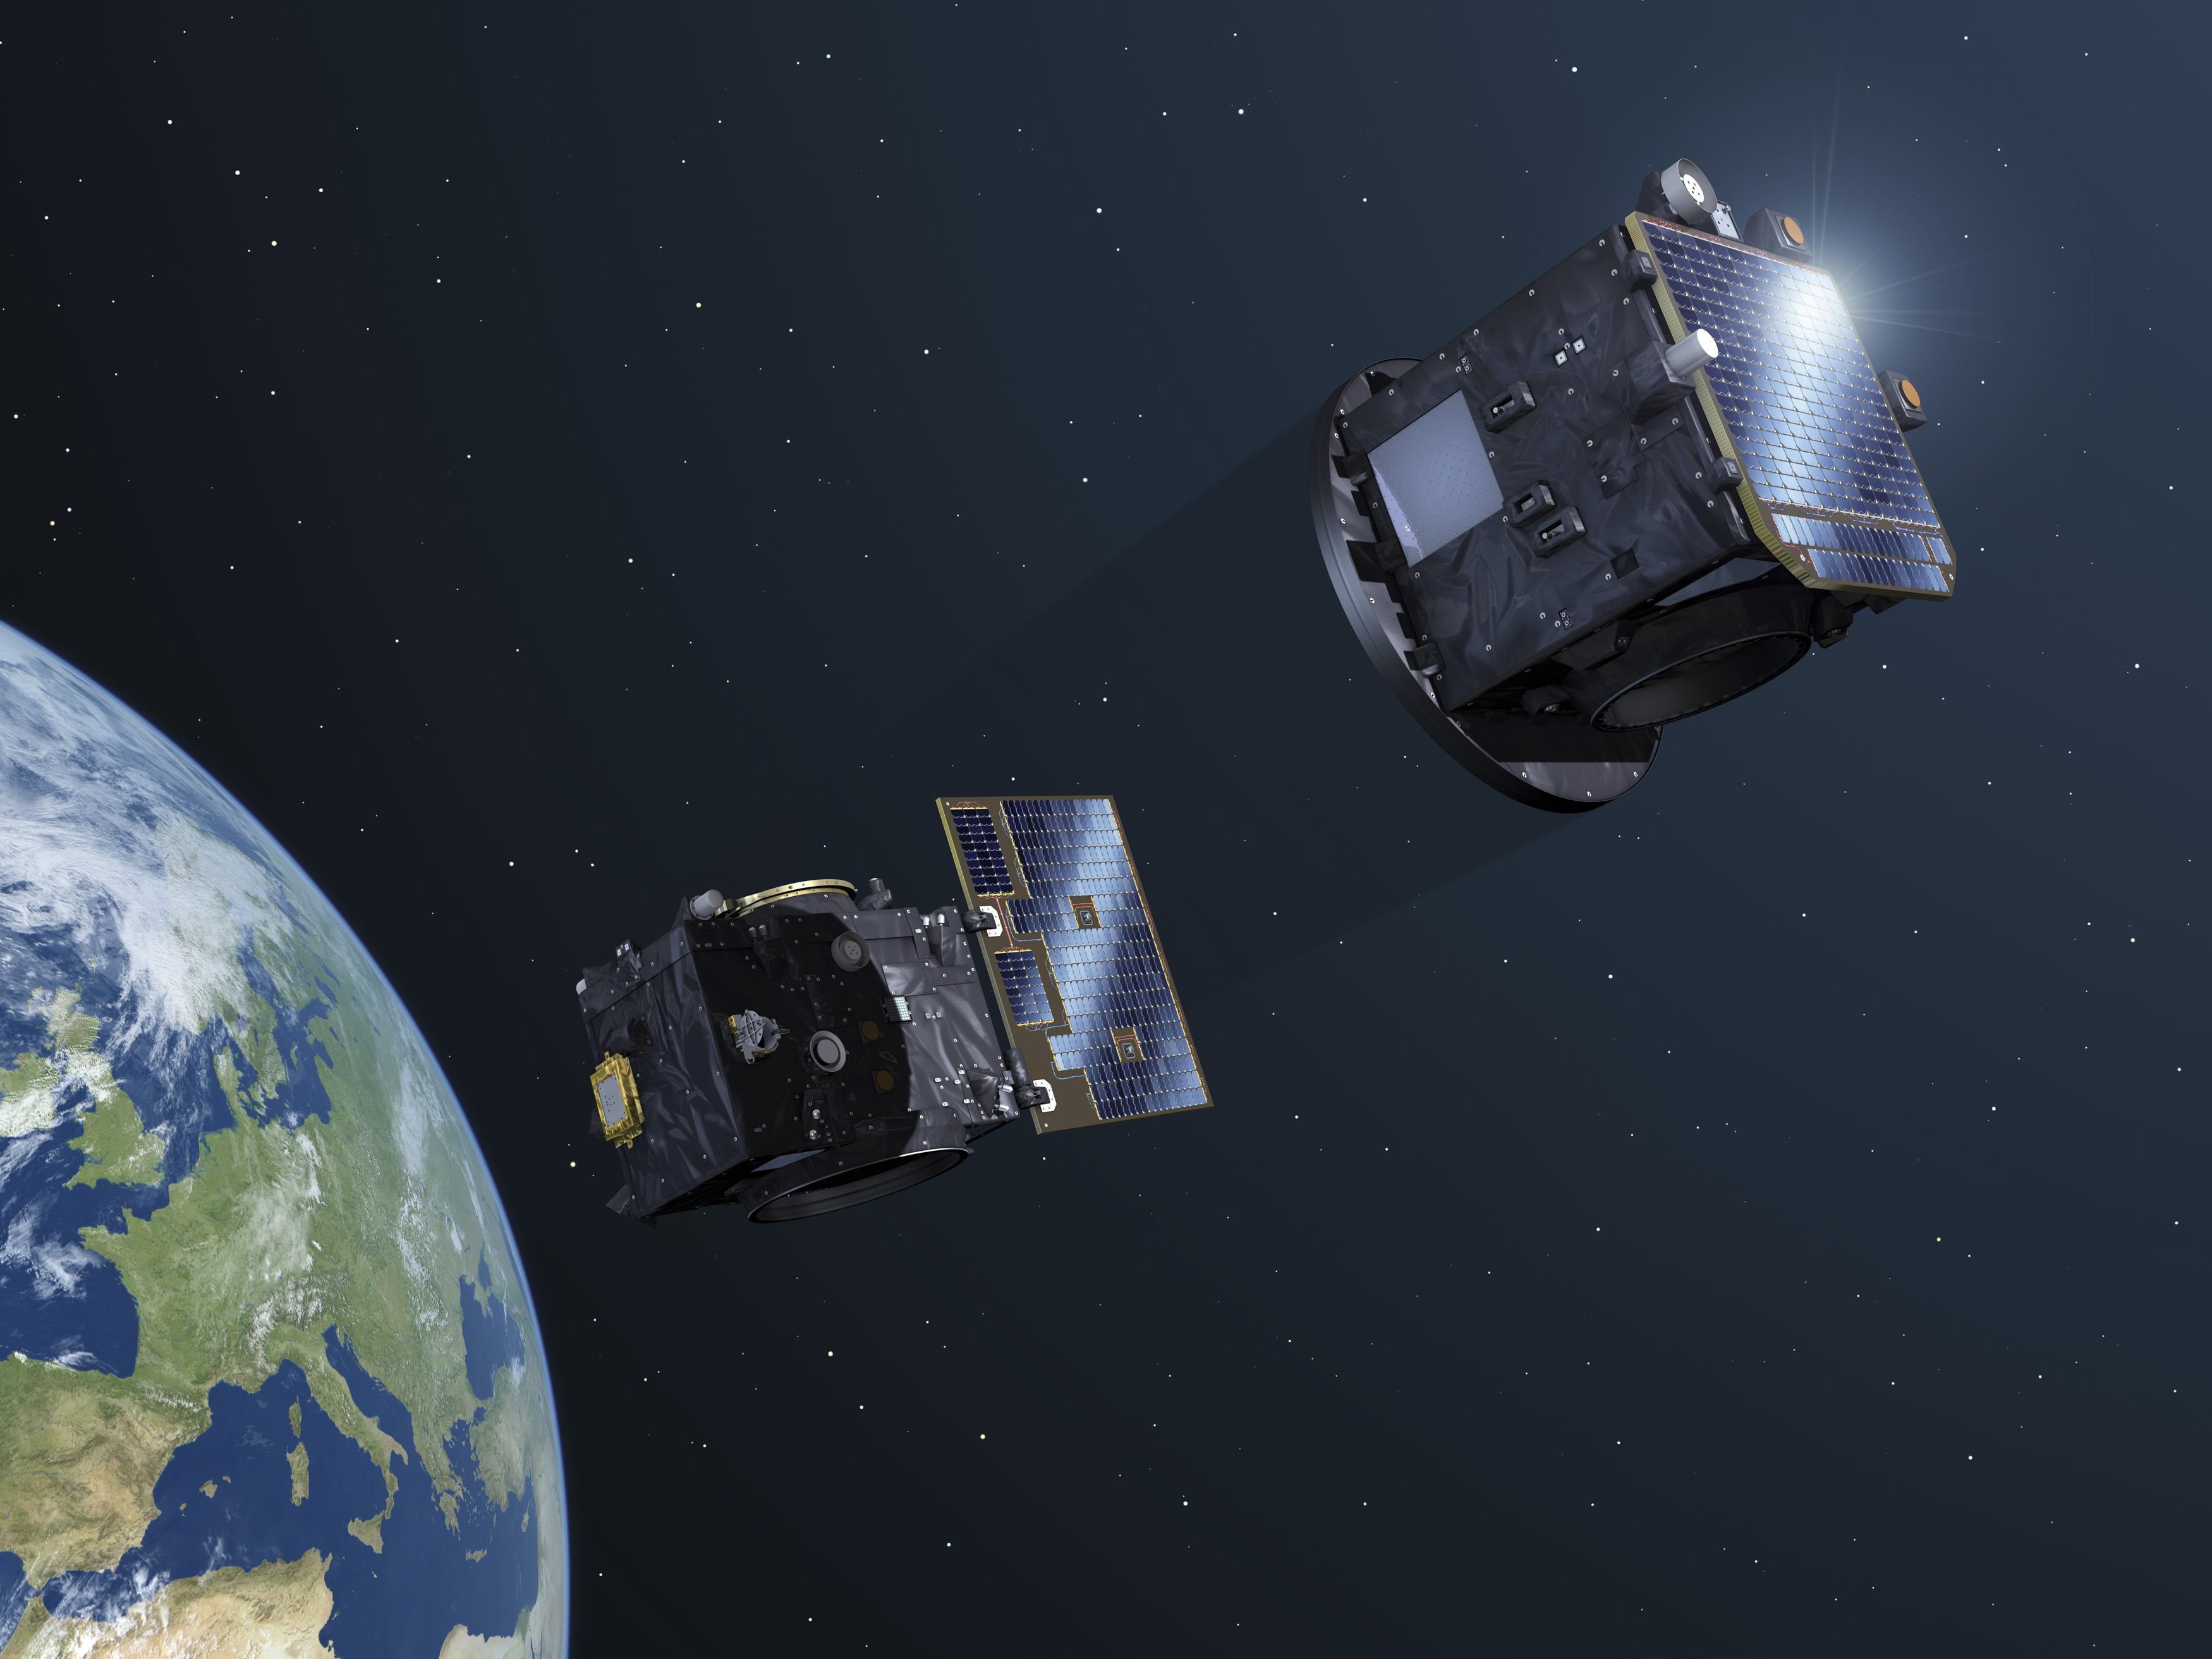
Credit: ESA - P. Carril
Filling in the blind spot
Andrei Zhukov (KSB), principal investigator of ASPIICS: "In visible light, we can observe quite well further away from the solar surface. In extreme ultraviolet light, we can clearly see the corona close to the solar rim. The area in between is not visible. This is a blind spot."
During a natural total solar eclipse, the moon covers the sun perfectly. For observers on Earth who are in the moon's shadow, this area becomes visible. However, a natural solar eclipse is rare, lasts only a few minutes and is only visible when there are no clouds in front of the sun blocking the view. Sometimes an eclipse can also only be observed from an inaccessible area on Earth.
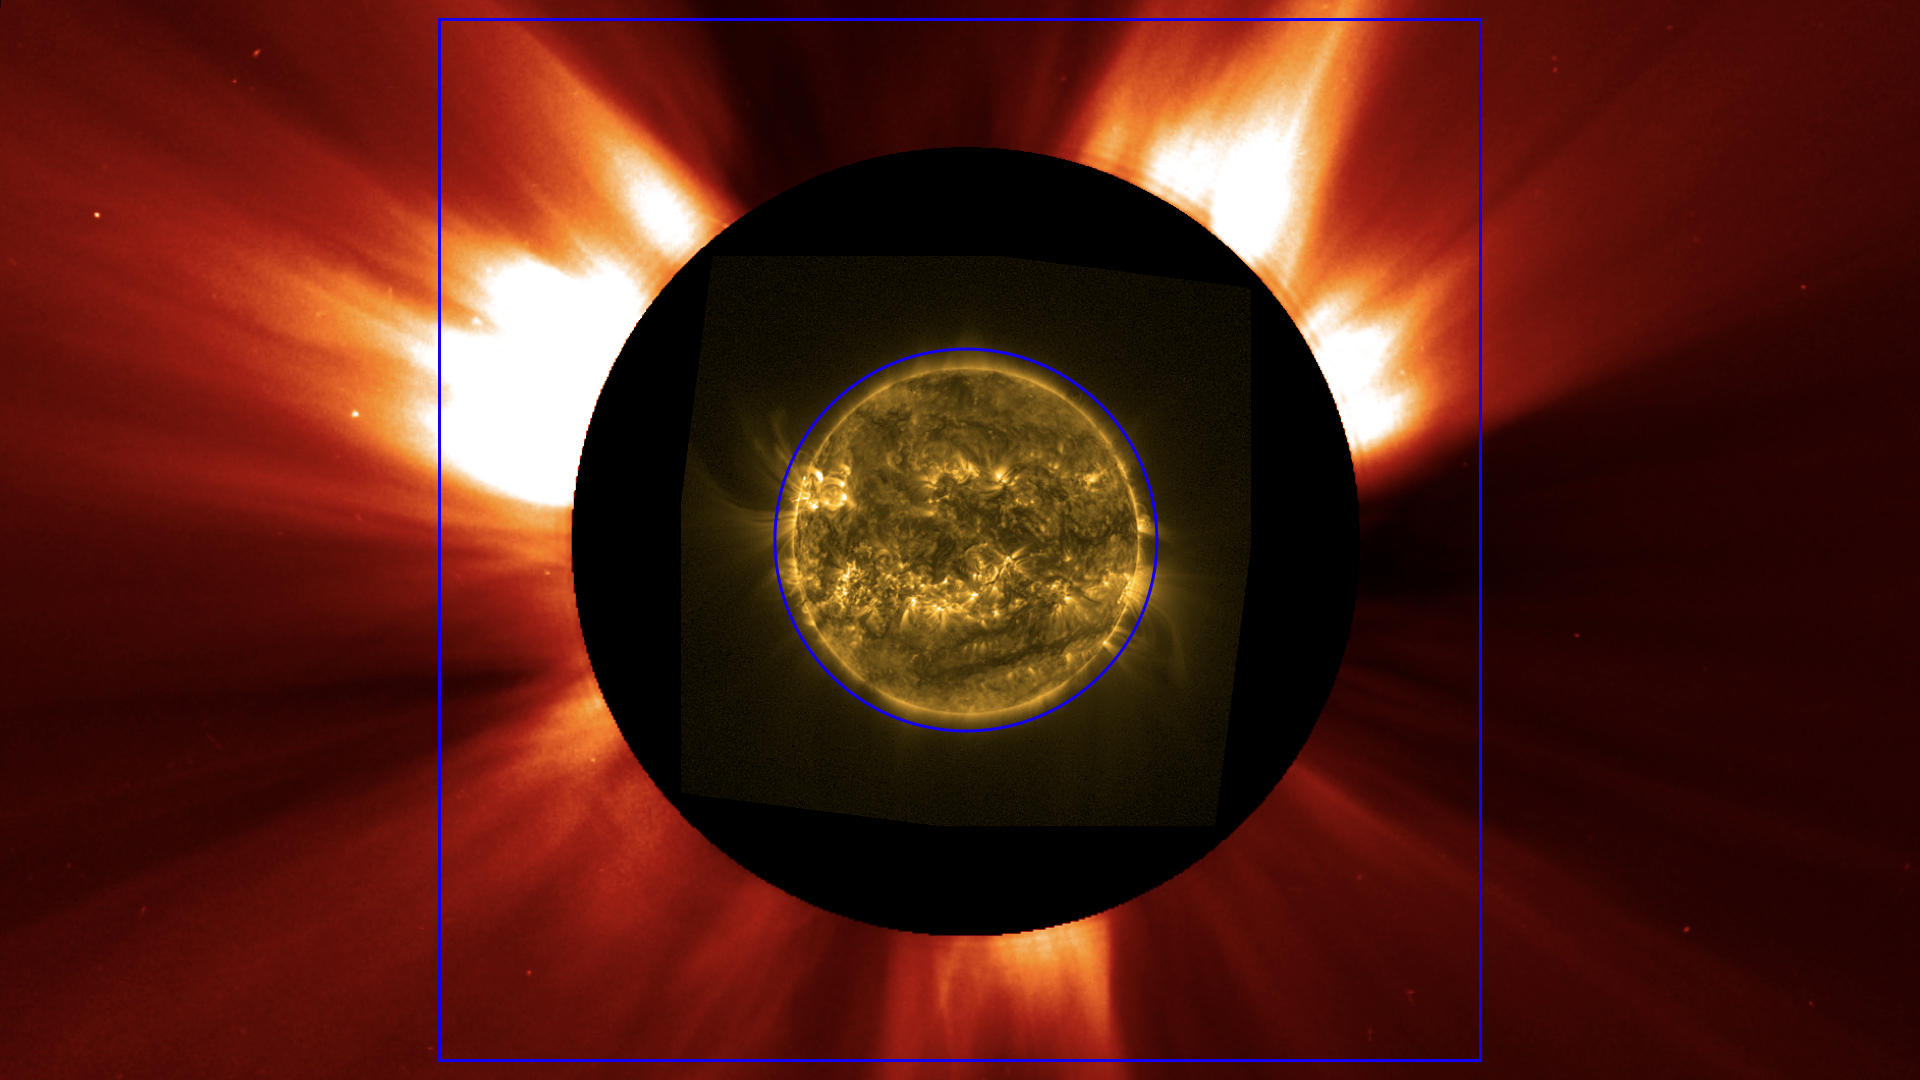
ASPIICS will image the area between the blue square and the blue circle, which is between 1.099 and 3.0 solar radii. The red image was taken in visible light by LASCO/C2 onboard the satellite SOHO. The yellow image is taken in extreme ultraviolet light by the SWAP telescope onboard Proba-2.
Andrei continues, "Proba-3 is intended to mimic a total solar eclipse for more than just a few minutes. This is achieved when the small satellite, as seen from the second satellite, covers the solar disk completely for an extended period.
At a distance of 144 meters, the disk's shadow is 7.5 centimeters wide. The eye of the telescope on the second satellite is 5 centimeters wide and must remain completely in the shadow of the occulting disk to observe a total eclipse. To achieve this, both satellites will fly in formation with millimeter precision. This is a huge technological challenge."
Orbit around Earth
Proba-3 will be launched in an elliptical orbit around Earth. Only when Proba-3 is in the farthest part of the ellipse, which is apogee, will the satellites fly in formation. At that stage of their orbit, they are easier to position because of their lower speed. Formation flying is achieved with thrusters which require fuel. Obviously, the amount of fuel that can be carried on a satellite is limited, so trade-offs have to be made. Proba-3 completes a full orbit in 20 hours. The compromise is that the satellites will fly in formation during 6 hours of an orbit, several times a week. The amount of fuel is thus calculated for a mission with a duration of 2 years.
Andrei Zhukov: "We carry fuel for about 1000 hours of formation flying and will observe the low solar corona with ASPIICS during 2 orbits per week, 6 hours uninterrupted each time. This is 100 times longer than a total solar eclipse of only a few minutes as we observe them from Earth."
Attention to detail
One image of ASPIICS is actually composed of three separate observations. The part of the solar atmosphere closer to the sun is photographed with a shorter exposure time than the less bright regions further away. In this way, each part of the solar atmosphere can be imaged clearly and with the best contrast.
Researchers suspect that the answers to important scientific questions lie in the details of the images. They want to know where and how the solar wind originates and accelerates, how solar plasma dislodges and eventually races through space as a plasma cloud. They also hope to better understand the physical processes that heat the solar atmosphere to millions of degrees, when the temperature of the sun's surface is only a few thousand degrees.
From idea to launch
The idea for the Proba-3 mission originated 20 years ago: everything began with initial studies by the French space industry and a first proposal for the instrument in 2009. In 2014, the project gained momentum when Andrei Zhukov of the Royal Observatory of Belgium (ROB) was appointed as the new principal investigator and the Centre Spatiale de Liège (CSL) was allowed to build the instrument. A team of scientists, engineers and software specialists was also assembled at the ROB. These experts determine how and when ASPIICS should observe, process the observations and prepare them for scientific use. The software used for this, is very specific and thus custom written for ASPIICS. This work has been ongoing for years. The team is now ready to undertake the instrument's testing after launch and move to the operational phase after 4 months. The first images of ASPIICS should then show that the experiment has succeeded.
A scientist's playground
Andrei Zhukov: "When I first heard about this project, I was immediately excited. I was able to cooperate with specialists from all over the world, with renowned scientists who had already earned their stripes in past space missions, with brilliant engineers, and with talented software developers. Together we are trying to improve current observation techniques. We also expect that the 6-hour observations of solar eclipses will provide unique data. The best is yet to come!"
Teamwork make the dream work
In Belgium, ASPIICS was built by:
* A consortium led by the Centre Spatial de Liege (CSL), made up of 15 companies and institutes from five ESA Member States.
* OIP Sensor Systems (Oudenaarde), as a subcontractor to CSL was responsible for the design and development of the ASPIICS Focal Plane Assembly (FPA) and Camera Electronic Box (CEB).
* Andrei Zhukov (Royal Observatory of Belgium) is the Principal Investigator of ASPIICS and leads the international ASPIICS Science Team that supported the development.
Funding from the Belgian Federal Science Policy Office (BELSPO) through the PRODEX and GSTP programs of the European Space Agency (ESA) was essential.
Other scientific instruments on Proba-3 and Belgian involvement therein:
* DARA, a radiometer, is led by the Swiss institute PMOD. Andrei Zhukov and Marie Dominique (Royal Observatory of Belgium) are part of the research team.
* 3DEES investigates energetic particles. UCL provides the principal investigator. The Royal Belgian Institute for Space Aeronomy and Redwire Space are part of the 3DEES consortium.
Out of the blue
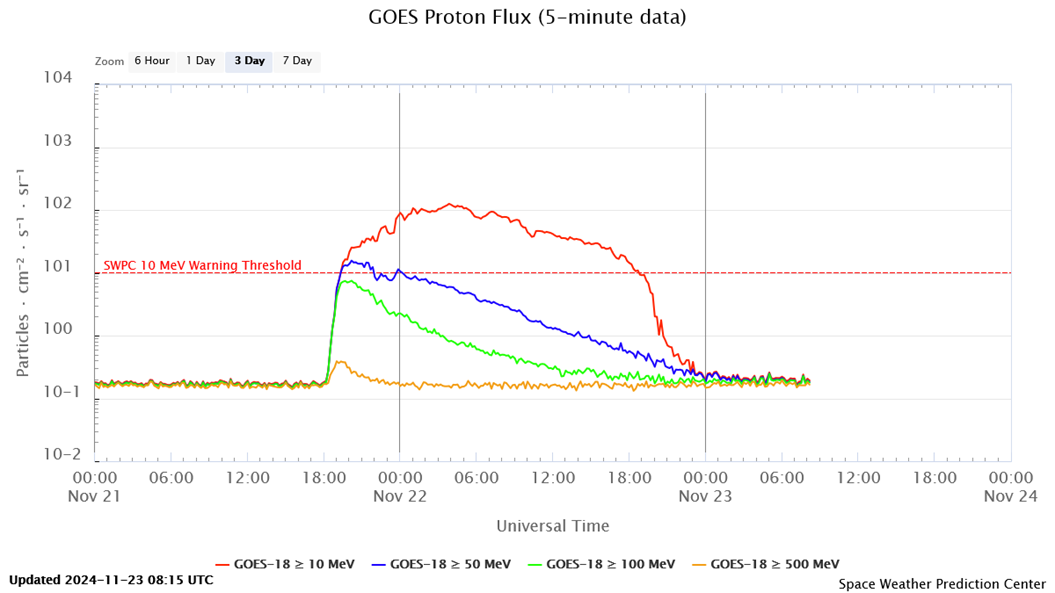
In what was all-in-all a relatively quiet week with only a dozen or so low-level M-class flares, a proton event started on 21 November at 19:25UTC (GOES - https://www.swpc.noaa.gov/products/goes-proton-flux ). The greater than 10 MeV proton flux would reach a maximum of 125 pfu on 22 November at 03:55UTC, and dipping already back below the 10 pfu alert threshold the same day at 18:45UTC. Also, the greater than 100 MeV increased, reaching a peak of 7.4 pfu on 21 November at 20:10UTC. This can be seen in the graph underneath, with different colors showing the fluxes of different energies of the protons. The red curve represents the greater than 10 MeV proton flux.
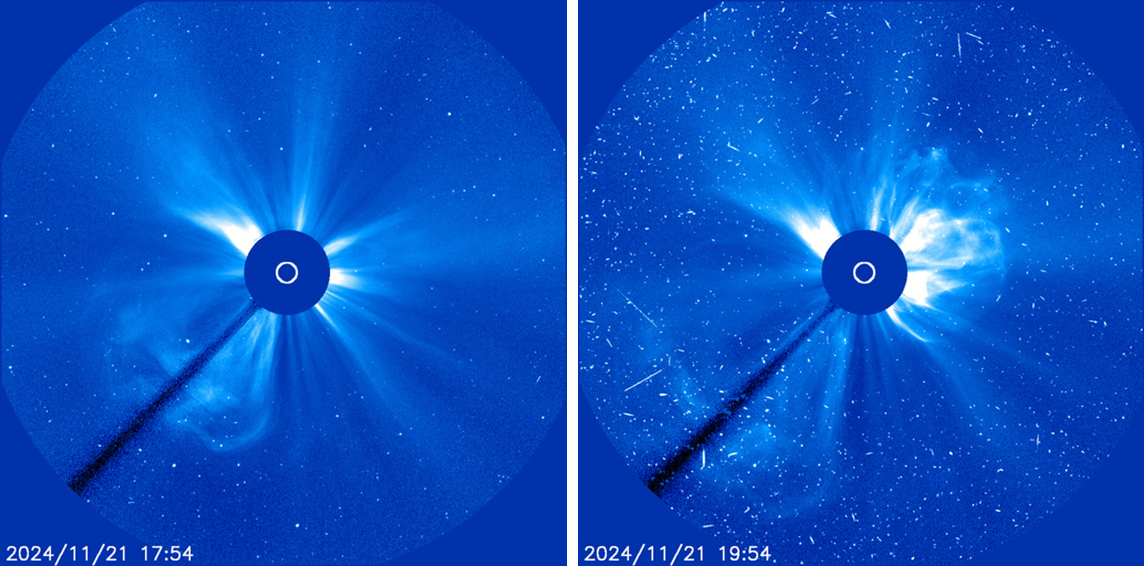
In view of the response from the high energy protons, one would assume a strong flaring event to have taken place. However, the GOES (https://www.swpc.noaa.gov/products/goes-x-ray-flux ) did not record a significant flare around that time. More info came from coronographic imagery of the SOHO (https://soho.nascom.nasa.gov/data/realtime-images.html ), showing a powerful coronal mass ejection (CME) in the northwestern ("upper right") direction first visible at 18:12UTC. This can be seen in the LASCO C3 imagery underneath showing a before and after imahe on 21 November. According to CACTus (SIDC - https://www.sidc.be/cactus/ ), this partial halo CME was fast with a plane-of-the-sky speed around 1100 km/s. Space weather forecasters all concluded that this CME was not earth-directed. The CME's emergence coincided with the increase in "noise" in the coronagraphic imagery, due to the impact of the protons on the camera's pixels. So, just to be clear, around 19:00UTC, the protons -which travel at a substantial fraction of the speed of light- have already arrived at Earth, whereas the much slower CME has only just been ejected and is still relatively close to the Sun. A clip is in the online version of this newsitem at https://www.stce.be/news/739/welcome.html
So, what was the origin of this proton event? Here the STEREO-A spacecraft (https://stereo-ssc.nascom.nasa.gov/ ) was of great help. This satellite is currently leading the Earth by about 28 degrees, and so it can see a bit of the Sun's farside that is not visible from Earth (beyond the west limb). It has a telescope that observes the Sun in extreme ultraviolet (EUV) in 4 different wavelengths. At 19.5 nm (see the imagery underneath), it shows indeed a strong solar flare starting around 18:00UTC and reaching a maximum around 18:15UTC. From the width of the spike -caused by saturation of the camera's pixels"-, a soft x-ray (SXR) intensity of X3.0 is obtained (see Chertok et al. 2015 for the methodology - https://link.springer.com/article/10.1007/s11207-015-0738-4 ; this STCE newsitem discusses another farside event: https://www.stce.be/news/712/welcome.html ). Correcting for the downscaled GOES SXR values prior to GOES-16, a value in the range between X2.1 and X6.4 is obtained, with X4.3 the most likely intensity for this flare. Even for STEREO-A, the flare was located at the Sun's west limb, meaning that the source of the flare was at least 28 degrees beyond the Sun's west limb as seen from Earth. A very likely candidate is then NOAA 13889 which fully rounded the west limb late on 19 November. This region was an active M-class flare producer (22!) during its transit over the solar disk. Some interaction with nearby NOAA 13897 is not excluded. At any rate, this must have been quite a complex eruption, taking place at the west-southwest limb but ejecting the CME in the northwestern direction.

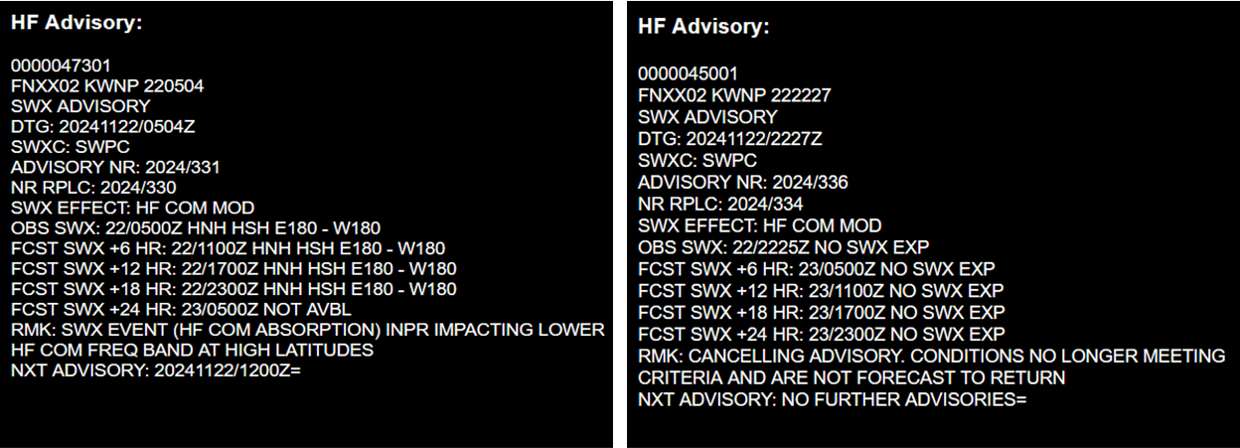
The observed intensity of the proton event corresponds to an S2 solar radiation storm (see the NOAA scales at https://www.swpc.noaa.gov/noaa-scales-explanation ). The associated impacts seem to have been restricted to minor degradation of the High Frequency communication (HF Com ; 3-30 MHz) over the Earth's polar regions, as well as some minor impact on the data and communication stream from satellites (the so-called single event upsets (SEU) or "bit flips") and increased "noise" in imagery and for their star-trackers. Though the high latitude neutron monitors recorded some enhancement in the neutron counts, not all conditions seem to have been fulfilled to make this a Ground Level Enhancement (see the SC25 Tracking page for more info on GLEs - https://www.stce.be/content/sc25-tracking#gle ). No advisory was sent to the civil aviation for radiation hazard, only for potentially degraded HF Com (PECASUS/SWPC - https://pecasus.eu/ ).
Review of solar and geomagnetic activity
WEEK 1247 from 2024 Nov 18
Solar Active Regions and flares
Solar flaring activity was at low to moderate levels over the week. There was a total of 17 numbered active regions (ARs) observed on the visible solar disk over the week.
At the start of the week, between November 17 and November 18, the flaring activity was dominated by the newly numbered SIDC Sunspot Group 298 (NOAA Active Regions 3901), which rotated over the east solar limb. This region produced multiple M-class flares, the largest of which was an M3.7 flare (SIDC Flare 2647), peaking on November 18 at 12:53 UTC.
The flaring activity reduced slightly during the middle of the week, with only one M-class flare recorded. This was an M1.1 flare (SIDC Flare 2669) with peak time of November 20 at 19:48 UTC, which was produced by SIDC Sunspot Group 316 (NOAA Active Region 3897) as it rotated off the solar disk.
Towards the end of the week the flaring activity increased again to moderate levels with SIDC Sunspot Group 298 (NOAA Active Regions 3901) as well as several new active regions, SIDC Sunspot Group 323 (NOAA Active Region 3906) and SIDC Sunspot Group 322 (NOAA Active Region 3905), producing low level M-class flares.
Coronal mass ejections
No Earth-directed Coronal Mass Ejections (CMEs) were detected in the available coronagraph imagery over the past week. Two partial halo CMEs were observed on November 21, but both were related to far-side events.
Coronal Holes
Two small negative polarity coronal holes, both of which were in the southern hemisphere and appeared patchy, began to transit the central meridian on November 18 and 20, respectively.
Proton flux levels
The greater than 10 MeV GOES proton flux was below the 10 pfu threshold at the start of the week. It increased above 10 pfu from 19:25 UTC November 21 and reached a maximum value of 125 pfu at 03:30 UTC November 22. The event was associated to the second halo CME observed beyond the west limb. The proton flux then decreased quickly on November 22 and returned below the threshold from 18:45 UTC November 22.
Electron fluxes at GEO
The greater than 2 MeV electron flux remained below the 1000 pfu threshold as measured by GOES-16, but briefly crossed the threshold on November 17 as measured by GOES-18. The 24h electron fluence was at nominal levels.
Solar wind
The solar wind conditions reflected predominantly a slow solar wind regime, with slight increases in velocity that may be associated with connection to the negative polarity coronal holes. The interplanetary magnetic field was slightly elevated during the week with a maximum value of 12 nT and Bz reaching a minimum value of -10nT. The solar wind speed ranged between 300 and 500 km/s. The interplanetary magnetic field phi angle was mostly in the positive sector at the start of the week and switched to the negative sector (directed towards the Sun) from November 21.
Geomagnetism
Geomagnetic conditions were mostly quiet to unsettled, with two short intervals of active conditions.
International Sunspot Number by SILSO
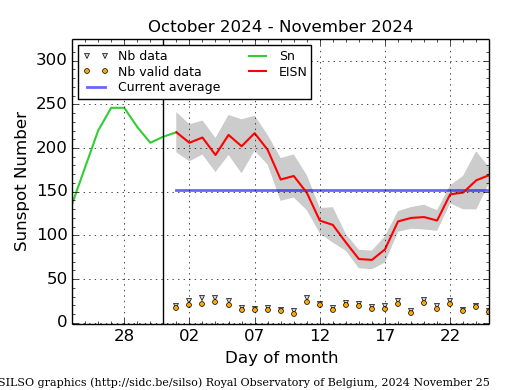
The daily Estimated International Sunspot Number (EISN, red curve with shaded error) derived by a simplified method from real-time data from the worldwide SILSO network. It extends the official Sunspot Number from the full processing of the preceding month (green line), a few days more than one solar rotation. The horizontal blue line shows the current monthly average. The yellow dots give the number of stations that provided valid data. Valid data are used to calculate the EISN. The triangle gives the number of stations providing data. When a triangle and a yellow dot coincide, it means that all the data is used to calculate the EISN of that day.
Noticeable Solar Events
| DAY | BEGIN | MAX | END | LOC | XRAY | OP | 10CM | TYPE | Cat | NOAA |
| 18 | 0513 | 0522 | 0527 | M1.0 | 3901 | |||||
| 18 | 0725 | 0732 | 0736 | S7E76 | M1.7 | SF | 3901 | |||
| 18 | 0754 | 0757 | 0801 | S7E76 | M1.2 | 1 | III/2 | 3901 | ||
| 18 | 1041 | 1058 | 1102 | S7E76 | M2.5 | SF | 3901 | |||
| 18 | 1106 | 1112 | 1119 | M1.6 | III/2VI/2 | 95 | 3897 | |||
| 18 | 1119 | 1127 | 1144 | S7W87 | M1.5 | SF | II/2CTM/1 | 95 | 3897 | |
| 18 | 1242 | 1253 | 1257 | M3.7 | III/2III/1 | 3901 | ||||
| 18 | 1743 | 1749 | 1754 | S7E68 | M1.8 | 1F | 3901 | |||
| 18 | 1845 | 1915 | 1948 | S9E72 | M2.0 | SN | II/1 | 3901 | ||
| 18 | 2350 | 0004 | M1.1 | 93 | 3889 | |||||
| 20 | 1911 | 1948 | 2044 | M1.1 | 95 | 3897 | ||||
| 22 | 1542 | 1546 | 1551 | S8E73 | M1.6 | 1 | 14 | 3905 | ||
| 22 | 2126 | 2215 | 2233 | M1.0 | 3906 | |||||
| 23 | 1554 | 1607 | 1621 | S7E4 | M1.1 | 2 | 3 | 3901 | ||
| 23 | 1749 | 1810 | 1834 | M1.1 | 3908 | |||||
| 24 | 2011 | 2022 | 2031 | M1.1 |
| LOC: approximate heliographic location | TYPE: radio burst type |
| XRAY: X-ray flare class | Cat: Catania sunspot group number |
| OP: optical flare class | NOAA: NOAA active region number |
| 10CM: peak 10 cm radio flux |
Geomagnetic Observations in Belgium
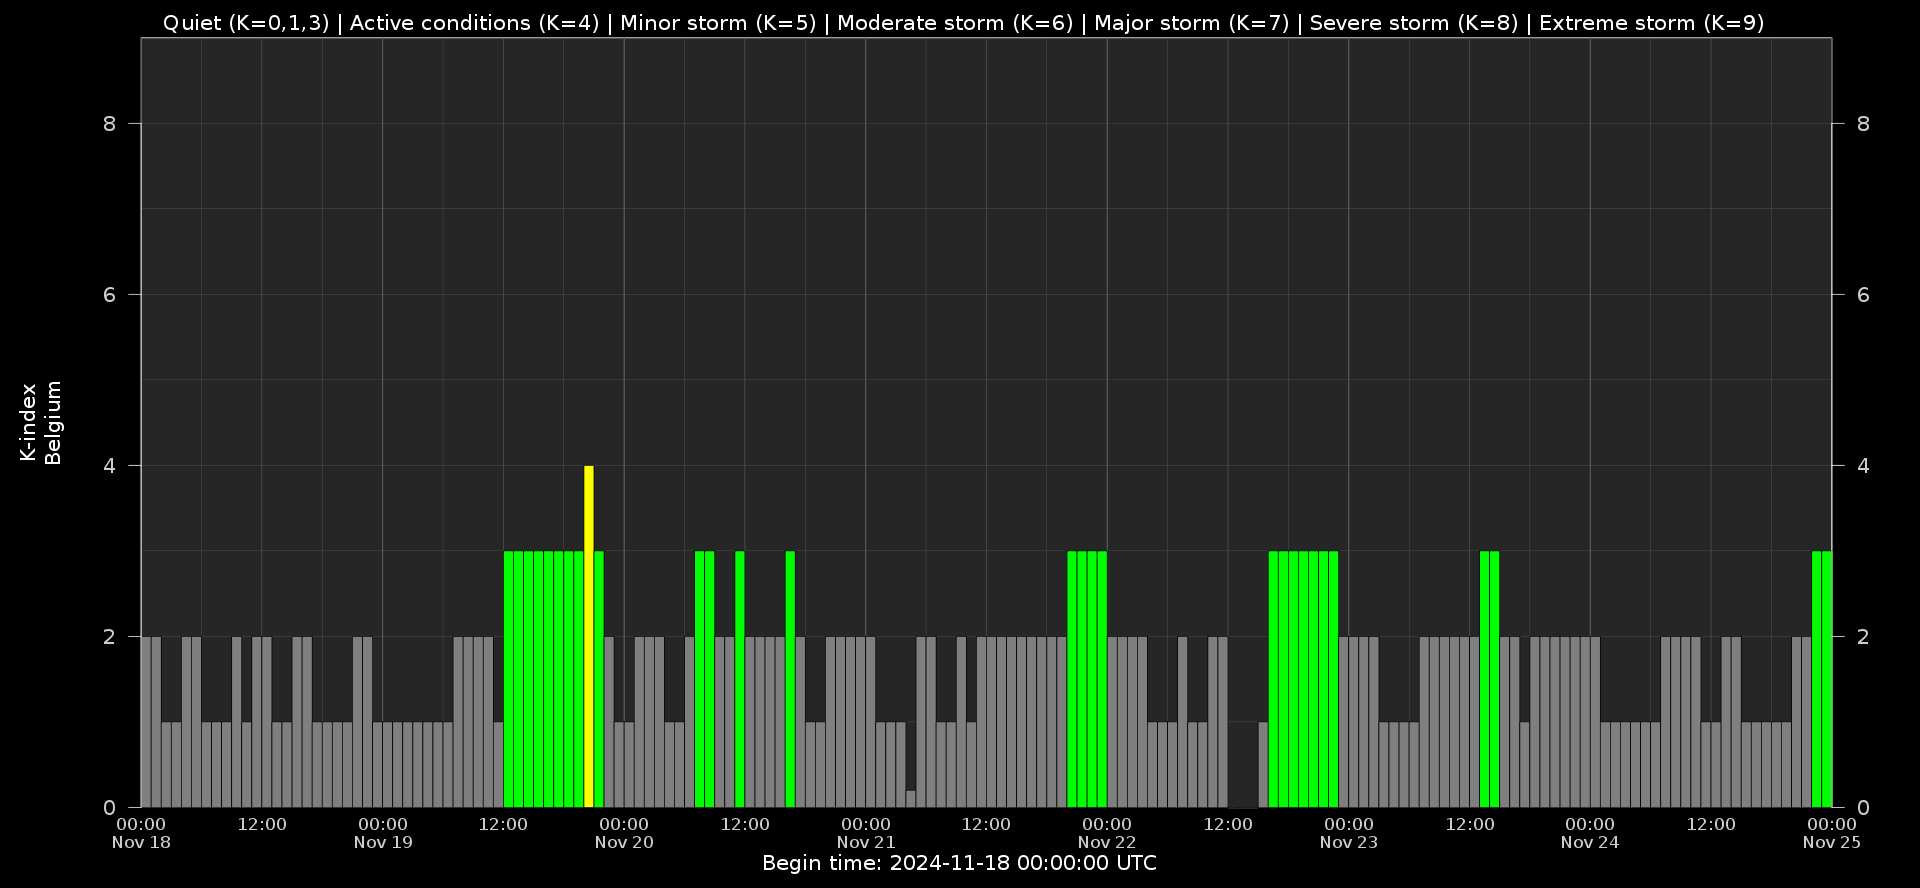
Local K-type magnetic activity index for Belgium based on data from Dourbes (DOU) and Manhay (MAB). Comparing the data from both measurement stations allows to reliably remove outliers from the magnetic data. At the same time the operational service availability is improved: whenever data from one observatory is not available, the single-station index obtained from the other can be used as a fallback system.
Both the two-station index and the single station indices are available here: http://ionosphere.meteo.be/geomagnetism/K_BEL/
Review of Ionospheric Activity
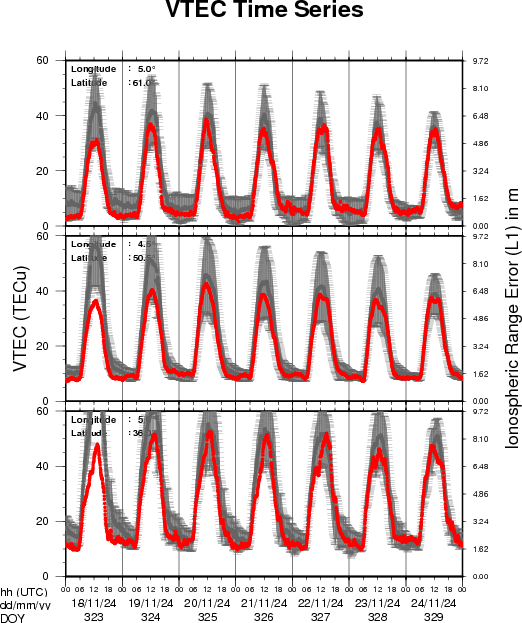
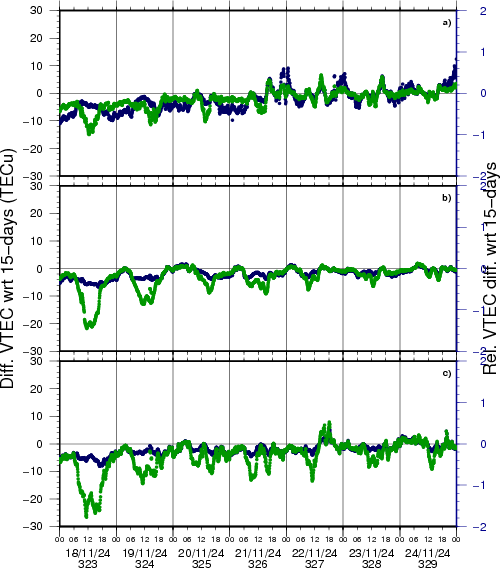
VTEC time series at 3 locations in Europe from 18 Nov 2024 till 24 Nov 2024
The top figure shows the time evolution of the Vertical Total Electron Content (VTEC) (in red) during the last week at three locations:
a) in the northern part of Europe(N 61deg E 5deg)
b) above Brussels(N 50.5deg, E 4.5 deg)
c) in the southern part of Europe(N 36 deg, E 5deg)
This top figure also shows (in grey) the normal ionospheric behaviour expected based on the median VTEC from the 15 previous days.
The time series below shows the VTEC difference (in green) and relative difference (in blue) with respect to the median of the last 15 days in the North, Mid (above Brussels) and South of Europe. It thus illustrates the VTEC deviation from normal quiet behaviour.
The VTEC is expressed in TECu (with TECu=10^16 electrons per square meter) and is directly related to the signal propagation delay due to the ionosphere (in figure: delay on GPS L1 frequency).
The Sun's radiation ionizes the Earth's upper atmosphere, the ionosphere, located from about 60km to 1000km above the Earth's surface.The ionization process in the ionosphere produces ions and free electrons. These electrons perturb the propagation of the GNSS (Global Navigation Satellite System) signals by inducing a so-called ionospheric delay.
See http://stce.be/newsletter/GNSS_final.pdf for some more explanations; for more information, see https://gnss.be/SpaceWeather
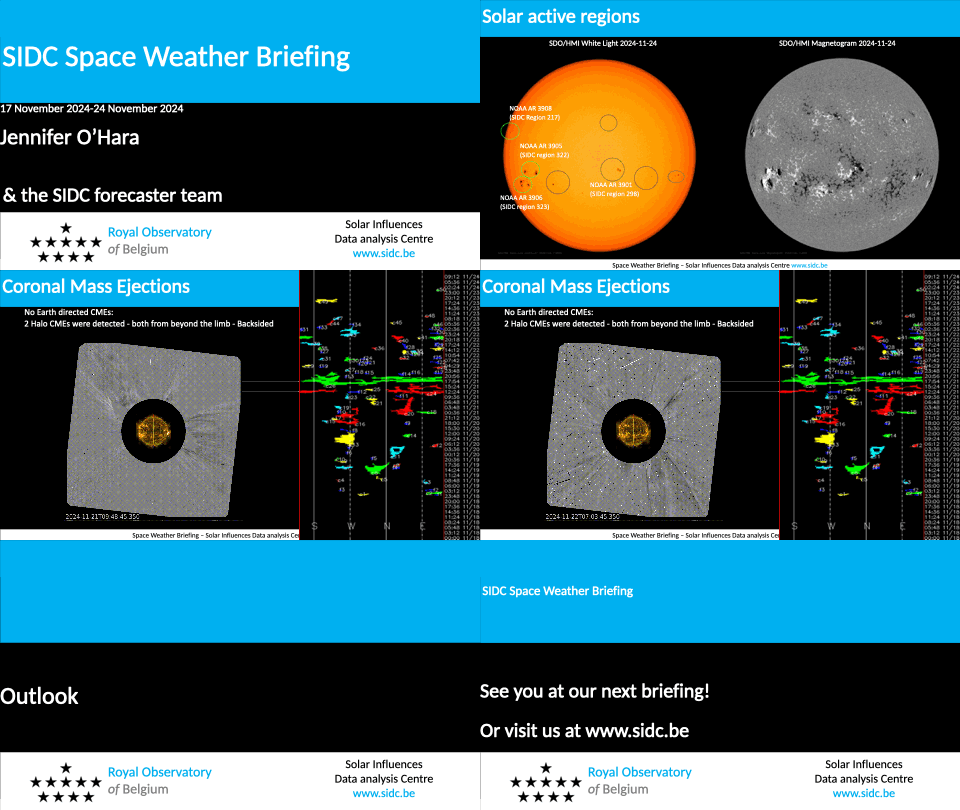
The SIDC Space Weather Briefing
The forecaster on duty presented the SIDC briefing that gives an overview of space weather from November 18 to 24.
The pdf of the presentation can be found here: https://www.stce.be/briefings/20241125_SWbriefing.pdf
Upcoming Activities
Courses, seminars and presentations with the Sun-Space-Earth system and Space Weather as the main theme. We provide occasions to get submerged in our world through educational, informative and instructive activities.
* Dec 5-6, 2024, STCE Course Space Weather impacts on aviation, online - full
* Jan 28-30, 2025, Role of the ionosphere and space weather in military communications, Brussels, Belgium - full - register for the waiting list: https://events.spacepole.be/event/208/
* Mar 17-18, 2025, Inleiding tot het ruimteweer, enkel voor leden van volkssterrenwachten, Brussels, Belgium - register: https://events.spacepole.be/event/213/
* Mar 24, 2025, STCE Lecture From Physics to Forecasting, ESA Academy's Space Weather Training Course
* April 28-30, 2025, STCE Space Weather Introductory Course, Brussels, Belgium - register: https://events.spacepole.be/event/214/
* May 26-27, 2025, STCE Course Space Weather impacts on aviation, online - register: https://events.spacepole.be/event/215/
* Jun 23-25, 2025, STCE Space Weather Introductory Course, Brussels, Belgium - register: https://events.spacepole.be/event/216/
* Sep 15-16, 2025, STCE Course Space Weather impacts on aviation, online - register: https://events.spacepole.be/event/218/
* Nov 17-19, 2025, STCE Space Weather Introductory Course, Brussels, Belgium - register: https://events.spacepole.be/event/217/
To register for a course and check the seminar details, navigate to the STCE Space Weather Education Center: https://www.stce.be/SWEC
If you want your event in the STCE newsletter, contact us: stce_coordination at stce.be

Website: https://www.stce.be/SWEC