- Table of Content
- 1.December 5, 11...
- 2.Review of spac...
- 3.The SIDC space...
- 4.Noticeable Sol...
- 5.International ...
- 6.Geomagnetic Ob...
- 7.PROBA2 Observa...
- 8.Review of Iono...
- 9.STCE courses a...
2. Review of space weather
3. The SIDC space weather briefing
4. Noticeable Solar Events
5. International Sunspot Number by SILSO
6. Geomagnetic Observations in Belgium
7. PROBA2 Observations (25 Nov 2024 - 1 Dec 2024)
8. Review of Ionospheric Activity
9. STCE courses and a competition
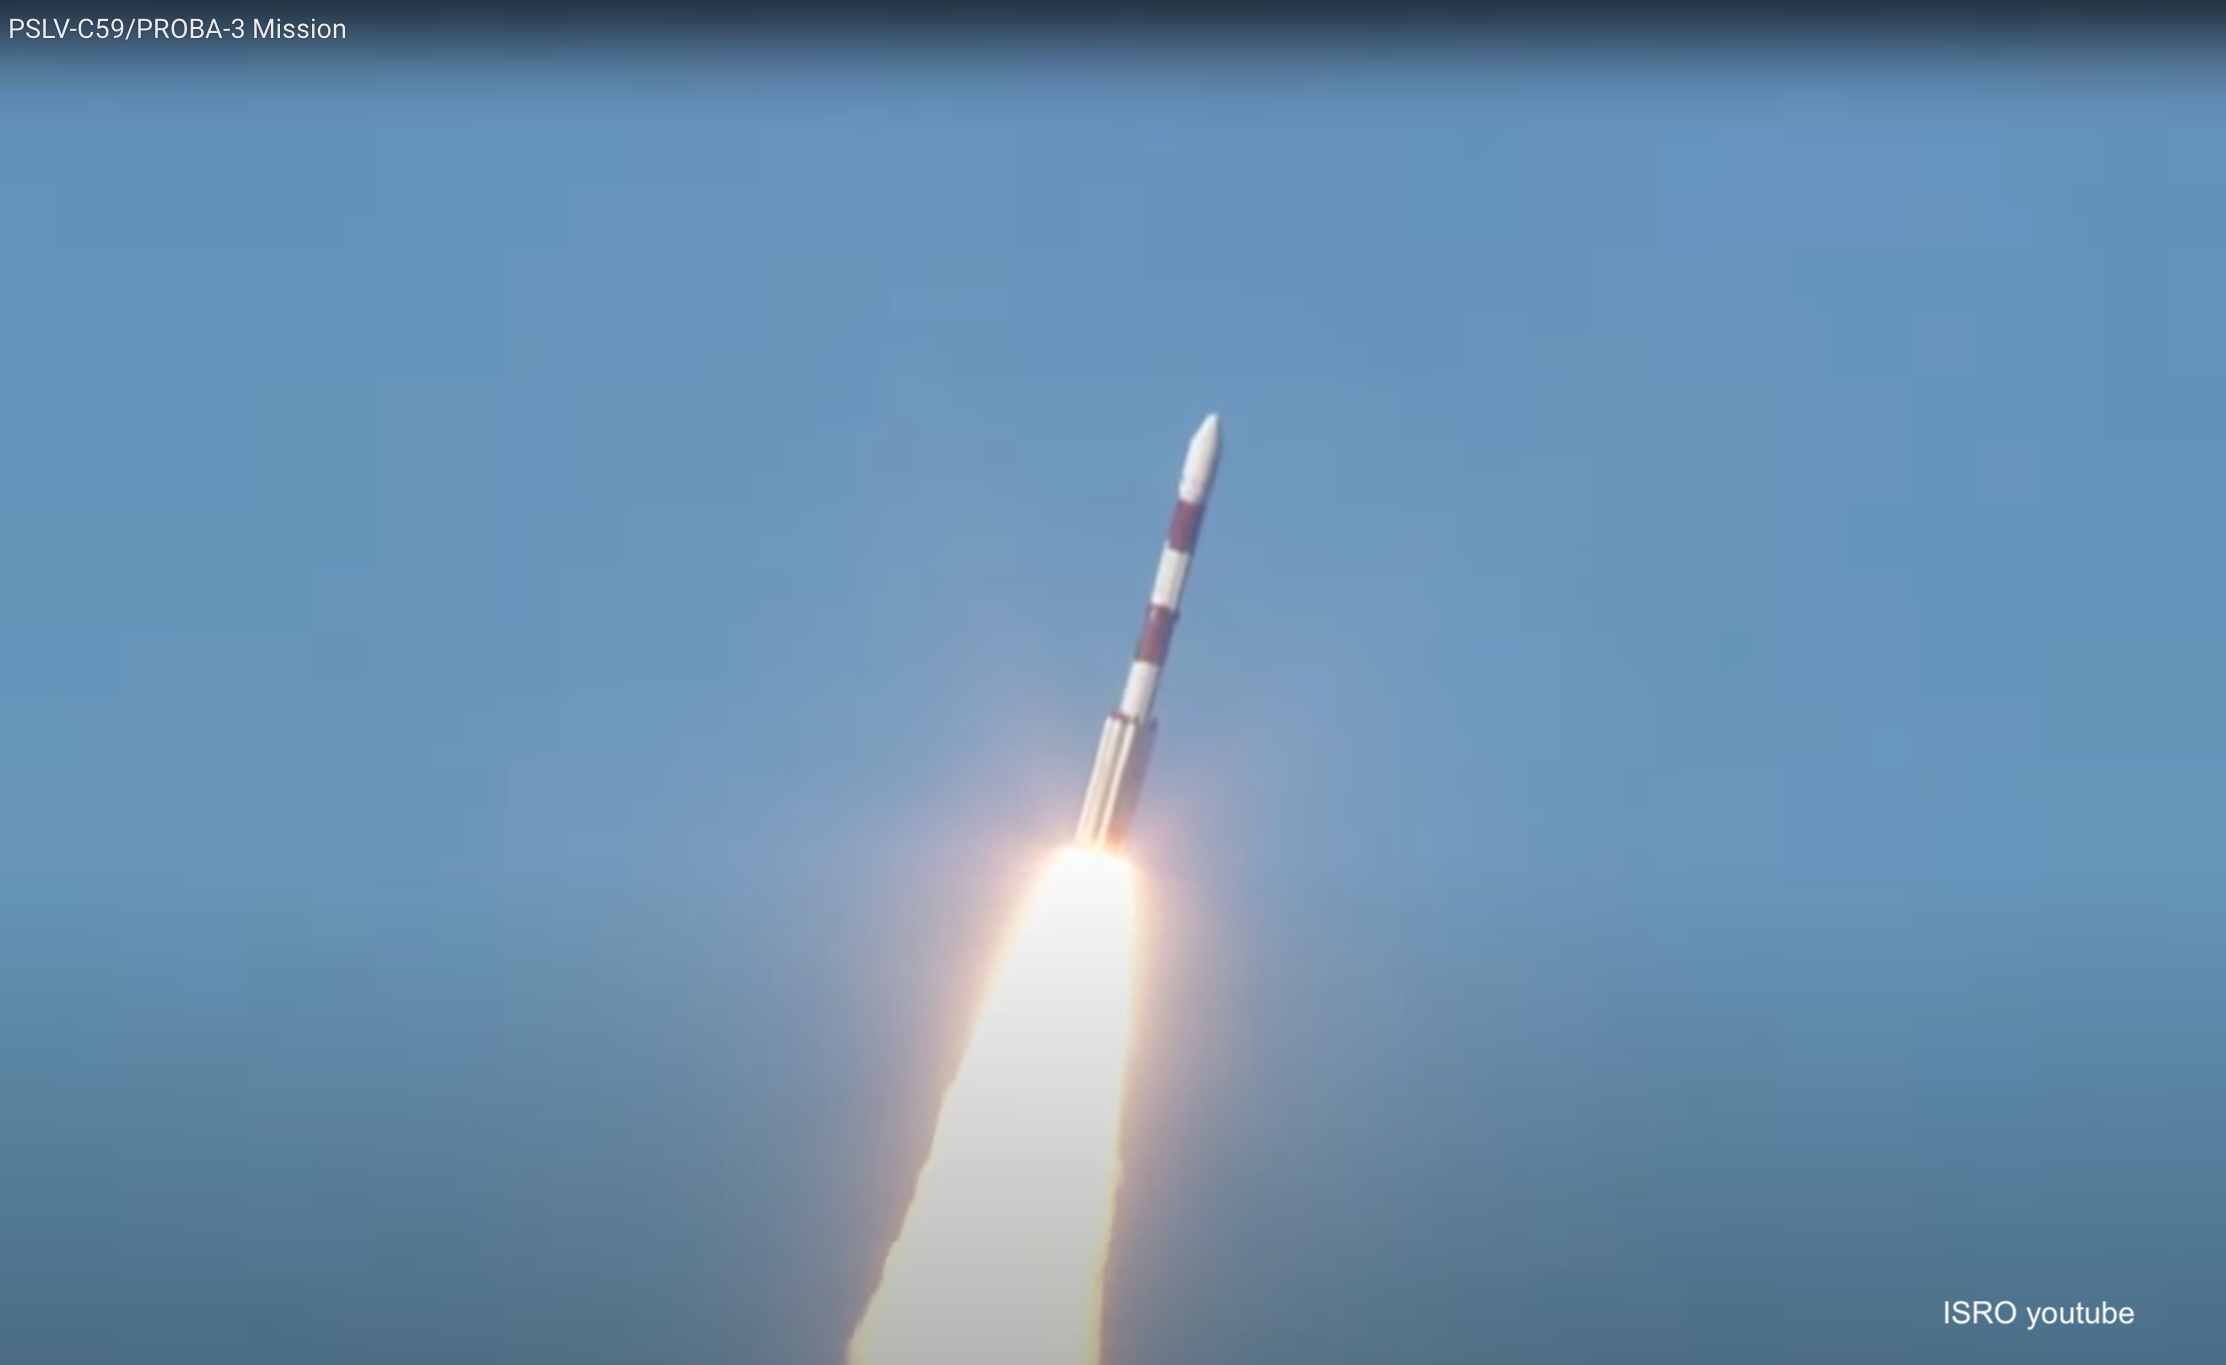
December 5, 11:34 CET: Successful Proba-3 launch
"Signal received"
After a smooth launch that was postponed by one day, operators and scientists waited to receive a first sign of life from the Proba-3 satellites.
The crucial beep
This was the confirmation that the separation of the stacked satellites from the launcher was successful and that the satellites were in the expected position.
What happens after launch?
The two Proba-3 satellites will travel to their space orbit stacked together. The conjoined satellites then need to come to life. Their respective solar panels will be oriented to the Sun to acquire sufficient power to wake up the onboard systems. Only once their joint commissioning is complete, the spacecraft will be separated and their individual commissioning will begin in a relatively safe orbit with respect to each other. Next is the first flight in precise formation which will finally result in scientific operations: ASPIICS will make sustained observations of the Sun’s otherwise invisible corona during an artificial total solar eclipse, created by the two satellites.
We expect the first images in March 2025.
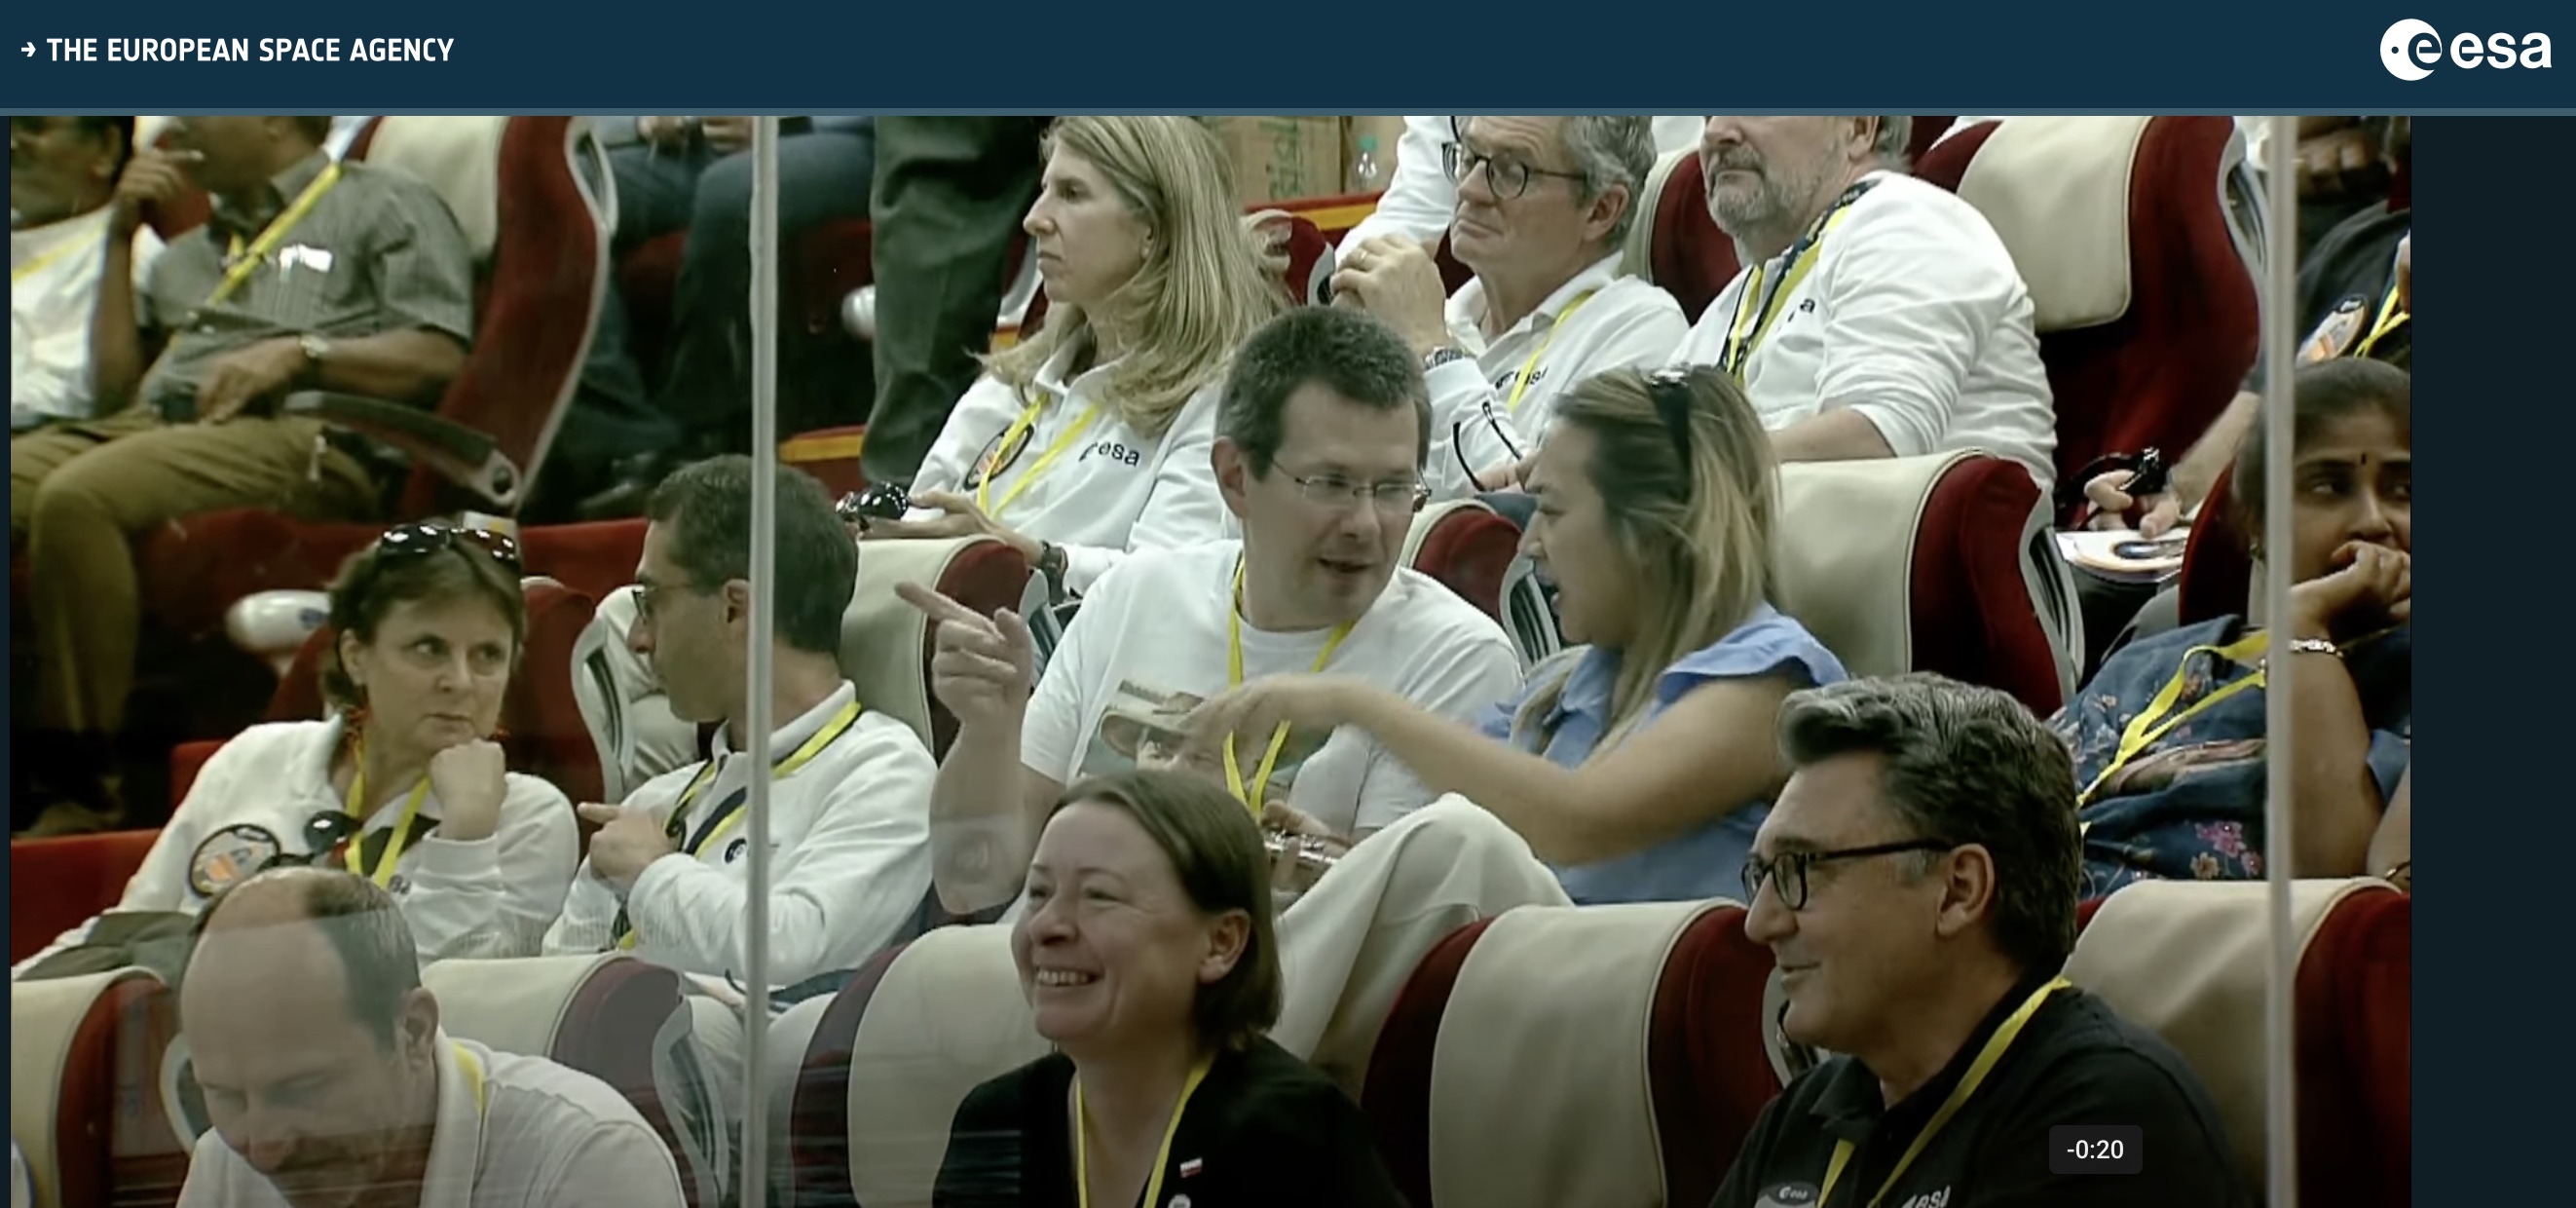
Andrei Zhukov, Principal Investigator of ASPIICS at the launch site in India, just before the launch.
ISRO broadcast of the launch: https://www.youtube.com/watch?v=PJXXLLw0PBI
Review of space weather
Solar Active Regions (ARs) and flares
The week started with high solar flaring activity as seven M-class flares were detected on 25 Nov. The brightest of those flares was an M9.4 registered at 07:42 UTC at the position E90N15 on the solar disk. The solar region responsible for this flare and an M1.5 at 17:07 UTC was later identified as SIDC Sunspot Group 302 (NOAA Active Region [AR] 3910). The rest of the M-class flaring activity was associated with the SIDC Sunspot Groups 298 (NOAA AR 2901), 322 (NOAA AR 3905), and 323 (NOAA AR 3906). Moderate flaring activity was observed again on 27 Nov, as an M1.0 flare was registered from the location of SIDC sunspot group 298.
For the rest of the week only C-class flares were observed.
Coronal mass ejections
A Coronal Mass Ejection (CME) was registered in LASCO-C2/SOHO images on 25 Nov. It arrived at the Earth's atmosphere on 29 Nov.
Coronal Holes
A very small equatorial corona hole with positive polarity crossed the solar central meridian on 28 Nov.
Proton flux levels
The greater than 10 MeV proton flux, as measured by the GOES-18 satellite, was at nominal levels throughout the week.
Electron fluxes at GEO
The greater than 2 MeV electron flux as measured by GOES-18 was below the 1000 pfu threshold and the 24h electron fluence was at nominal levels throughout the week.
Solar wind at L1
The Solar Wind (SW) was slow. Its speed was below 500 km/s, the total interplanetary magnetic field (Bt) went up to 17 nT, and the North-South magnetic component (Bz) ranged between -10 and 14 nT. The interplanetary magnetic field phi angle was mostly directed away from the Sun.
The highest (and the lowest Bz) of those physical quantities were measured during the arrival of a Coronal Mass Ejection (CME) on 29 Nov at 17:00 UTC that lasted until 30 Nov 05:30 UTC.
Geomagnetism
The global and local geomagnetic conditions were generally quiet during the past week. The only noticeable exception was the minor storm (NOAA Kp 5-) registered globally on 30 Nov from 00:00 to 03:00 UTC. The local conditions of the same day only registered active levels (K BEL 4).
The SIDC space weather briefing
The forecaster on duty presented the SIDC briefing that gives an overview of space weather from Nov 24 to Dec 1 .
The pdf of the presentation can be found here: https://www.stce.be/briefings/20241202_SWbriefing.pdf
Noticeable Solar Events
| DAY | BEGIN | MAX | END | LOC | XRAY | OP | 10CM | TYPE | Cat | NOAA |
| 25 | 0139 | 0159 | 0211 | M1.1 | 15 | 3906 | ||||
| 25 | 0439 | 0453 | 0459 | M1.8 | 15 | 3906 | ||||
| 25 | 0724 | 0742 | 0803 | M9.4 | III/1 | |||||
| 25 | 1201 | 1212 | 1217 | S12E40 | M2.0 | SF | VI/1 | 14 | 3905 | |
| 25 | 1607 | 1636 | 1658 | M1.0 | 15 | 3906 | ||||
| 25 | 1658 | 1707 | 1716 | M1.5 | 3910 | |||||
| 25 | 2024 | 2054 | 2123 | S9W25 | M1.9 | 2F | VI/2 | 3 | 3901 | |
| 27 | 1227 | 1246 | 1249 | M1.0 | 3 | 3901 |
| LOC: approximate heliographic location | TYPE: radio burst type |
| XRAY: X-ray flare class | Cat: Catania sunspot group number |
| OP: optical flare class | NOAA: NOAA active region number |
| 10CM: peak 10 cm radio flux |
International Sunspot Number by SILSO

The daily Estimated International Sunspot Number (EISN, red curve with shaded error) derived by a simplified method from real-time data from the worldwide SILSO network. It extends the official Sunspot Number from the full processing of the preceding month (green line), a few days more than one solar rotation. The horizontal blue line shows the current monthly average. The yellow dots give the number of stations that provided valid data. Valid data are used to calculate the EISN. The triangle gives the number of stations providing data. When a triangle and a yellow dot coincide, it means that all the data is used to calculate the EISN of that day.
Geomagnetic Observations in Belgium

Local K-type magnetic activity index for Belgium based on data from Dourbes (DOU) and Manhay (MAB). Comparing the data from both measurement stations allows to reliably remove outliers from the magnetic data. At the same time the operational service availability is improved: whenever data from one observatory is not available, the single-station index obtained from the other can be used as a fallback system.
Both the two-station index and the single station indices are available here: http://ionosphere.meteo.be/geomagnetism/K_BEL/
PROBA2 Observations (25 Nov 2024 - 1 Dec 2024)
Solar Activity
Solar flare activity fluctuated from low to moderate during the week.
In order to view the activity of this week in more detail, we suggest to go to the following website from which all the daily (normal and difference) movies can be accessed: https://proba2.oma.be/ssa
This page also lists the recorded flaring events.
A weekly overview movie (SWAP week 766) can be found here: https://proba2.sidc.be/swap/data/mpg/movies/weekly_movies/weekly_movie_2024_11_25.mp4.
Details about some of this week's events can be found further below.
If any of the linked movies are unavailable they can be found in the P2SC movie repository here: https://proba2.oma.be/swap/data/mpg/movies/.
Monday November 25
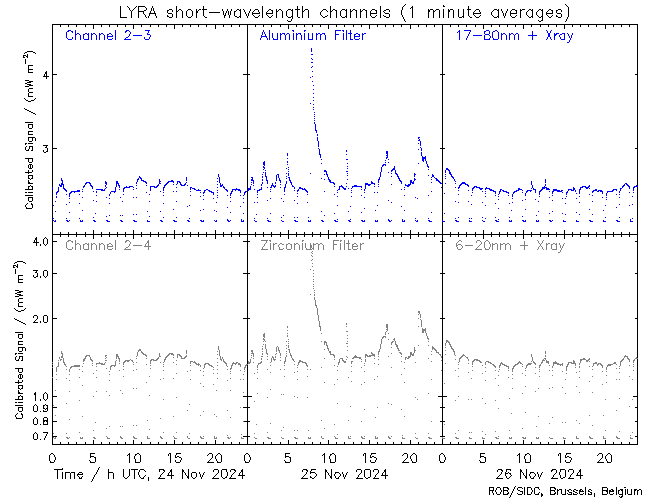
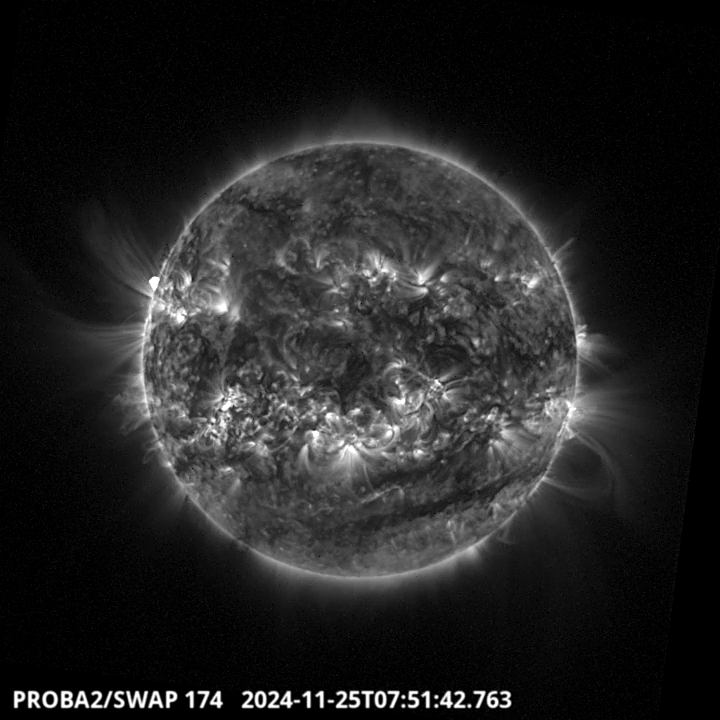
The largest flare of this week was an M9.4, and it was observed by LYRA (top panel) and SWAP (bottom panel). However, the increasing part was missed due to an occultation. The flare peaked on 2024-Nov-25 at 07:42 UT. It originated from an active region that was just behind the north-eastern limb, but the post-eruptive arcades can be seen for several hours after the event.
Find a SWAP movie of the event here: https://proba2.sidc.be/swap/movies/20241125_swap_movie.mp4.
Review of Ionospheric Activity


VTEC time series at 3 locations in Europe from 25 Nov 2024 till 1 Dec 2024
The top figure shows the time evolution of the Vertical Total Electron Content (VTEC) (in red) during the last week at three locations:
a) in the northern part of Europe(N 61deg E 5deg)
b) above Brussels(N 50.5deg, E 4.5 deg)
c) in the southern part of Europe(N 36 deg, E 5deg)
This top figure also shows (in grey) the normal ionospheric behaviour expected based on the median VTEC from the 15 previous days.
The time series below shows the VTEC difference (in green) and relative difference (in blue) with respect to the median of the last 15 days in the North, Mid (above Brussels) and South of Europe. It thus illustrates the VTEC deviation from normal quiet behaviour.
The VTEC is expressed in TECu (with TECu=10^16 electrons per square meter) and is directly related to the signal propagation delay due to the ionosphere (in figure: delay on GPS L1 frequency).
The Sun's radiation ionizes the Earth's upper atmosphere, the ionosphere, located from about 60km to 1000km above the Earth's surface.The ionization process in the ionosphere produces ions and free electrons. These electrons perturb the propagation of the GNSS (Global Navigation Satellite System) signals by inducing a so-called ionospheric delay.
See http://stce.be/newsletter/GNSS_final.pdf for some more explanations; for more information, see https://gnss.be/SpaceWeather
STCE courses and a competition
Courses, seminars and presentations with the Sun-Space-Earth system and Space Weather as the main theme. We provide occasions to get submerged in our world through educational, informative and instructive activities.
* Dec 5-6, 2024, STCE Course Space Weather impacts on aviation, online - full
* Dec 16, 17:00 CET, deadline for the European Space Weather Week Banner and Poster Competition: https://esww.eu/calls/banner-and-poster-competition
* Jan 28-30, 2025, Role of the ionosphere and space weather in military communications, Brussels, Belgium - full - register for the waiting list: https://events.spacepole.be/event/208/
* Mar 17-18, 2025, Inleiding tot het ruimteweer, enkel voor leden van volkssterrenwachten, Brussels, Belgium - register: https://events.spacepole.be/event/213/
* Mar 24, 2025, STCE Lecture From Physics to Forecasting, ESA Academy's Space Weather Training Course
* April 28-30, 2025, STCE Space Weather Introductory Course, Brussels, Belgium - register: https://events.spacepole.be/event/214/
* May 26-27, 2025, STCE Course Space Weather impacts on aviation, online - register: https://events.spacepole.be/event/215/
* Jun 23-25, 2025, STCE Space Weather Introductory Course, Brussels, Belgium - register: https://events.spacepole.be/event/216/
* Sep 15-16, 2025, STCE Course Space Weather impacts on aviation, online - register: https://events.spacepole.be/event/218/
* Nov 17-19, 2025, STCE Space Weather Introductory Course, Brussels, Belgium - register: https://events.spacepole.be/event/217/
To register for a course and check the seminar details, navigate to the STCE Space Weather Education Center: https://www.stce.be/SWEC
If you want your event in the STCE newsletter, contact us: stce_coordination at stce.be

Website: https://www.stce.be/SWEC