- Table of Content
- 1.X2 flare
- 2.Review of sola...
- 3.International ...
- 4.PROBA2 Observa...
- 5.Noticeable Sol...
- 6.Geomagnetic Ob...
- 7.Review of Iono...
- 8.The SIDC Space...
- 9.Upcoming Activ...
2. Review of solar and geomagnetic activity
3. International Sunspot Number by SILSO
4. PROBA2 Observations
5. Noticeable Solar Events
6. Geomagnetic Observations in Belgium
7. Review of Ionospheric Activity
8. The SIDC Space Weather Briefing
9. Upcoming Activities
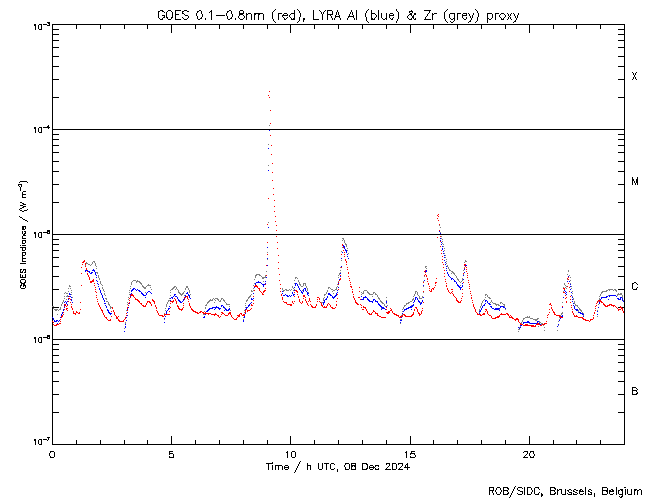
X2 flare
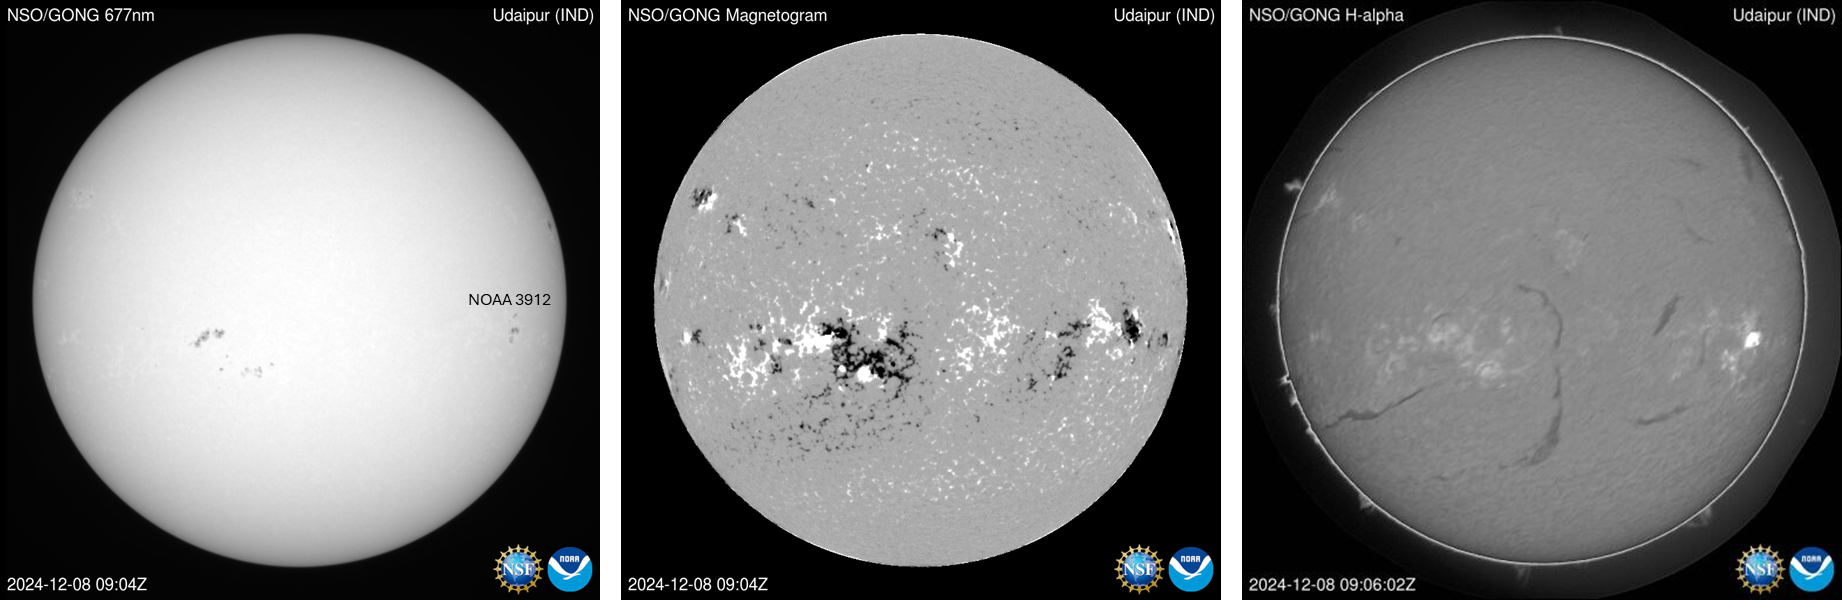
NOAA 3912 was the source of an X2.2 flare that took place on 8 December, peaking at 09:06UTC (GOES - https://www.swpc.noaa.gov/products/goes-x-ray-flux ). The region was not particularly large, as can be seen in the GONG white light image (https://gong2.nso.edu/products/mainView/table.php?configFile=configs/mainView.cfg ) underneath left taken around the time of the flare's maximum. The middle image shows the magnetic polarity of the regions, indicating some magnetic complexity for the source region. The image on the right shows the flare in H-alpha, a line in the red portion of the solar spectrum, at the time of the flare's maximum. The bright feature is the flare and it corresponds with the location of NOAA 3912.
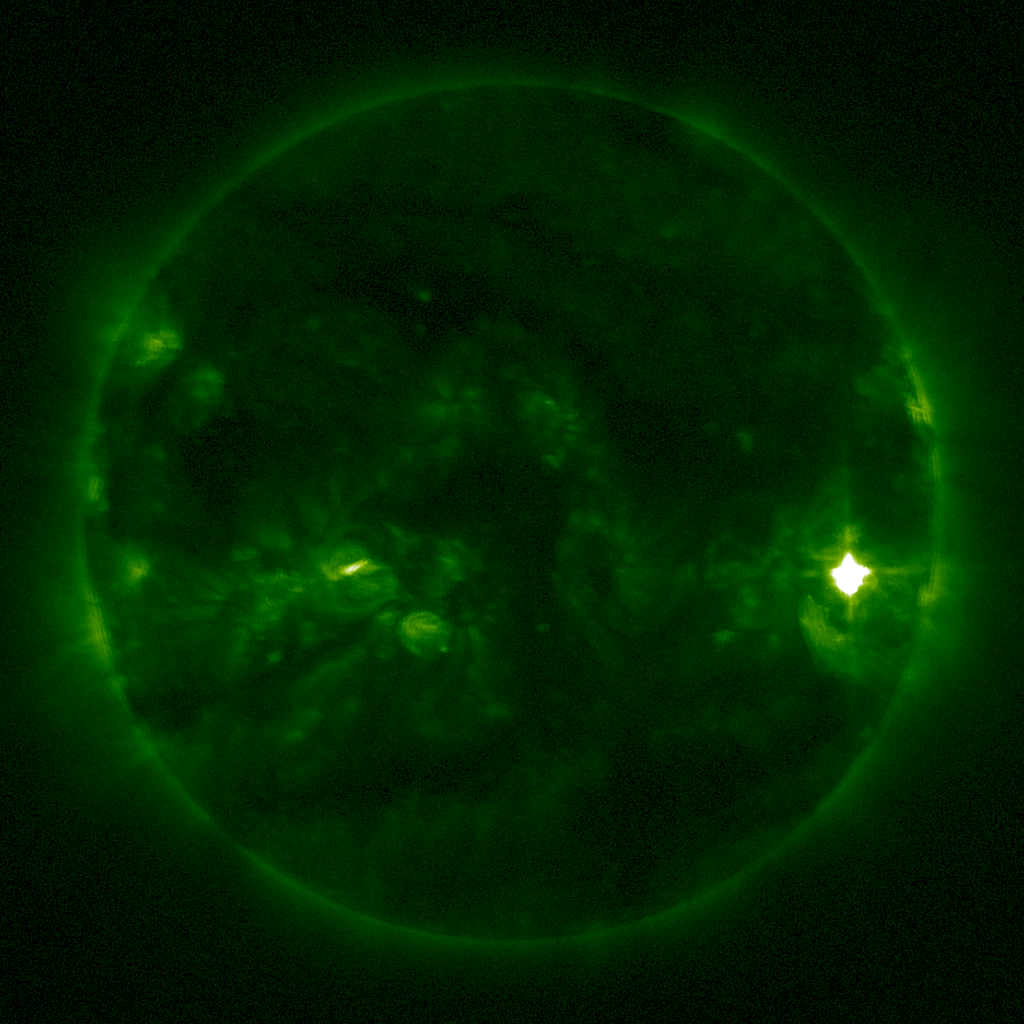
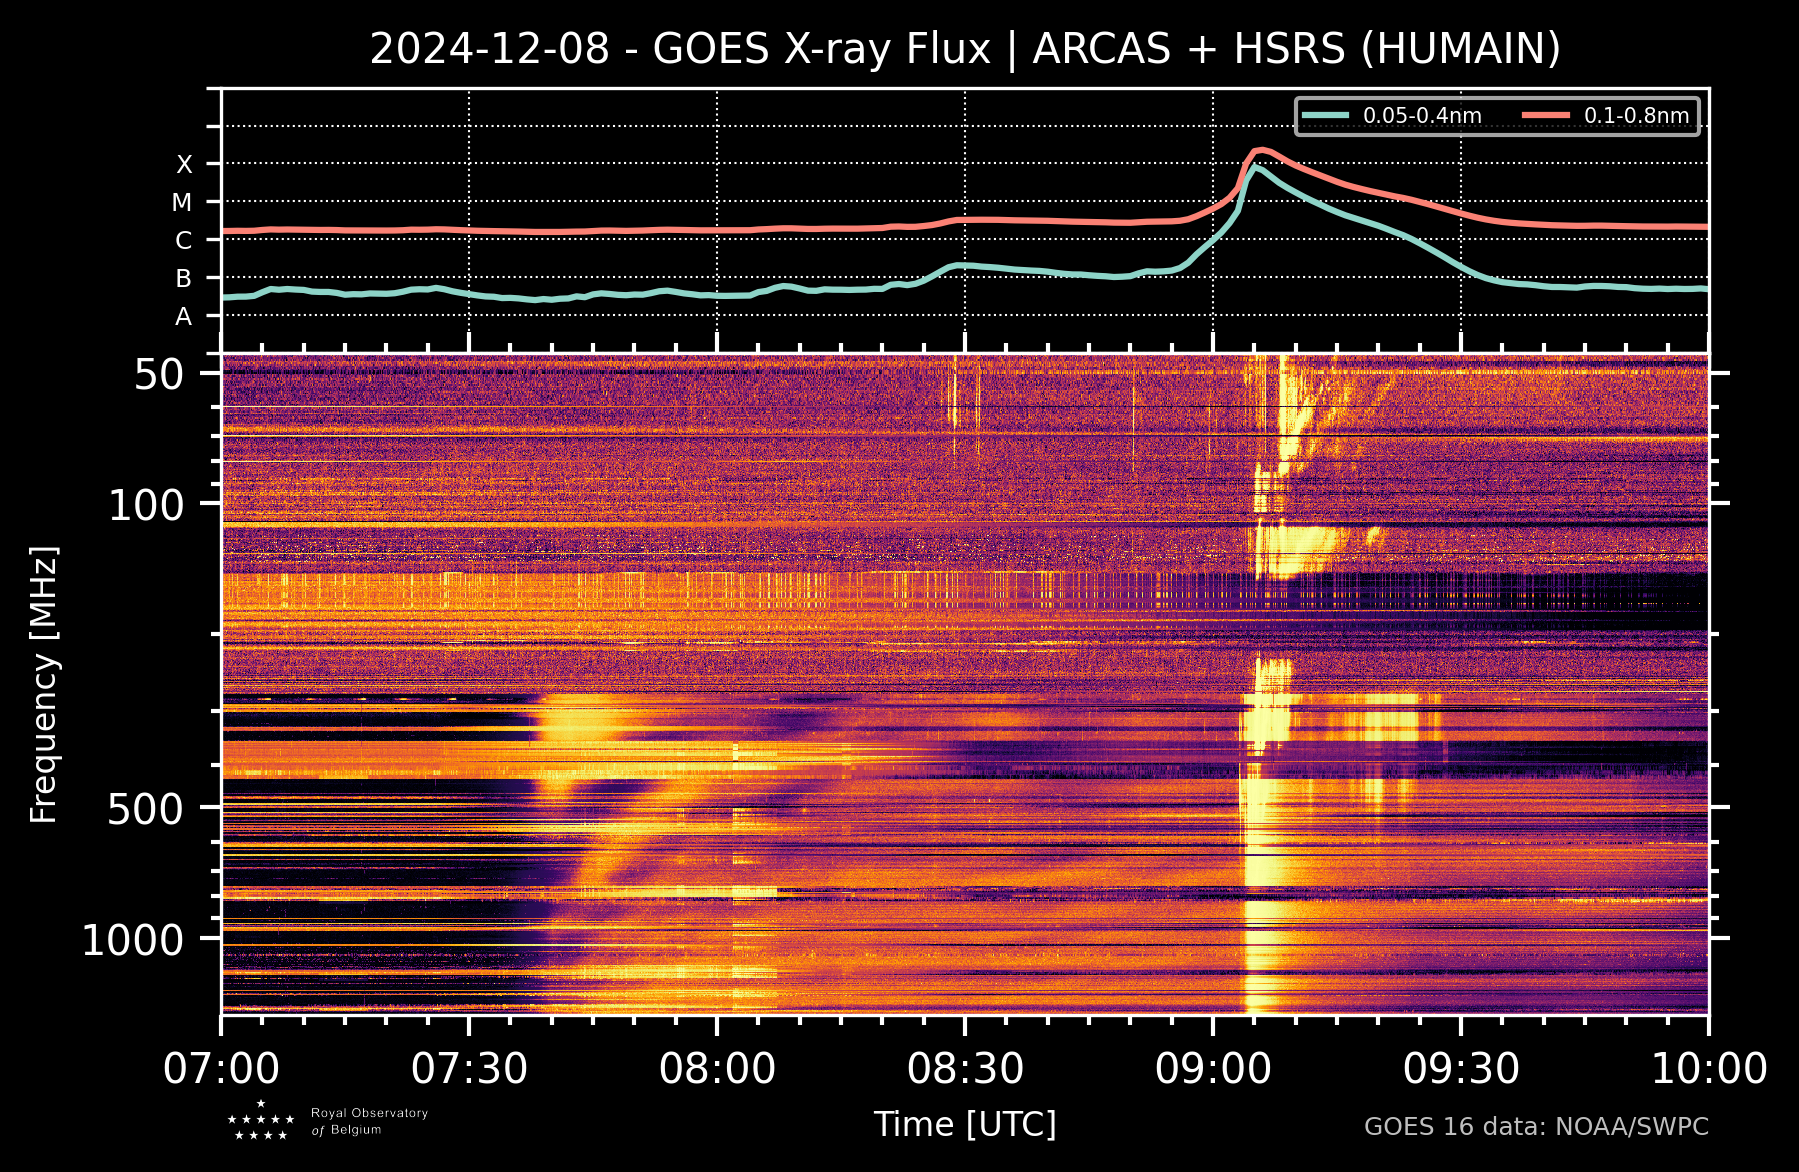
The imagery above shows the flare in extreme ultraviolet (EUV), as recorded by the GOES/SUVI instrument (https://www.swpc.noaa.gov/products/goes-solar-ultraviolet-imager-suvi ). It was associated with a Type II radio burst (see STCE SWx Classification page - https://www.stce.be/educational/classification#radio ), which was also observed by the Humain Radioastronomy Station (https://www.sidc.be/humain/home ) in Belgium, as can be seen in the spectrogram underneath. The horizontal axis represents time increasing from left to right and the vertical axis represents frequency (in MHz) decreasing upward to represent the decreasing density with increasing altitude in the solar atmosphere. The evolution of the solar soft-x-ray flux (GOES) is displayed on top of the spectrogram. A coronal mass ejection (CME) was indeed visible in the SOHO/LASCO coronagraphic imagery starting at 09:24UTC, but not very wide and directed primarily to the west. The CME is not thought to have an earth-directed component (SIDC - https://www.sidc.be/index.php ).
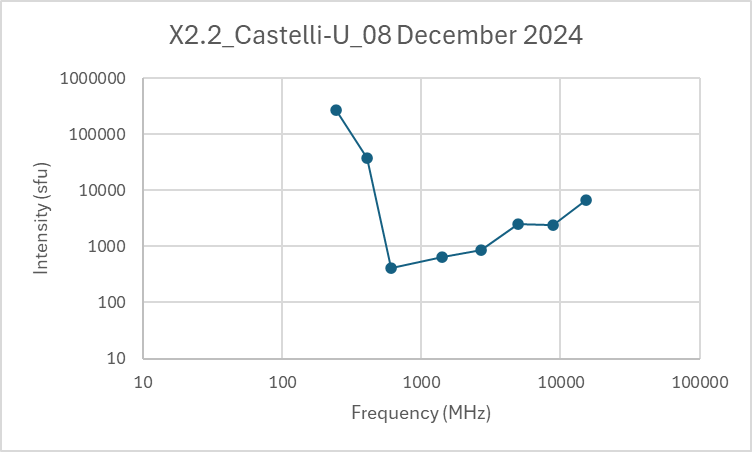
Further radio observations revealed that this was a CASTELLI-U burst (or U-burst for short). It was named after John Castelli, a military in the USAF (United States Air Force) who worked extensively in the radar and radio domain during World War II and in the 1950-70’s. This "Castelli-U spectral burst" is characterized by a U-shape in a graph depicting the intensity of the burst vs. the observed radio frequencies, i.e. the highest intensities are usually found at frequencies below +/- 1000 MHz and above a few thousand MHz, and a dip in-between (Castelli et al. 1967 ; Castelli et al., 1977). This can be seen in the graph underneath for the 8 December eruption, based on data from the NOAA/USAF network. The feature requires a specific set of conditions, usually only satisfied with strong flares (see e.g. Chertok et al. 2009 ; Grechnev et al. 2008). Details, conditions, and further explanations can be found at https://www.spaceacademy.net.au/env/sol/solradp/solradp.htm (at the bottom of the page). Castelli-U bursts were used for predictions of proton events (See https://www.spaceacademy.net.au/spacelab/models/ppm.htm ; Kiselev et al. 2022), but even today -especially when associated with important Type II and Type IV radio bursts- it is sometimes considered as an indication of a pending proton event. Alas, no proton event or enhancement was associated with the X2.2 flare on 8 December. Nowadays, it is also useful in the sense that a U-burst often means that GNSS frequencies (1.1-1.6 GHz ; Global Navigation Satellite Systems such as GPS and Galileo) were amongst the least affected by the eruption, compared to the lower and higher frequencies. Of note is that for this event, the intensity at 245 MHz reached 270.000 sfu. This is not a record-breaking value, but still important enough that it may have impacted some radar or communication applications for a short while. Clips and links can be found in the online version of this article at https://www.stce.be/news/740/welcome.html
Review of solar and geomagnetic activity
WEEK 1249 from 2024 Dec 02
Solar Active Regions and flares
Solar flaring activity was at low levels at the start of the week. It increased to moderate levels on December 4, remained moderate for most of the week, and reached high levels on December 8. There were 14 active regions (ARs) visible throughout the week. A total of 81 C-class flares, 10 M-class flares and 1 X-class flare were recorded. Throughout the week, most of the flaring activity was produced by SIDC Sunspot Group 323 (NOAA Active Region 3906), SIDC Sunspot Group 305 (NOAA Active Region 3912), SIDC Sunspot Group 330 (NOAA Active Region 3916), and SIDC Sunspot Group 288 (NOAA Active Region 3917). The largest flare was an X2.2 flare (SIDC Flare 2856), peaking at 09:06 UTC on December 8, associated with SIDC Sunspot Group 305. Type II radio emissions were detected at 09:05 UTC on December 8 during the flaring activity.
Coronal mass ejections
No Earth-directed Coronal Mass Ejections (CMEs) were detected in the available coronagraph imagery over the past week.
Coronal Holes
Two positive polarity coronal holes, one in the southern hemisphere and one in the northern hemisphere, began to transit the central meridian on December 4 and December 6, respectively.
Proton flux levels
The greater than 10 MeV proton flux, as recorded by GOES-18, was below the 10 pfu threshold during the last week.
Electron fluxes at GEO
The greater than 2 MeV electron flux, as measured by GOES 16 and GOES 18, was below the 1000 pfu threshold during the last week. The electron fluence was at normal levels throughout the entire week.
Solar wind
The solar wind parameters reflected slow solar wind conditions at the beginning of the week. The solar wind parameters became slightly disturbed on December 2, likely due to the arrival of an ICME related to the partial halo CME first detected in LASCO/C2 data around 19:24 UTC on November 27. The interplanetary magnetic field reached values up to 14 nT, and the solar wind speed increased from around 350 km/s to 500 km/s. After returning to slow solar wind conditions, the solar wind parameters became slightly disturbed again around 21:15 UTC on December 7, with the interplanetary magnetic field reaching up to 11 nT. This disturbance was likely due to the mild influence of a high-speed stream (HSS) from a positive polarity coronal hole that began crossing the central meridian on December 4.
Geomagnetism
Geomagnetic conditions over the past week were mostly quiet to unsettled. Active conditions were recorded globally between 00:00 and 03:00 UTC on December 3 (NOAA Kp: 4-) and locally over Belgium between 18:00 and 22:00 UTC on the same day (K-BEL: 4).
International Sunspot Number by SILSO
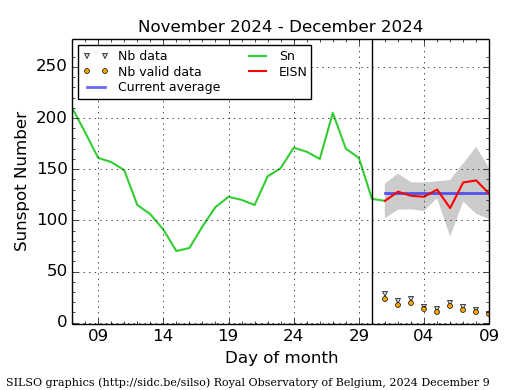
The daily Estimated International Sunspot Number (EISN, red curve with shaded error) derived by a simplified method from real-time data from the worldwide SILSO network. It extends the official Sunspot Number from the full processing of the preceding month (green line), a few days more than one solar rotation. The horizontal blue line shows the current monthly average. The yellow dots give the number of stations that provided valid data. Valid data are used to calculate the EISN. The triangle gives the number of stations providing data. When a triangle and a yellow dot coincide, it means that all the data is used to calculate the EISN of that day.
PROBA2 Observations
Solar Activity
Solar flare activity fluctuated from low to high during the week.
In order to view the activity of this week in more detail, we suggest to go to the following website from which all the daily (normal and difference) movies can be accessed: https://proba2.oma.be/ssa
This page also lists the recorded flaring events.
A weekly overview movie (SWAP week 767) can be found here: https://proba2.sidc.be/swap/data/mpg/movies/weekly_movies/weekly_movie_2024_12_02.mp4.
Details about some of this week's events can be found further below.
If any of the linked movies are unavailable they can be found in the P2SC movie repository here: https://proba2.oma.be/swap/data/mpg/movies/.
Sunday December 08
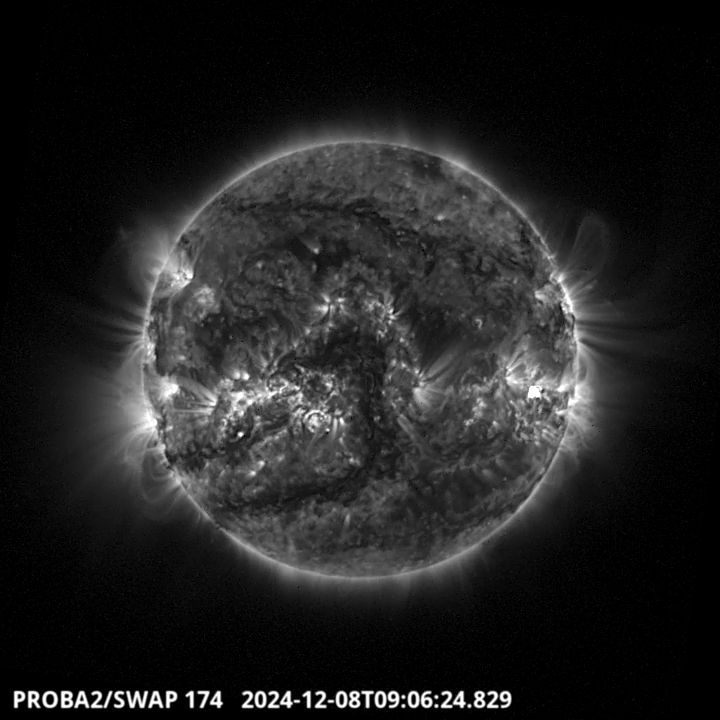
The largest flare of this week was an X2.2, and it was observed by LYRA (top panel) and SWAP (bottom panel). The flare peaked on 2024-Dec-08 at 09:06 UT. It occurred close to the equator in the western hemisphere, originating from active region NOAA3912.
Find a SWAP movie of the event here: https://proba2.sidc.be/swap/movies/20241208_swap_movie.mp4.
Noticeable Solar Events
| DAY | BEGIN | MAX | END | LOC | XRAY | OP | 10CM | TYPE | Cat | NOAA |
| 04 | 0952 | 1000 | 1008 | M2.3 | II/2 | |||||
| 04 | 2031 | 2046 | 2057 | S15E58 | M1.3 | SN | 30 | 3916 | ||
| 04 | 2057 | 2105 | 2112 | M1.4 | 3917 | |||||
| 05 | 0656 | 0709 | 0733 | S7E66 | M1.0 | SF | 33 | 3917 | ||
| 05 | 0812 | 0820 | 0824 | M1.1 | VI/1III/1 | 15 | 3906 | |||
| 05 | 1032 | 1040 | 1046 | M2.5 | III/3II/2 | 15 | 3906 | |||
| 06 | 0906 | 0920 | 0942 | S8E47 | M1.2 | SF | VI/1 | 33 | 3917 | |
| 07 | 1300 | 1308 | 1315 | S8E33 | M2.3 | SF | 33 | 3917 | ||
| 07 | 2153 | 2215 | 2226 | S8E28 | M3.2 | SN | 33 | 3917 | ||
| 08 | 0850 | 0906 | 0910 | S8W54 | X2.2 | 2B | II/3 | 25 | 3912 | |
| 08 | 1600 | 1611 | 1618 | S9W58 | M1.5 | 1N | III/2 | 25 | 3912 |
| LOC: approximate heliographic location | TYPE: radio burst type |
| XRAY: X-ray flare class | Cat: Catania sunspot group number |
| OP: optical flare class | NOAA: NOAA active region number |
| 10CM: peak 10 cm radio flux |
Geomagnetic Observations in Belgium
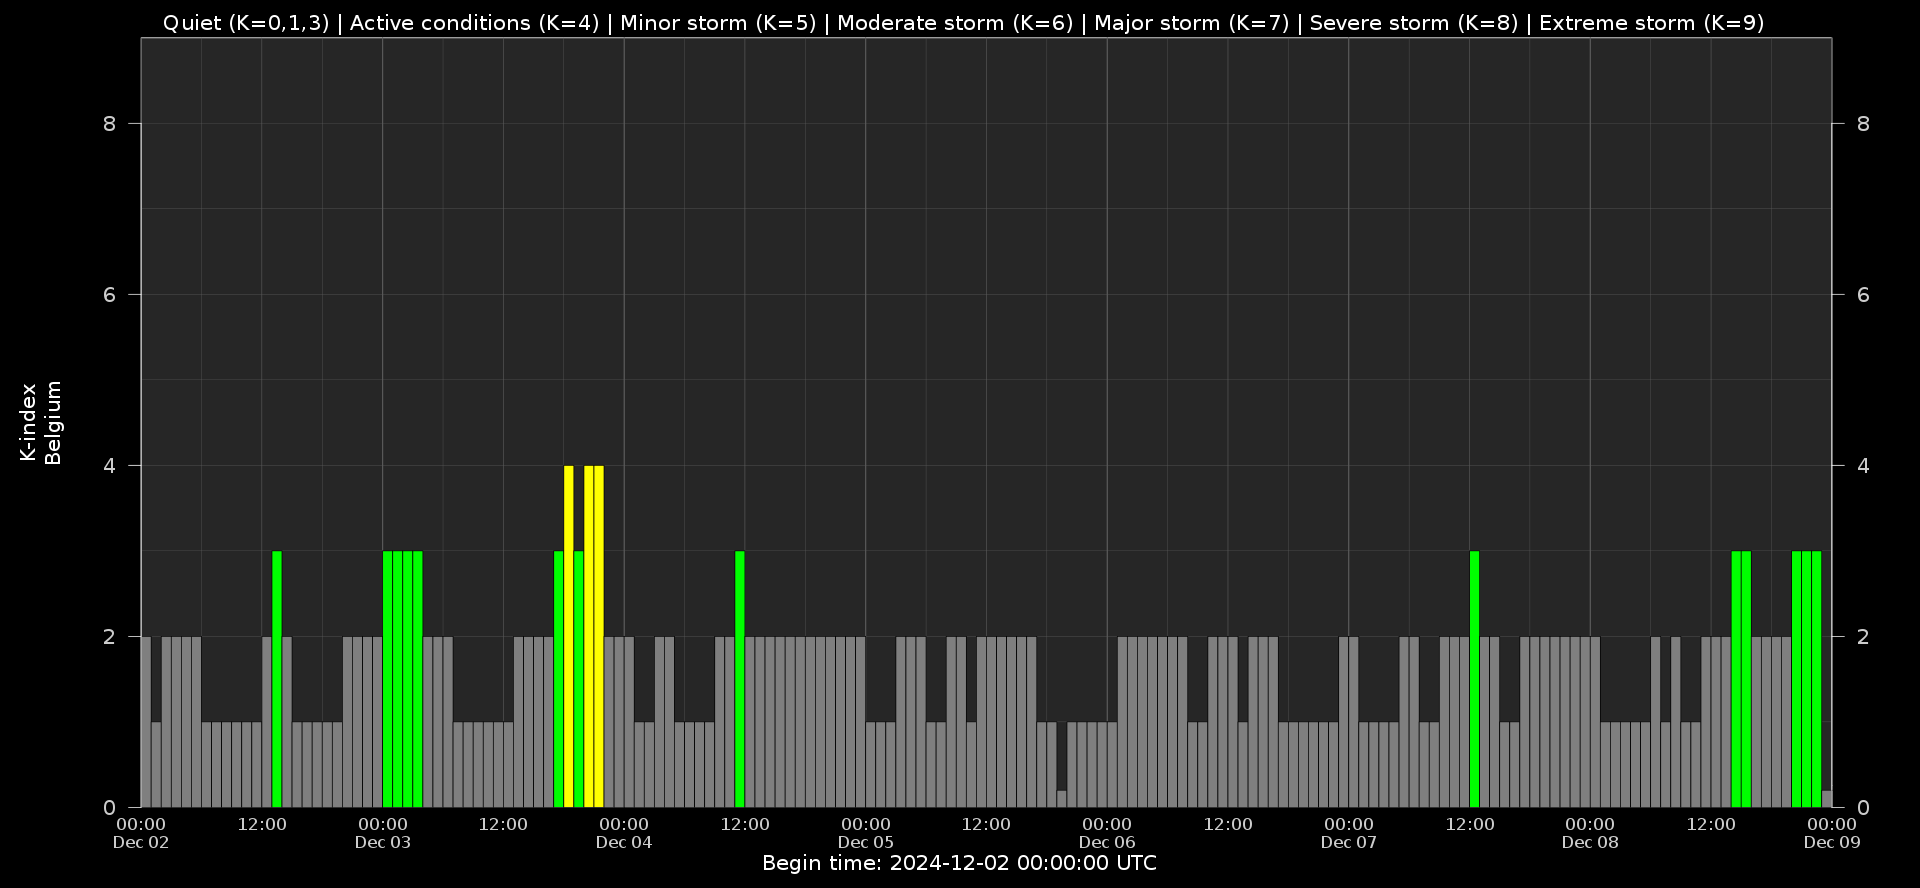
Local K-type magnetic activity index for Belgium based on data from Dourbes (DOU) and Manhay (MAB). Comparing the data from both measurement stations allows to reliably remove outliers from the magnetic data. At the same time the operational service availability is improved: whenever data from one observatory is not available, the single-station index obtained from the other can be used as a fallback system.
Both the two-station index and the single station indices are available here: http://ionosphere.meteo.be/geomagnetism/K_BEL/
Review of Ionospheric Activity
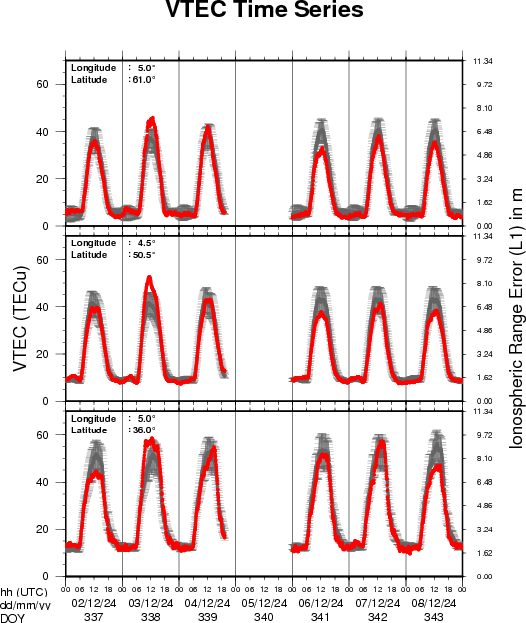
VTEC time series at 3 locations in Europe from 2 Dec 2024 till 8 Dec 2024
The top figure shows the time evolution of the Vertical Total Electron Content (VTEC) (in red) during the last week at three locations:
a) in the northern part of Europe(N 61deg E 5deg)
b) above Brussels(N 50.5deg, E 4.5 deg)
c) in the southern part of Europe(N 36 deg, E 5deg)
This top figure also shows (in grey) the normal ionospheric behaviour expected based on the median VTEC from the 15 previous days.
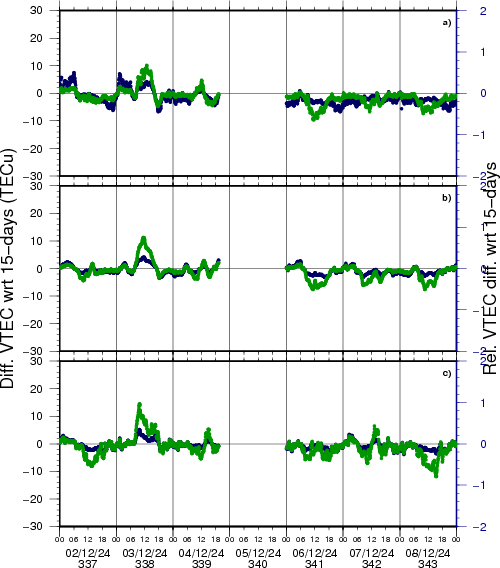
The time series below shows the VTEC difference (in green) and relative difference (in blue) with respect to the median of the last 15 days in the North, Mid (above Brussels) and South of Europe. It thus illustrates the VTEC deviation from normal quiet behaviour.
The VTEC is expressed in TECu (with TECu=10^16 electrons per square meter) and is directly related to the signal propagation delay due to the ionosphere (in figure: delay on GPS L1 frequency).
The Sun's radiation ionizes the Earth's upper atmosphere, the ionosphere, located from about 60km to 1000km above the Earth's surface.The ionization process in the ionosphere produces ions and free electrons. These electrons perturb the propagation of the GNSS (Global Navigation Satellite System) signals by inducing a so-called ionospheric delay.
See http://stce.be/newsletter/GNSS_final.pdf for some more explanations; for more information, see https://gnss.be/SpaceWeather
The SIDC Space Weather Briefing
The forecaster on duty presented the SIDC briefing that gives an overview of space weather from December 2 to 8.
The pdf of the presentation can be found here: https://www.stce.be/briefings/20241209_SWbriefing.pdf
Upcoming Activities
Courses, seminars and presentations with the Sun-Space-Earth system and Space Weather as the main theme. We provide occasions to get submerged in our world through educational, informative and instructive activities.
* Dec 16, 17:00 CET, deadline for the European Space Weather Week Banner and Poster Competition: https://esww.eu/calls/banner-and-poster-competition
* Jan 28-30, 2025, Role of the ionosphere and space weather in military communications, Brussels, Belgium - full - register for the waiting list: https://events.spacepole.be/event/208/
* Mar 17-18, 2025, Inleiding tot het ruimteweer, enkel voor leden van volkssterrenwachten, Brussels, Belgium - register: https://events.spacepole.be/event/213/
* Mar 24, 2025, STCE Lecture From Physics to Forecasting, ESA Academy's Space Weather Training Course
* April 28-30, 2025, STCE Space Weather Introductory Course, Brussels, Belgium - register: https://events.spacepole.be/event/214/
* May 26-27, 2025, STCE Course Space Weather impacts on aviation, online - register: https://events.spacepole.be/event/215/
* Jun 23-25, 2025, STCE Space Weather Introductory Course, Brussels, Belgium - register: https://events.spacepole.be/event/216/
* Sep 15-16, 2025, STCE Course Space Weather impacts on aviation, online - register: https://events.spacepole.be/event/218/
* Nov 17-19, 2025, STCE Space Weather Introductory Course, Brussels, Belgium - register: https://events.spacepole.be/event/217/
To register for a course and check the seminar details, navigate to the STCE Space Weather Education Center: https://www.stce.be/SWEC
If you want your event in the STCE newsletter, contact us: stce_coordination at stce.be
Website: https://www.stce.be/SWEC