- Table of Content
- 1.Space weather ...
- 2.Review of sola...
- 3.International ...
- 4.PROBA2 Observa...
- 5.Noticeable Sol...
- 6.Geomagnetic Ob...
- 7.Review of Iono...
- 8.The SIDC Space...
- 9.Review of sola...
- 10.International ...
- 11.PROBA2 Observa...
- 12.Noticeable Sol...
- 13.Geomagnetic Ob...
- 14.Review of Iono...
- 15.Review of sola...
- 16.International ...
- 17.PROBA2 Observa...
- 18.Noticeable Sol...
- 19.Geomagnetic Ob...
- 20.Review of Iono...
- 21.The SIDC Space...
- 22.Upcoming Activ...
2. Review of solar and geomagnetic activity
3. International Sunspot Number by SILSO
4. PROBA2 Observations
5. Noticeable Solar Events
6. Geomagnetic Observations in Belgium
7. Review of Ionospheric Activity
8. The SIDC Space Weather Briefing
9. Review of solar and geomagnetic activity
10. International Sunspot Number by SILSO
11. PROBA2 Observations
12. Noticeable Solar Events
13. Geomagnetic Observations in Belgium
14. Review of Ionospheric Activity
15. Review of solar and geomagnetic activity
16. International Sunspot Number by SILSO
17. PROBA2 Observations
18. Noticeable Solar Events
19. Geomagnetic Observations in Belgium
20. Review of Ionospheric Activity
21. The SIDC Space Weather Briefing (30 Dec 2024 - 5 Jan 2025)
22. Upcoming Activities (30 Dec 2024 - 5 Jan 2025)
Space weather sparkling from Old into New
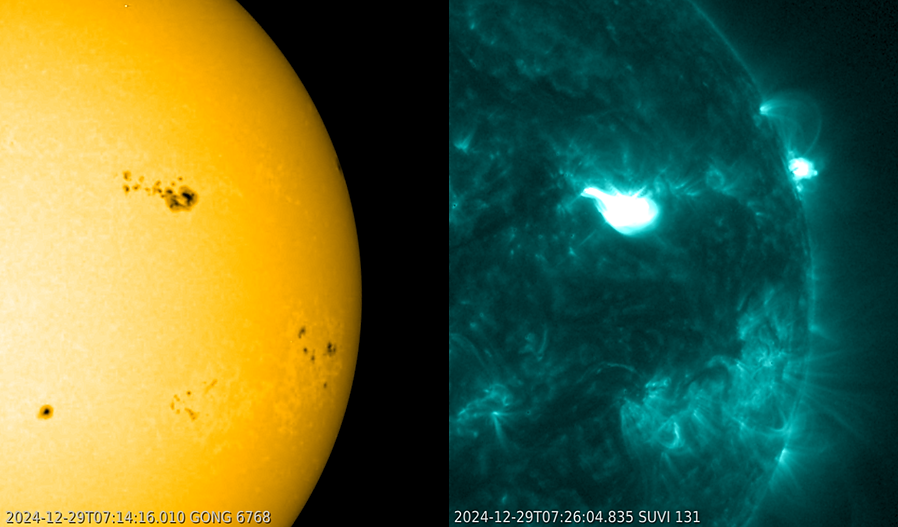
Several X-class flares marked the transition from the old 2024 into the new 2025, flanking a brief but severe geomagnetic storm on 1 January. The already enhanced solar activity saw an impressive increase in the number of solar flares on 29 and 30 December with no less than 35 M- and 3 X-class events (NOAA) during this 48-hour interval. Most of this activity came from active region NOAA 3936, a complex group in the northwest solar quadrant (see the STCE newsflashes at https://www.stce.be/news/741/welcome.html ). The three X-class flares all registered at the X1-level. The first was not associated with a coronal mass ejection (CME), whereas the second was associated with a CME but directed away from Earth. The third X-class event originated in NOAA 3932 in the southwest solar quadrant and was most likely induced by the preceding X-class eruption in NOAA3936 (only 17 minutes difference in the peak time of the respective flares). The imagery underneath shows the Sun's western hemisphere in white light (GONG) and in extreme ultraviolet (GOES/SUVI 131) near the peak time of the first X-class event.
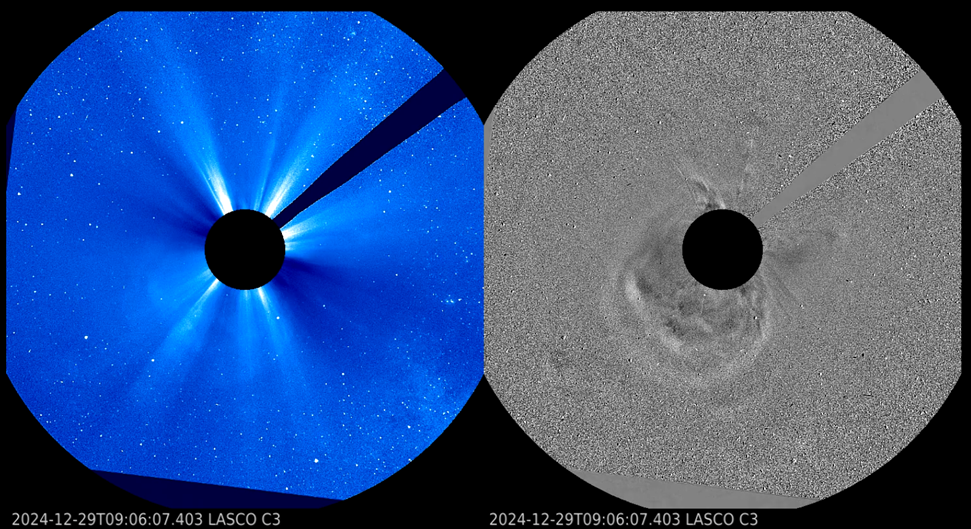
Assessment of the coronagraphic imagery revealed that there were 2 CMEs with a potentially earth-directed component. They were both associated with M-class flares in NOAA 3939 (not NOAA 3936 or 3932!), located in the southeast solar quadrant, on 29 December. The first of these CMEs, shown in the coronagraphic imagery underneath (SOHO/LASCO), arrived on 31 December. The intensity of the north-south component of the interplanetary magnetic field (Bz) was initially moderately negative around -10 nT resulting in -at that time- only active geomagnetic conditions (Kp = 4). Then, from early on 1 January onwards, Bz gradually decreased to sustained values around -20 nT, with largest values of -23 nT. The geomagnetic activity increased from minor geomagnetic storming observed during the 03-06 and 06-09 UTC intervals to severe geomagnetic storming (Kp = 8o) during the 15-18 UTC interval. K_BEL reached strong storming levels during the 17-20 UTC interval. The preliminary Dst index reached an impressive value of -215 nT on 1 January (WDC Kyoto), bringing it into the Top 5 of strongest storms so far this solar cycle (SC25 - https://www.stce.be/content/sc25-tracking#dstindex ). Long exposure photographs show red aurora as far south as northern Italy in Europe, and Arizona in the United States (Spaceweather.com).
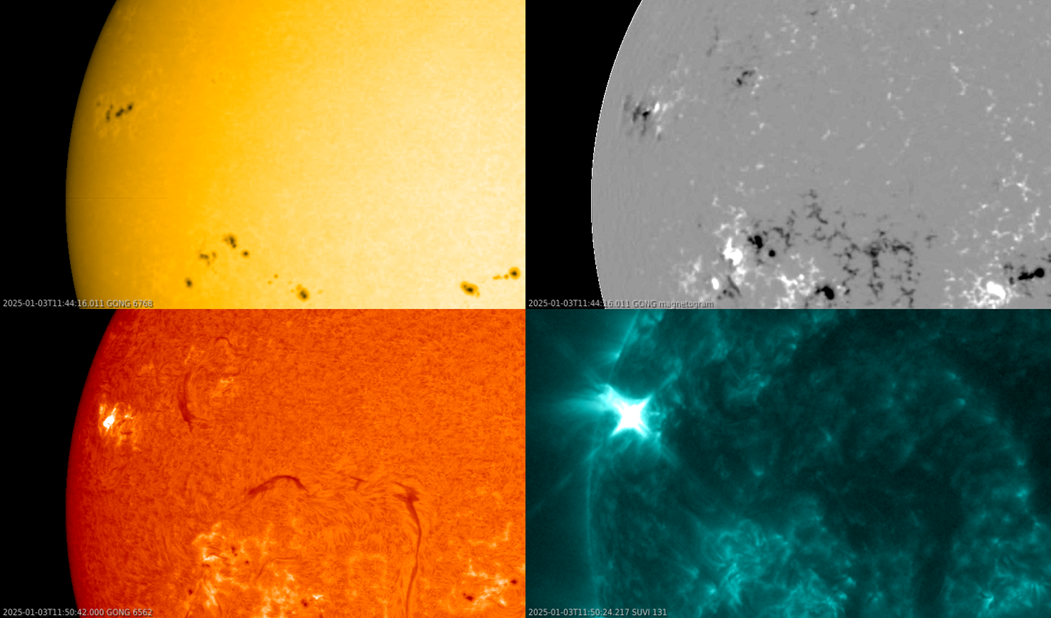
Then, on 2 January, active region NOAA 3947 rotated over the northeast solar limb and quickly developed into a compact sunspot group (McIntosh class Dac - https://www.stce.be/educational/classification#sunspot ) with a complex magnetic structure. On 3 and 4 January, it produced a total of 6 M- and 3 X-class flares, the strongest being an X1.8 event that peaked on 4 January at 12:48 UTC (see the STCE newsflashes https://www.stce.be/news/742/welcome.html ). The mosaic underneath shows the Sun's northeast quadrant near the time of the peak of the first X-class event (3 January) in white light (upper left), the magnetogram (upper right), in H-alpha (chromosphere, lower left ; GONG), and in extreme ultraviolet (corona, lower right; GOES/SUVI 131).
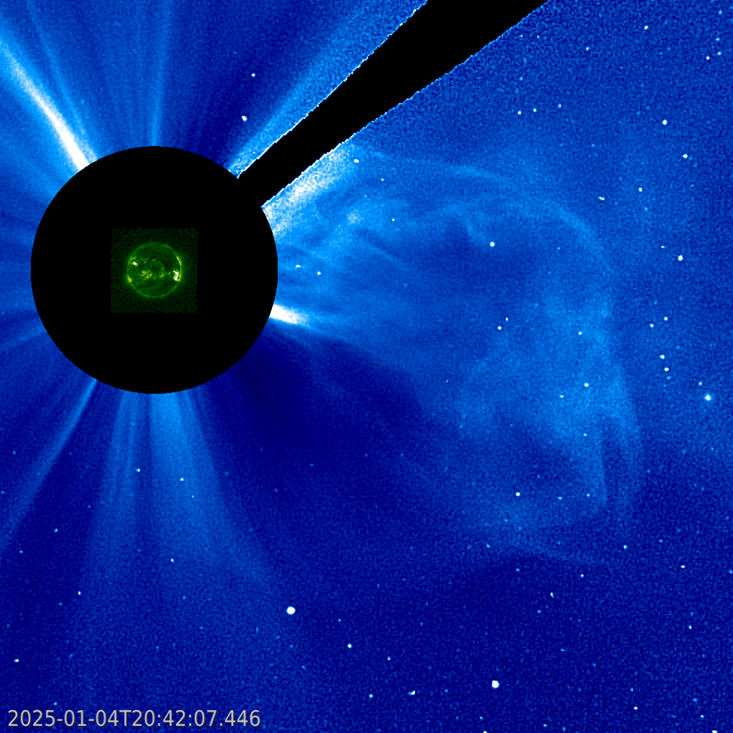
The CMEs associated with the aforementioned flaring activity were not thought to have an earth-directed component. Also the minor proton event observed late on 4 and early 5 January was not thought to be related to flaring from NOAA 3947. Rather, it appeared to be associated with a long duration C7 flare from good old NOAA 3939, now located in the southwest solar quadrant. The associated partial halo CME - first seen at 18:54 UTC on 4 January - had a speed in excess of 1000 km/s and the SIDC space weather forecasters expect it to deliver a glancing blow early on 7 January. The imagery underneath combines a GOES/SUVI 094 extreme ultraviolet image (green) with a white light coronagraphic image (blue), showing respectively the aftermath of the flare on the Sun and the associated CME (lower right).
Review of solar and geomagnetic activity
WEEK 1251 from 2024 Dec 16
Solar Active Regions and flares
The week started with six numbered active regions (ARs) on the solar disk. Throughout the week we saw SIDC Sunspot Groups 288 (NOAA AR 3917) to 345 (NOAA 3934). There were 10 M-class flares during the week. The largest one was an M3.8 flare peaking at 15:34 UTC on 19 December, coming from SIDC Sunspot Group 323 (NOAA Active Region 3928, beta magnetic field configuration). At the end of the week, 10 sunspot groups were visible on the solar disk.
Coronal mass ejections
A full halo CME was observed at 16:00 UT on 17 December, in LASCO C2. This CME was backsided.
A second full halo CME was observed at 18:16 UTC on 19 December by LASCO C3, again backsided.
A partial halo CME erupted at 20:00 UTC on December 21 (LASCO C2), with an angular width of approximately 150 degrees, and was associated with a Type II radio burst. The bulk of the material was directed toward the northeast and originated from a backsided filament eruption.
The previous CME was followed by a wide, faint, backsided CME observed in the southwest and a series of eruptions from SIDC Sunspot Group 341 (NOAA Active Region 3932). Related to these eruptions, a faint CME directed southward was observed first at 00:21 UTC on December 22 by LASCO C2.
Lastly, another partial halo CME was observed erupting at 04:00 UTC on December 22 toward the southwest. Since no clear signatures are visible on the solar disk, this CME is believed to be backsided.
Coronal Holes
A small coronal hole, SIDC Coronal Hole 83 (equatorial coronal hole with a negative polarity) crossed the central meridian on December 20.
Proton flux levels
The greater than 10 MeV proton flux was below the threshold level over the week. It had a short-lived peak on 17 December due to a full halo CME (but it did not pass the threshold) and a second long lasting increase on 20 December (but it did not pass the threshold).
Electron fluxes at GEO
The greater than 2 MeV electron flux measured by GOES 18 remained below the threshold level the full week. It went slightly above it in GOES 16 on 21-22 December. The 24-hour electron fluence was at normal levels.
Solar wind
The week started with the Earth in slow solar wind regime. Then, on 17 December, a shock was observed in the solar wind at 4:40 UT (in DSCOVR data), the speed jumped from 400 to 500 km/s, and the interplanetary magnetic field from 7 to 20 nT. The shock was driven by an ICME, corresponding to the expected arrival of the CME from 14 December. The solar wind speed reached 680 km/s and the interplanetary magnetic field reached 32 nT, with Bz going down to -16 nT.
Afterwards slow solar wind conditions were observed until 22 December when a high speed solar wind from SIDC Coronal Hole 83 (small equatorial coronal hole with a negative polarity) arrived to the Earth, elevating the solar wind speeds up to 700 km/s.
Geomagnetism
The week saw mostly quiet to unsettled levels both locally and globally (Kp and K_Bel up to 3). There were two periods during the week where geomagnetic conditions were disturbed. The first one was the ICME arriving on 17 December (Kp up to 5, K_Bel up to 4) and a high speed solar wind stream arrival on 22 December (Kp and K_Bel up to 4).
International Sunspot Number by SILSO
The daily Estimated International Sunspot Number (EISN, red curve with shaded error) derived by a simplified method from real-time data from the worldwide SILSO network. It extends the official Sunspot Number from the full processing of the preceding month (green line), a few days more than one solar rotation. The horizontal blue line shows the current monthly average. The yellow dots give the number of stations that provided valid data. Valid data are used to calculate the EISN. The triangle gives the number of stations providing data. When a triangle and a yellow dot coincide, it means that all the data is used to calculate the EISN of that day.
PROBA2 Observations
Solar Activity
Solar flare activity fluctuated from low to moderate during the week.
In order to view the activity of this week in more detail, we suggest to go to the following website from which all the daily (normal and difference) movies can be accessed: https://proba2.oma.be/ssa
This page also lists the recorded flaring events.
A weekly overview movie (SWAP week 769) can be found here: https://proba2.sidc.be/swap/data/mpg/movies/weekly_movies/weekly_movie_2024_12_16.mp4.
Details about some of this week's events can be found further below.
If any of the linked movies are unavailable they can be found in the P2SC movie repository here: https://proba2.oma.be/swap/data/mpg/movies/.
Thursday December 19
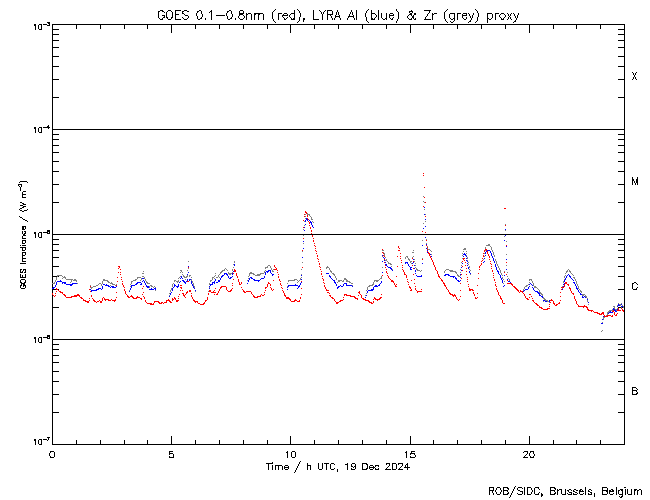
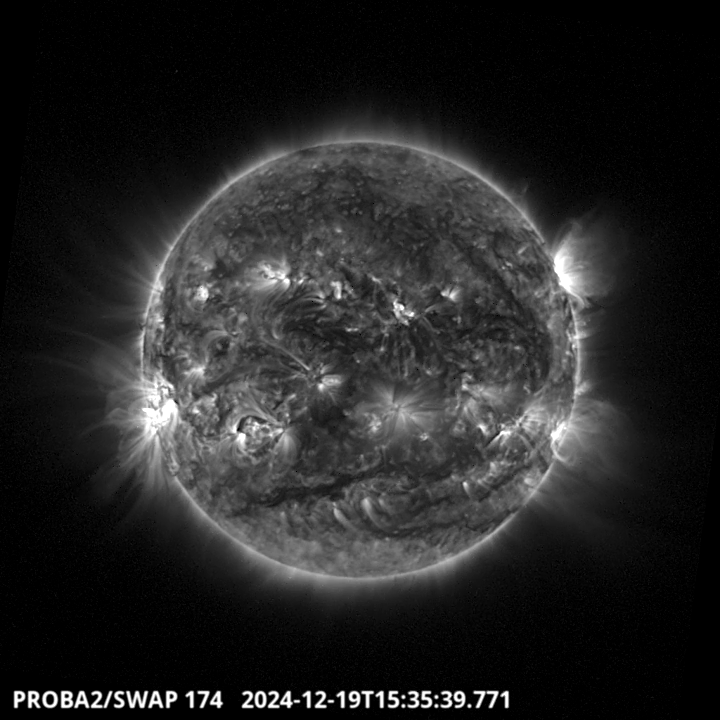
The largest flare of this week was an M3.8, and it was observed by LYRA (top panel) and SWAP (bottom panel). The flare peaked on 2024-Dec-19 at 15:34 UT. It occurred close to the equator in the eastern hemisphere, originating from active region NOAA3928.
Find a SWAP movie of the event here: https://proba2.sidc.be/swap/movies/20241219_swap_movie.mp4.
Noticeable Solar Events
| DAY | BEGIN | MAX | END | LOC | XRAY | OP | 10CM | TYPE | Cat | NOAA |
| 19 | 1021 | 1038 | 1057 | S19W72 | M1.6 | SF | 50 | 3924 | ||
| 19 | 1527 | 1534 | 1539 | M3.8 | 3928 | |||||
| 19 | 1856 | 1900 | 1904 | M1.7 | 3928 | |||||
| 20 | 0720 | 0726 | 0735 | M2.1 | 50 | 3924 | ||||
| 20 | 1115 | 1118 | 1122 | M2.5 | 65 | 3928 | ||||
| 21 | 0033 | 0038 | 0042 | M1.9 | III/2 | 66 | 3932 | |||
| 22 | 0403 | 0410 | 0414 | M1.0 | VI/3V/3 | 66 | 3932 | |||
| 22 | 1406 | 1414 | 1423 | N15E61 | M1.0 | S | III/1 | 60 | 3930 | |
| 22 | 2039 | 2049 | 2054 | S19E39 | M1.1 | 1N | III/2 | 66 | 3932 |
| LOC: approximate heliographic location | TYPE: radio burst type |
| XRAY: X-ray flare class | Cat: Catania sunspot group number |
| OP: optical flare class | NOAA: NOAA active region number |
| 10CM: peak 10 cm radio flux |
Geomagnetic Observations in Belgium

Local K-type magnetic activity index for Belgium based on data from Dourbes (DOU) and Manhay (MAB). Comparing the data from both measurement stations allows to reliably remove outliers from the magnetic data. At the same time the operational service availability is improved: whenever data from one observatory is not available, the single-station index obtained from the other can be used as a fallback system.
Both the two-station index and the single station indices are available here: http://ionosphere.meteo.be/geomagnetism/K_BEL/
Review of Ionospheric Activity
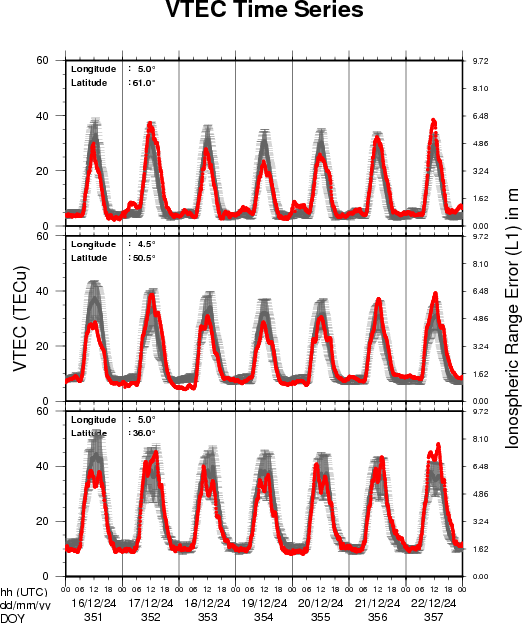
VTEC time series at 3 locations in Europe from 16 Dec 2024 till 22 Dec 2024
The top figure shows the time evolution of the Vertical Total Electron Content (VTEC) (in red) during the last week at three locations:
a) in the northern part of Europe(N 61deg E 5deg)
b) above Brussels(N 50.5deg, E 4.5 deg)
c) in the southern part of Europe(N 36 deg, E 5deg)
This top figure also shows (in grey) the normal ionospheric behaviour expected based on the median VTEC from the 15 previous days.
The time series below shows the VTEC difference (in green) and relative difference (in blue) with respect to the median of the last 15 days in the North, Mid (above Brussels) and South of Europe. It thus illustrates the VTEC deviation from normal quiet behaviour.
The VTEC is expressed in TECu (with TECu=10^16 electrons per square meter) and is directly related to the signal propagation delay due to the ionosphere (in figure: delay on GPS L1 frequency).
The Sun's radiation ionizes the Earth's upper atmosphere, the ionosphere, located from about 60km to 1000km above the Earth's surface.The ionization process in the ionosphere produces ions and free electrons. These electrons perturb the propagation of the GNSS (Global Navigation Satellite System) signals by inducing a so-called ionospheric delay.
See http://stce.be/newsletter/GNSS_final.pdf for some more explanations; for more information, see https://gnss.be/SpaceWeather
The SIDC Space Weather Briefing
The forecaster on duty presented the SIDC briefing that gives an overview of space weather from December 16 to 22.
The pdf of the presentation can be found here: https://www.stce.be/briefings/20241223_SWbriefing.pdf
Review of solar and geomagnetic activity
WEEK 1252 from 2024 Dec 23
Solar Active Regions (ARs) and flares
Solar flaring activity ranged from moderate to high over the past week, with a total of 45 M-class flares and one X-class flare recorded. Solar flaring activity during the week was dominated by SIDC Sunspot Groups 349 (NOAA Active Region 3936), 346 (NOAA Active Region 3933), and 341 (NOAA Active Region 3932), all of which exhibited Beta-Gamma-Delta configurations at various times, indicating complex and active magnetic fields. On December 23, flaring activity included an M8.9 flare (SIDC Flare 3058) that peaked at 11:12 UTC. This flare originated from SIDC Sunspot Group 341 (NOAA Active Region 3932), located at S35E20, the most magnetically complex region at the time, with a Beta-Gamma configuration. The week ended with heightened activity on December 29, culminating in an X1.1 flare (SIDC Flare 3109) peaking at 07:18 UTC from SIDC Sunspot Group 349 (NOAA Active Region 3936). On the same day, this region produced an M4.2 flare at 07:59 UTC, and a total of 11 M-class flares were recorded during the 24-hour period.
Coronal mass ejections
On December 23, a partial halo CME was detected at 11:36 UTC, associated with the M8.9 flare from SIDC Sunspot Group 341 (NOAA Active Region 3932). This CME had a true speed of approximately 800 km/s and was expected to reach Earth by December 26, although it ultimately missed Earth and had no impact. On December 27, two partial halo CMEs were observed. The first, at 04:28 UTC, had an average speed of 991 km/s, while the second, at 05:24 UTC, had an average speed of 517 km/s. Both CMEs were directed toward the southeast, and their origins remain unclear, though they are presumed to be backside events. Finally, on December 29, a significant halo CME was observed at 06:12 UTC, moving southeast with an average speed of 767 km/s. No visible flares or dimming events on the solar disk were conclusively linked to this CME, leading to the presumption that it originated from the far side of the Sun.
Coronal Holes
Early in the week, SIDC Coronal Hole 84, a mid-latitude coronal hole with positive polarity, crossed the central meridian on December 23 and began moving toward the western side of the Sun. SIDC Coronal Hole 83, an equatorial coronal hole with negative polarity, rotated toward the western limb after crossing the central meridian on December 19. Later in the week, SIDC Coronal Hole 60, a recurrent mid-latitude coronal hole with positive polarity, began rotating over the eastern limb. This coronal hole, observed crossing the central meridian in September, October, November, and early December, historically produced mild high-speed streams with speeds reaching 500 km/s.
Proton flux levels
The greater-than-10 MeV GOES proton flux showed gradual decay throughout the week after enhancements on December 20. It returned to background levels by December 28 but remained under observation due to the heightened solar activity.
Electron fluxes at GEO
The greater-than-2 MeV electron flux measured by GOES 16 remained below the threshold level over the past week, while GOES 18 briefly recorded threshold crossings. It is expected that the flux will remain below the threshold over the next 24 hours. The 24-hour electron fluence remained at normal levels and is anticipated to remain stable.
Solar wind
At the beginning of the week, solar wind speeds reached 700 km/s on December 23, associated with the high-speed stream from SIDC Coronal Hole 83. By midweek, speeds had dropped to 450 km/s and entered a slow-speed regime, with values stabilizing below 400 km/s by December 27. The total interplanetary magnetic field (IMF) ranged between 5-7 nT early in the week but remained below 5 nT for the latter half. Occasional brief elevations up to 10 nT were observed near the end of the week, with the southward component (Bz) predominantly positive.
Geomagnetism
The week began with unsettled to active geomagnetic conditions on December 23-24, with Kp values reaching 4 globally and K_BEL values up to 3 locally. These conditions were driven by the influence of high-speed streams from SIDC Coronal Hole 83 crossing the central meridian on December 19. By the end of the week, geomagnetic conditions were very quiet, with Kp and K_BEL values between 0 and 2.
International Sunspot Number by SILSO

The daily Estimated International Sunspot Number (EISN, red curve with shaded error) derived by a simplified method from real-time data from the worldwide SILSO network. It extends the official Sunspot Number from the full processing of the preceding month (green line), a few days more than one solar rotation. The horizontal blue line shows the current monthly average. The yellow dots give the number of stations that provided valid data. Valid data are used to calculate the EISN. The triangle gives the number of stations providing data. When a triangle and a yellow dot coincide, it means that all the data is used to calculate the EISN of that day.
PROBA2 Observations
Solar Activity
Solar flare activity fluctuated from moderate to high during the week.
In order to view the activity of this week in more detail, we suggest to go to the following website from which all the daily (normal and difference) movies can be accessed: https://proba2.oma.be/ssa
This page also lists the recorded flaring events.
A weekly overview movie (SWAP week 770) can be found here: https://proba2.sidc.be/swap/data/mpg/movies/weekly_movies/weekly_movie_2024_12_23.mp4.
Details about some of this week's events can be found further below.
If any of the linked movies are unavailable they can be found in the P2SC movie repository here: https://proba2.oma.be/swap/data/mpg/movies/.
Monday December 23
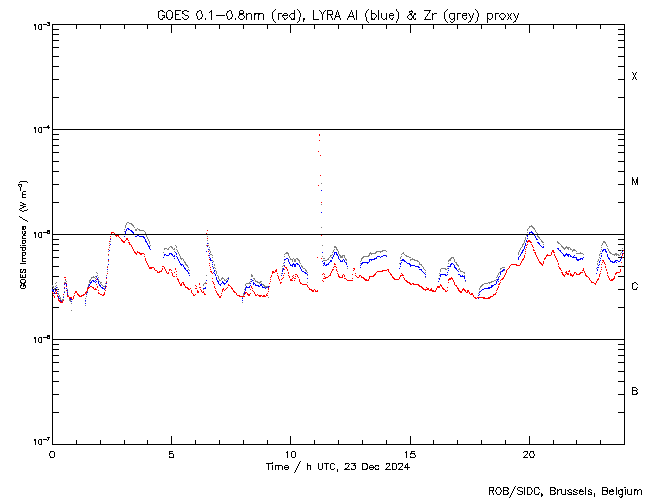
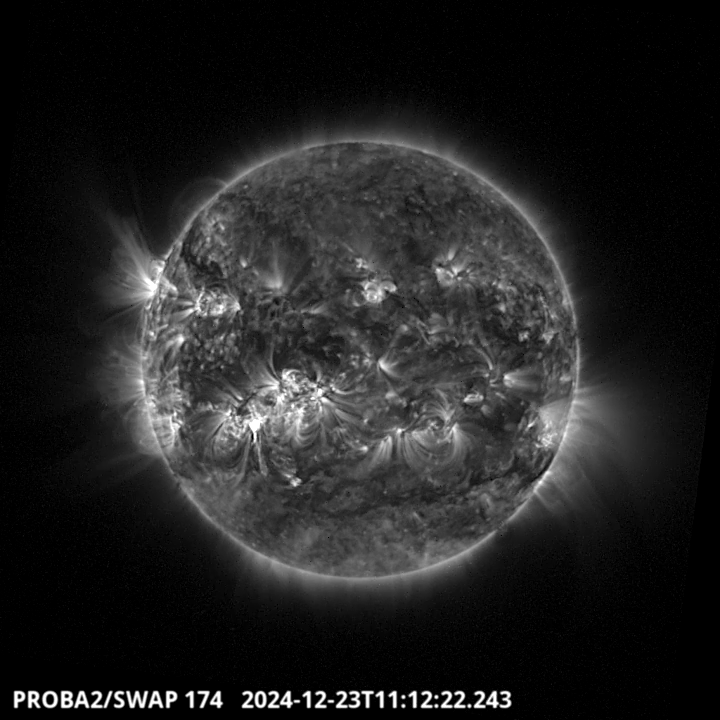
The largest flare of this week was an X1.1 (from active region NOAA3936) on 2024-Dec-29, but it was not observed by PROBA2 due to an orbital occultation. The second largest flare was an M8.9, and it was observed by LYRA (top panel) and SWAP (bottom panel). The flare peaked on 2024-Dec-23 at 11:12 UT. It occurred close to the equator in the eastern hemisphere, originating from active region NOAA3932.
Find a SWAP movie of the event here: https://proba2.sidc.be/swap/movies/20241223_swap_movie.mp4.
Noticeable Solar Events
| DAY | BEGIN | MAX | END | LOC | XRAY | OP | 10CM | TYPE | Cat | NOAA |
| 23 | 0210 | 0231 | 0259 | M1.0 | ||||||
| 23 | 0624 | 0629 | 0634 | S15E22 | M1.0 | SF | 65 | 3928 | ||
| 23 | 1106 | 1112 | 1116 | M8.9 | III/3II/3 | 66 | 3932 | |||
| 24 | 0014 | 0019 | 0024 | M4.7 | III/3 | 66 | 3932 | |||
| 24 | 0828 | 0841 | 0845 | S19E18 | M4.1 | 1B | III/2II/2 | 66 | 3932 | |
| 24 | 1402 | 1410 | 1414 | M1.1 | III/2 | 66 | 3932 | |||
| 24 | 1625 | 1634 | 1641 | S17E16 | M1.3 | 1N | 66 | 3932 | ||
| 24 | 1820 | 1824 | 1830 | S18E22 | M1.0 | SF | 66 | 3932 | ||
| 24 | 2015 | 2028 | 2041 | M1.0 | 60 | 3930 | ||||
| 25 | 0414 | 0430 | 0439 | N17E64 | M2.8 | SF | 3938 | |||
| 25 | 0446 | 0449 | 0453 | S10W4 | M4.9 | SF | II/2III/1 | 66 | 3932 | |
| 24 | 2224 | 2234 | 2242 | M1.2 | VI/2III/2 | 3938 | ||||
| 25 | 2359 | 0030 | 0053 | M3.0 | 3938 | |||||
| 26 | 0252 | 0315 | 0325 | N18E51 | M7.3 | 2B | 3938 | |||
| 27 | 1527 | 1538 | 1545 | S13W41 | M1.2 | SF | 65 | 3928 | ||
| 27 | 2029 | 2035 | 2041 | N19E25 | M3.3 | 2N | 72 | 3938 | ||
| 28 | 1112 | 1121 | 1131 | S9W55 | M4.5 | SF | 68 | 3932 | ||
| 28 | 1514 | 1518 | 1523 | S17W30 | M1.3 | 1F | 68 | 3932 | ||
| 28 | 2204 | 2214 | 2223 | M1.2 | 67 | 3933 | ||||
| 29 | 0228 | 0235 | 0238 | N15W26 | M1.0 | SF | 61 | 3929 | ||
| 29 | 0238 | 0246 | 0253 | N15W26 | M1.3 | SF | 69 | 3936 | ||
| 29 | 0325 | 0330 | 0340 | N15W26 | M1.3 | SF | 69 | 3936 | ||
| 29 | 0356 | 0405 | 0414 | M1.2 | II/2 | 75 | 3940 | |||
| 29 | 0418 | 0430 | 0445 | S17E33 | M2.0 | SF | 74 | 3939 | ||
| 29 | 0512 | 0526 | 0532 | S9W67 | M3.1 | SF | V/2 | 67 | 3933 | |
| 29 | 0541 | 0547 | 0558 | S17E33 | M3.5 | S | 74 | 3939 | ||
| 29 | 0648 | 0659 | 0708 | N10W33 | M3.0 | 1N | 69 | 3936 | ||
| 29 | 0708 | 0718 | 0734 | N11W31 | X1.1 | S | II/2 | 69 | 3936 | |
| 29 | 0754 | 0759 | 0900 | M4.2 | TM/1 | 69 | 3936 | |||
| 29 | 0941 | 0948 | 0955 | M1.4 | 69 | 3936 | ||||
| 29 | 1026 | 1039 | 1054 | N23E12 | M2.6 | S | I/1 | 72 | 3938 | |
| 29 | 1215 | 1224 | 1229 | N10W36 | M1.6 | SF | 69 | 3936 | ||
| 29 | 1250 | 1256 | 1300 | N10W37 | M1.3 | S | 69 | 3936 | ||
| 29 | 1502 | 1509 | 1522 | M7.1 | II/1 | 69 | 3936 | |||
| 29 | 1656 | 1708 | 1720 | N19E1 | M3.3 | S | II/1TM/1 | 74 | 3939 | |
| 29 | 1746 | 1752 | 1758 | S12W47 | M1.2 | SN | II/2 | 68 | 3932 | |
| 29 | 1758 | 1804 | 1808 | S6E29 | M1.4 | SF | 3 | 75 | 3940 | |
| 29 | 1827 | 1841 | 1858 | N13W40 | M3.3 | 1N | 3934 | |||
| 29 | 2031 | 2039 | 2046 | S6W76 | M1.1 | SF | 67 | 3933 | ||
| 29 | 2142 | 2153 | 2157 | S16E18 | M1.5 | S | 69 | 3936 | ||
| 29 | 2157 | 2206 | 2213 | M1.8 | 69 | 3936 | ||||
| 29 | 2320 | 2330 | 2336 | S16E18 | M1.9 | S | III/1 | 74 | 3939 |
| LOC: approximate heliographic location | TYPE: radio burst type |
| XRAY: X-ray flare class | Cat: Catania sunspot group number |
| OP: optical flare class | NOAA: NOAA active region number |
| 10CM: peak 10 cm radio flux |
Geomagnetic Observations in Belgium
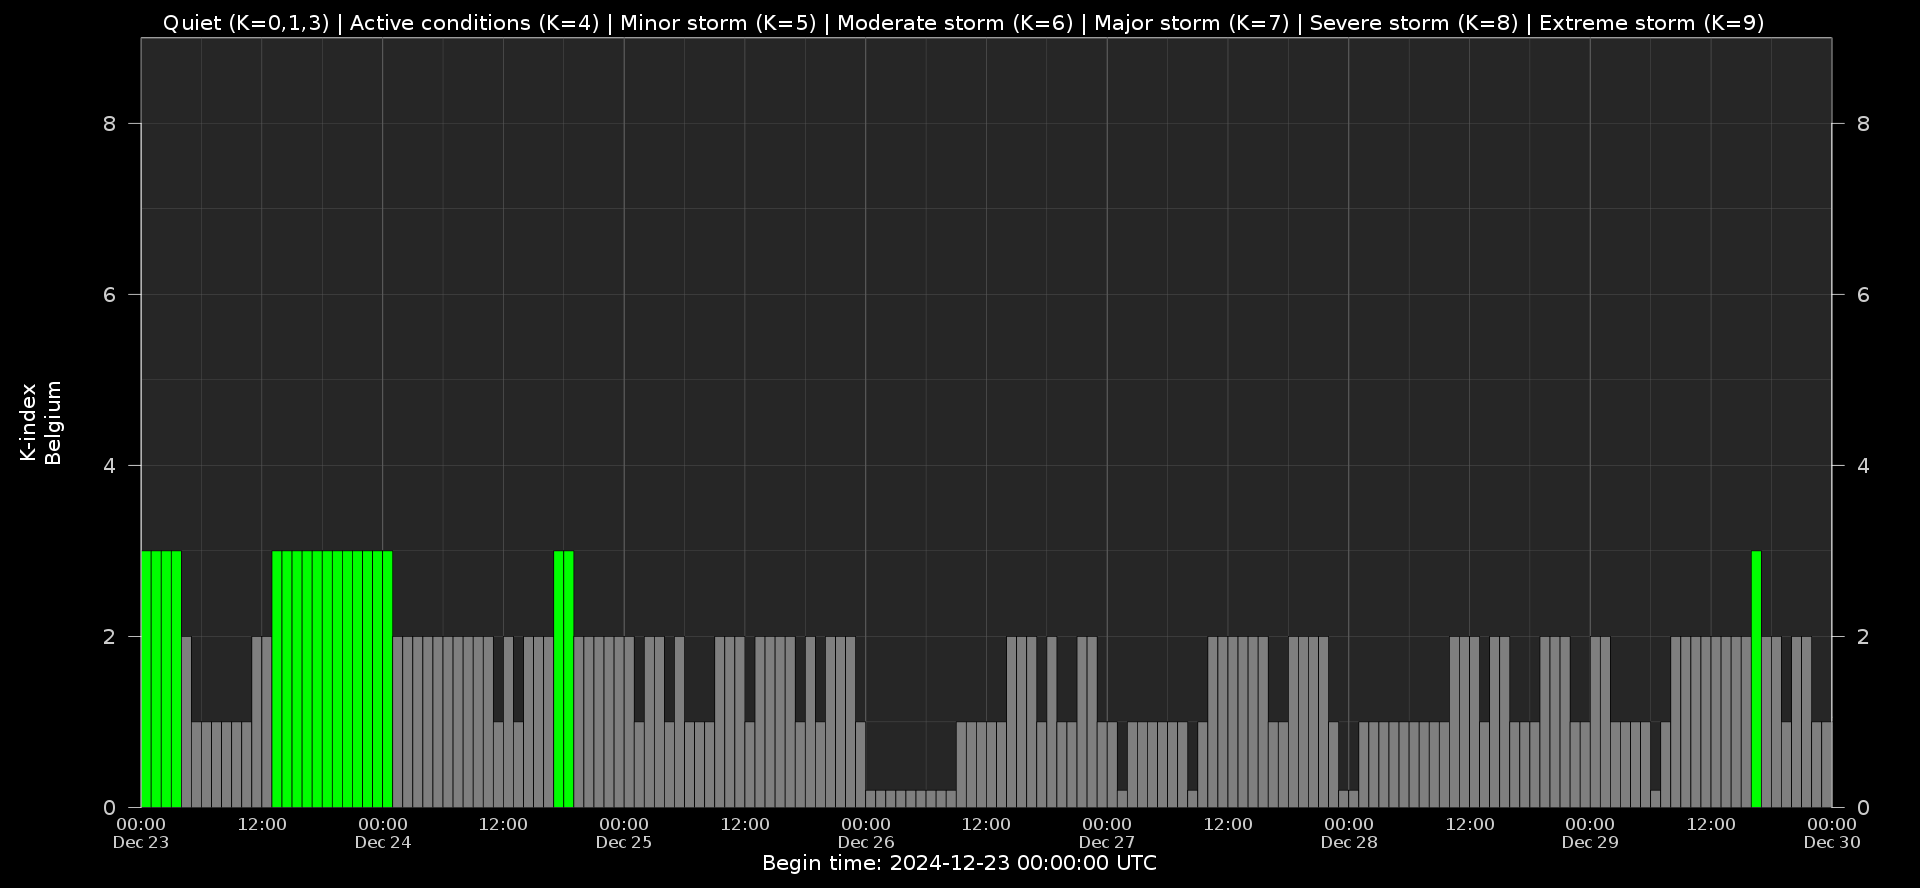
Local K-type magnetic activity index for Belgium based on data from Dourbes (DOU) and Manhay (MAB). Comparing the data from both measurement stations allows to reliably remove outliers from the magnetic data. At the same time the operational service availability is improved: whenever data from one observatory is not available, the single-station index obtained from the other can be used as a fallback system.
Both the two-station index and the single station indices are available here: http://ionosphere.meteo.be/geomagnetism/K_BEL/
Review of Ionospheric Activity
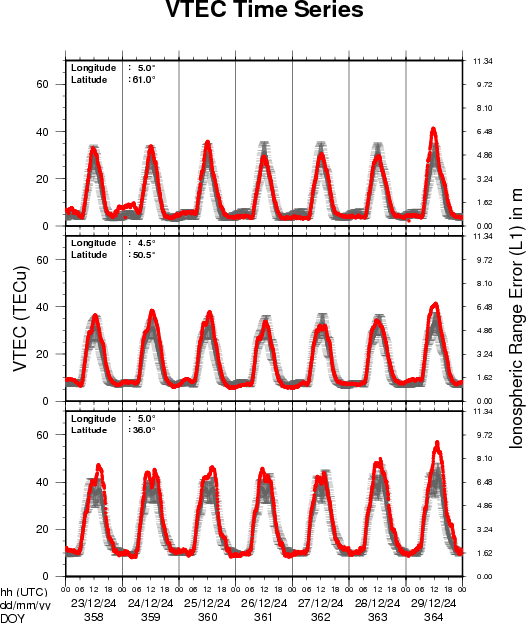
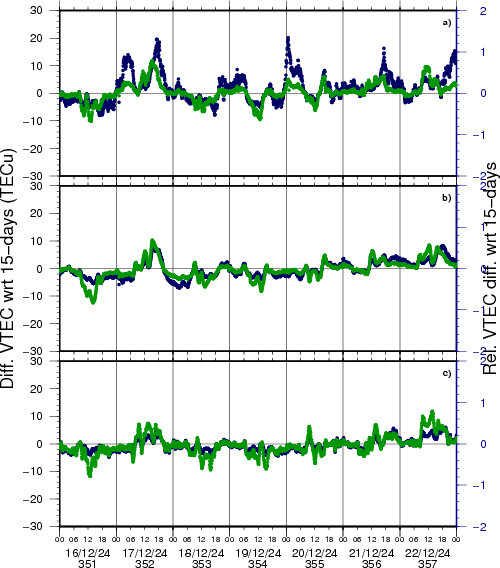
VTEC time series at 3 locations in Europe from 23 Dec 2024 till 29 Dec 2024
The top figure shows the time evolution of the Vertical Total Electron Content (VTEC) (in red) during the last week at three locations:
a) in the northern part of Europe(N 61deg E 5deg)
b) above Brussels(N 50.5deg, E 4.5 deg)
c) in the southern part of Europe(N 36 deg, E 5deg)
This top figure also shows (in grey) the normal ionospheric behaviour expected based on the median VTEC from the 15 previous days.
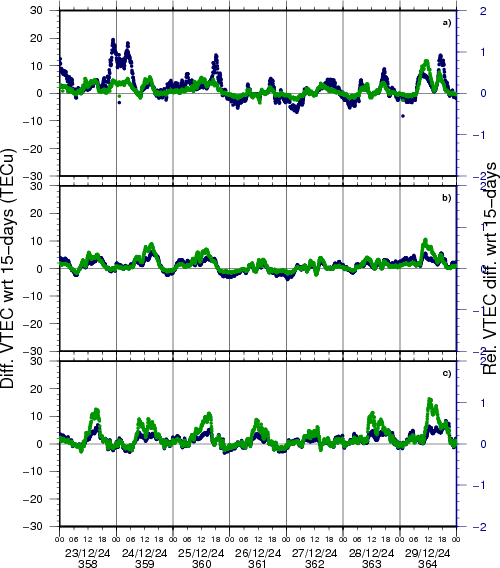
The time series below shows the VTEC difference (in green) and relative difference (in blue) with respect to the median of the last 15 days in the North, Mid (above Brussels) and South of Europe. It thus illustrates the VTEC deviation from normal quiet behaviour.
The VTEC is expressed in TECu (with TECu=10^16 electrons per square meter) and is directly related to the signal propagation delay due to the ionosphere (in figure: delay on GPS L1 frequency).
The Sun's radiation ionizes the Earth's upper atmosphere, the ionosphere, located from about 60km to 1000km above the Earth's surface.The ionization process in the ionosphere produces ions and free electrons. These electrons perturb the propagation of the GNSS (Global Navigation Satellite System) signals by inducing a so-called ionospheric delay.
See http://stce.be/newsletter/GNSS_final.pdf for some more explanations; for more information, see https://gnss.be/SpaceWeather
Review of solar and geomagnetic activity
WEEK 1253 from 2024 Dec 30
Solar Active Regions and flares
Solar flaring activity was at moderate to high levels over the week. There was a total of 24 numbered active regions (ARs) observed on the visible solar disk over the week. At the start of the week, between December 29 and December 31, the flaring activity was dominated by SIDC Sunspot Group 349 (NOAA AR 3936). This region produced multiple M-class flares and an X class flare, the largest of which was an X1.5 flare (SIDC Flare 3128), peaking on December 30 at 04:14 UTC. A second X-class flare was recorded shortly afterwards, an X1.1 flare (SIDC Flare 3130), with peak time 04:31 UTC on December 30, associated with SIDC Sunspot Group 341 (NOAA Active Region 3932). SIDC Sunspot Groups 346, 350, 351 and 352 (NOAA ARs 3933, 3938, 3939 and 3941, respectively) all produced M-class flares on December 29 or 30. The flaring activity reduced slightly during the middle of the week, with only M-class flares recorded between December 31 to January 02. From January 03, the flaring activity increased again, with SIDC Sunspot Group 360 (NOAA Active Regions 3947) producing 3 further X-class flares in 2 days: An X1.2 (SIDC Flare 3184) and an X1.1 flare (SIDC Flare 3188), with peak times 11:39 UTC and 22:41 UTC on January 03, respectively, and an X1.8 flare (SIDC Flare 3199) with peak time 12:48 UTC on January 04. Most of the other regions on the disk were quiet with SIDC Sunspot groups 351, 352, 356 (NOAA ARs 3939, 3941, 3943, respectively) producing some high C-class level flaring towards the end of the week.
Coronal mass ejections
Four possible Earth-directed Coronal Mass Ejections (CMEs) were detected in the available coronagraph imagery over the past week. These included: two partial halo CMEs that were observed on December 29, associated with on disk signatures in the south-east of the solar disk, a filament eruption at the disk centre near SIDC Sunspot Group 351 (NOAA AR 3939) with an associated faint CME in SOHO/LASCO-C2 data from 02:20 UTC January 01 directed to the south-west, and a fast partial halo CME directed to the south-west seen in SOHO/LASCO-C2 imagery from 18:54 UTC January 04 associated with a long duration C7.6 flare.
Coronal Holes
Two elongated positive polarity coronal holes, one in the southern hemisphere (SIDC Coronal Hole 60) and an equatorial coronal hole in the northern hemisphere SIDC Coronal Hole 82) began to transit the central meridian on December 31 and January 01, respectively.
Proton flux levels
The greater than 10 MeV proton flux as measured by GOES-18 began to increase quickly from 20:30 UTC January 04 and exceeded the 10 pfu threshold from 22:15 UTC on January 04, reaching a maximum value of 20 pfu at 00:55 UTC January 05. The proton flux reduced below this threshold from 09:40 UTC January 05 but remained elevated. The event was likely associated to the long duration C7.6 flare and the partial halo CME to the south-west.
Electron fluxes at GEO
The greater than 2 MeV electron flux remained mostly below the 1000 pfu threshold as measured, but briefly crossed the threshold on January 05. The 24h electron fluence was at nominal levels.
Solar wind
The solar wind conditions reflected a slow solar wind regime at the start of the week. From 15:45 UTC on December 31, the solar wind parameters showed the arrival of the first halo CME of December 29. The interplanetary magnetic field increased from 9 to 25 nT and the solar wind speed increased from 400 to 475 km/s. From 02:00 UTC January 01, the solar wind speed increased further reaching values of over 550 km/s. After 02:00 UTC, the Bz also turned strongly negative with a minimum value of -22 nT. After initially reducing, the interplanetary magnetic field became enhanced again on January 02 from 10:00 UTC, indicating the arrival of the second CME from December 29. The magnetic field remained above 10 nT for the rest of the week, with a third CME arrival and High Speed Stream arrival on January 04. The solar wind speed increased at this time to reach values near 700 km/s on January 04 and 05.
Geomagnetism
Geomagnetic conditions were mostly quiet to unsettled on December 29 and December 31. Severe storm conditions (NOAA Kp 8) were reached between 15:00 and 18:00 UTC on January 01. Local K index (K Bel) reached 6 (moderate storm conditions). This was due to the first CME arrival and extended period of strong negative Bz. The Geomagnetic conditions then reduced slightly to unsettled to active conditions, with further periods of minor storm conditions on January 02, 04 and 05 in response to the following two CME arrivals and the onset of the high-speed stream.
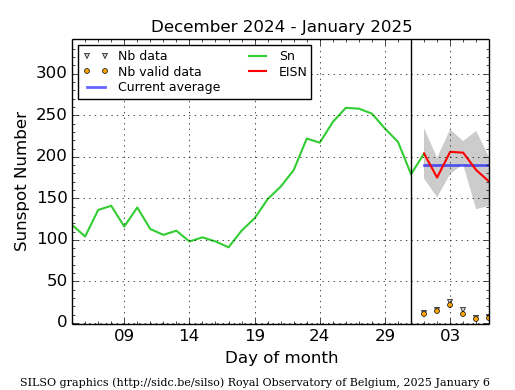
International Sunspot Number by SILSO

The daily Estimated International Sunspot Number (EISN, red curve with shaded error) derived by a simplified method from real-time data from the worldwide SILSO network. It extends the official Sunspot Number from the full processing of the preceding month (green line), a few days more than one solar rotation. The horizontal blue line shows the current monthly average. The yellow dots give the number of stations that provided valid data. Valid data are used to calculate the EISN. The triangle gives the number of stations providing data. When a triangle and a yellow dot coincide, it means that all the data is used to calculate the EISN of that day.
PROBA2 Observations
Solar Activity
Solar flare activity fluctuated from moderate to very high during the week.
In order to view the activity of this week in more detail, we suggest to go to the following website from which all the daily (normal and difference) movies can be accessed: https://proba2.oma.be/ssa
This page also lists the recorded flaring events.
A weekly overview movie (SWAP week 771) can be found here: https://proba2.sidc.be/swap/data/mpg/movies/weekly_movies/weekly_movie_2024_12_30.mp4.
Details about some of this week's events can be found further below.
If any of the linked movies are unavailable they can be found in the P2SC movie repository here: https://proba2.oma.be/swap/data/mpg/movies/.
Saturday January 04
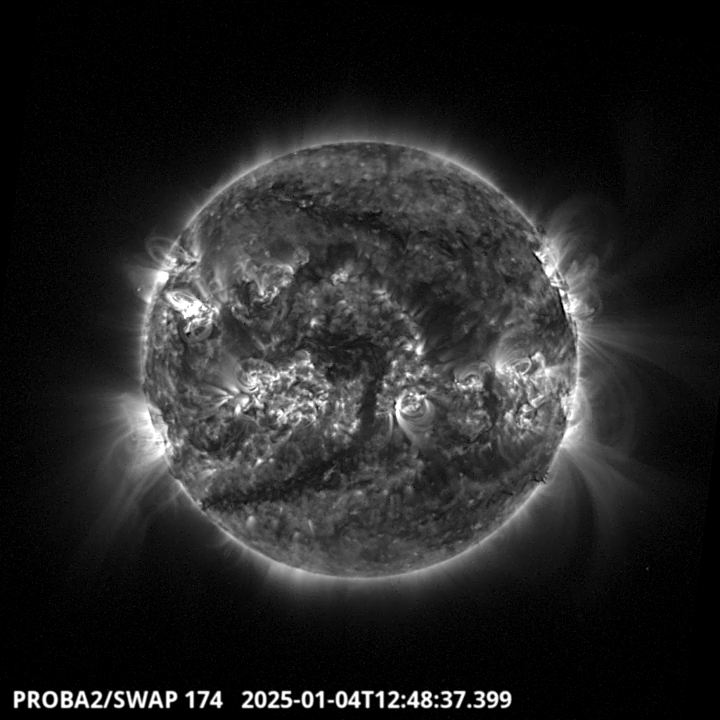
The largest flare of this active week was an X1.8, and it was observed by LYRA (top panel) and SWAP (bottom panel). The flare peaked on 2025-Jan-04 at 12:48 UT. It occurred in the north-eastern quadrant of the Sun, originating from active region NOAA3947.
Find a SWAP movie of the event here: https://proba2.sidc.be/swap/movies/20250104_swap_movie.mp4.
Noticeable Solar Events
| DAY | BEGIN | MAX | END | LOC | XRAY | OP | 10CM | TYPE | Cat | NOAA |
| 30 | 0033 | 0047 | 0058 | S17E19 | M1.7 | SF | VI/2III/1 | 74 | 3939 | |
| 30 | 0250 | 0300 | 0308 | S5E25 | M1.7 | SF | 3940 | |||
| 30 | 0401 | 0414 | 0428 | N10W45 | X1.5 | 2N | 69 | 3936 | ||
| 30 | 0429 | 0431 | 0434 | S19W50 | X1.1 | 1 | 68 | 3932 | ||
| 30 | 0613 | 0625 | 0640 | N11W47 | M3.5 | SF | 69 | 3936 | ||
| 30 | 0834 | 0840 | 0844 | S9W55 | M1.4 | SF | VI/2 | 67 | 3933 | |
| 30 | 0844 | 0850 | 0856 | M1.7 | III/1 | 67 | 3933 | |||
| 30 | 1000 | 1011 | 1018 | S16E12 | M1.7 | SF | 67 | 3933 | ||
| 30 | 1434 | 1446 | 1453 | N11W51 | M3.5 | 1 | III/1 | 69 | 3936 | |
| 30 | 1645 | 1654 | 1701 | N13W51 | M5.0 | 1N | 69 | 3936 | ||
| 30 | 1714 | 1730 | 1736 | N13W55 | M1.2 | 1N | 69 | 3936 | ||
| 30 | 1736 | 1742 | 1748 | M1.6 | 69 | 3936 | ||||
| 30 | 1814 | 1824 | 1827 | S11W62 | M1.6 | SF | III/2 | 69 | 3936 | |
| 30 | 1827 | 1833 | 1843 | M1.7 | 69 | 3936 | ||||
| 30 | 2235 | 2241 | 2248 | S16E6 | M1.0 | 1 | 74 | 3939 | ||
| 31 | 0450 | 0500 | 0506 | S19W63 | M1.0 | SF | 68 | 3932 | ||
| 31 | 2202 | 2219 | 2238 | M2.7 | III/2 | 69 | 3936 | |||
| 31 | 2246 | 2250 | 2255 | M2.9 | 72 | 3938 | ||||
| 01 | 0435 | 0445 | 0502 | M1.1 | 69 | 3936 | ||||
| 31 | 2109 | 2151 | 2202 | M2.1 | 69 | 3936 | ||||
| 01 | 1512 | 1524 | 1543 | M1.0 | 69 | 3936 | ||||
| 01 | 1805 | 1817 | 1828 | N15W83 | M1.2 | SF | 69 | 3936 | ||
| 01 | 2132 | 2141 | 2146 | M1.1 | 69 | 3936 | ||||
| 02 | 1718 | 1740 | 1759 | S9W29 | M1.1 | 1 | III/1 | 74 | 3939 | |
| 03 | 1129 | 1139 | 1149 | X1.2 | 82 | 3947 | ||||
| 03 | 2154 | 2212 | 2227 | N11E57 | M2.3 | 1N | 82 | 3947 | ||
| 03 | 2232 | 2241 | 2251 | N10E61 | X1.1 | 1 | II/2 | 82 | 3947 | |
| 03 | 2314 | 2324 | 2333 | N10E56 | M1.9 | SF | 82 | 3947 | ||
| 03 | 2350 | 2356 | 0005 | N10E56 | M5.8 | 1 | 82 | 3947 | ||
| 04 | 0034 | 0036 | 0041 | N10E56 | M1.5 | 1 | 82 | 3947 | ||
| 04 | 0458 | 0518 | 0527 | N10E56 | M7.6 | 1N | 82 | 3947 | ||
| 04 | 1234 | 1248 | 1256 | X1.8 | II/2 | 82 | 3947 | |||
| 04 | 2308 | 2326 | 2336 | N11E45 | M2.1 | SF | III/1 | 82 | 3947 | |
| 05 | 0214 | 0239 | 0256 | N11E44 | M4.1 | SF | 82 | 3947 | ||
| 05 | 0704 | 0718 | 0741 | N12E40 | M2.1 | SN | 82 | 3947 | ||
| 05 | 0909 | 0936 | 0951 | N11E40 | M4.1 | 2N | 82 | 3947 | ||
| 05 | 1520 | 1537 | 1543 | M2.4 | III/1 | 82 | 3947 |
| LOC: approximate heliographic location | TYPE: radio burst type |
| XRAY: X-ray flare class | Cat: Catania sunspot group number |
| OP: optical flare class | NOAA: NOAA active region number |
| 10CM: peak 10 cm radio flux |
Geomagnetic Observations in Belgium
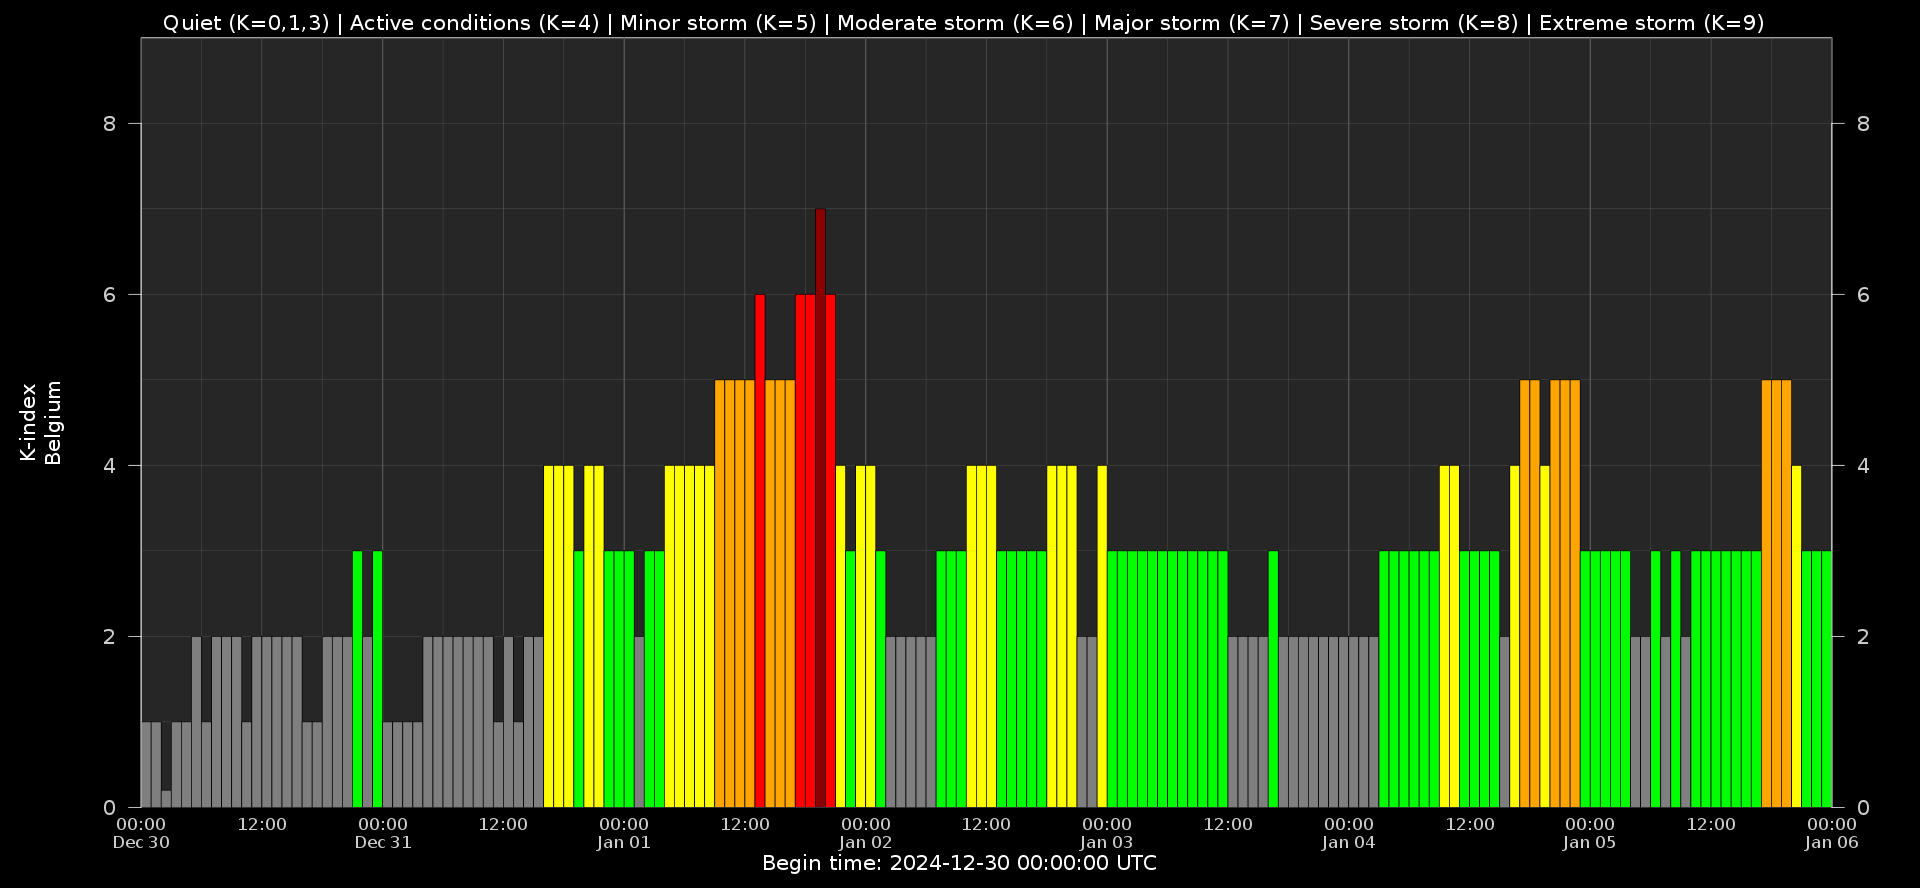
Local K-type magnetic activity index for Belgium based on data from Dourbes (DOU) and Manhay (MAB). Comparing the data from both measurement stations allows to reliably remove outliers from the magnetic data. At the same time the operational service availability is improved: whenever data from one observatory is not available, the single-station index obtained from the other can be used as a fallback system.
Both the two-station index and the single station indices are available here: http://ionosphere.meteo.be/geomagnetism/K_BEL/
Review of Ionospheric Activity
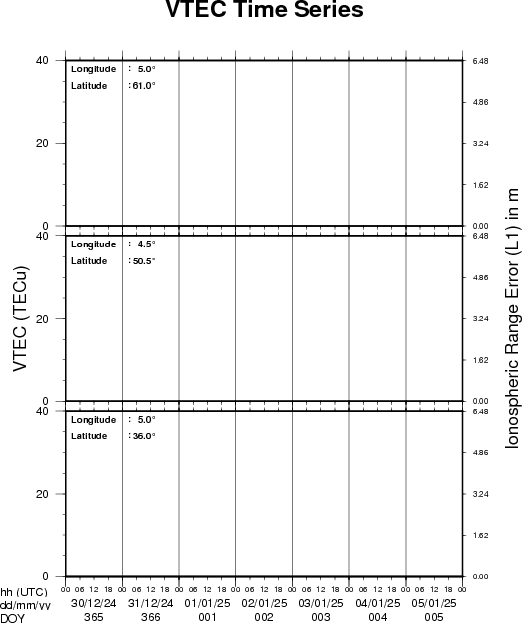
VTEC time series at 3 locations in Europe from 30 Dec 2024 till 5 Jan 2025
The top figure shows the time evolution of the Vertical Total Electron Content (VTEC) (in red) during the last week at three locations:
a) in the northern part of Europe(N 61deg E 5deg)
b) above Brussels(N 50.5deg, E 4.5 deg)
c) in the southern part of Europe(N 36 deg, E 5deg)
This top figure also shows (in grey) the normal ionospheric behaviour expected based on the median VTEC from the 15 previous days.
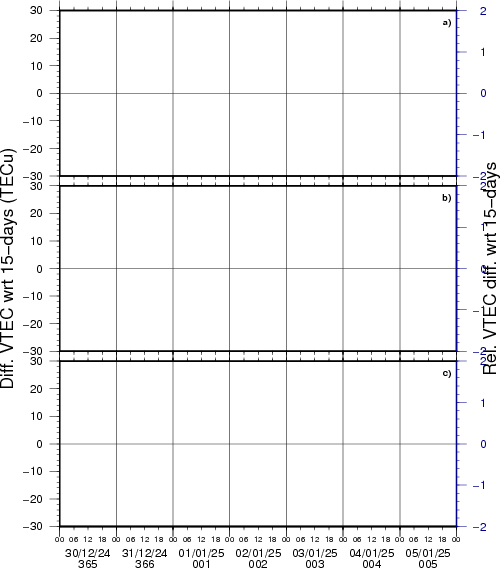
The time series below shows the VTEC difference (in green) and relative difference (in blue) with respect to the median of the last 15 days in the North, Mid (above Brussels) and South of Europe. It thus illustrates the VTEC deviation from normal quiet behaviour.
The VTEC is expressed in TECu (with TECu=10^16 electrons per square meter) and is directly related to the signal propagation delay due to the ionosphere (in figure: delay on GPS L1 frequency).
The Sun's radiation ionizes the Earth's upper atmosphere, the ionosphere, located from about 60km to 1000km above the Earth's surface.The ionization process in the ionosphere produces ions and free electrons. These electrons perturb the propagation of the GNSS (Global Navigation Satellite System) signals by inducing a so-called ionospheric delay.
See http://stce.be/newsletter/GNSS_final.pdf for some more explanations; for more information, see https://gnss.be/SpaceWeather
The SIDC Space Weather Briefing (30 Dec 2024 - 5 Jan 2025)
The forecaster on duty presented the SIDC briefing that gives an overview of space weather from December 30 to January 5.
The pdf of the presentation can be found here: https://www.stce.be/briefings/20250106_SWbriefing.pdf
Upcoming Activities (30 Dec 2024 - 5 Jan 2025)
Courses, seminars and presentations with the Sun-Space-Earth system and Space Weather as the main theme. We provide occasions to get submerged in our world through educational, informative and instructive activities.
* Jan 28-30, 2025, Role of the ionosphere and space weather in military communications, Brussels, Belgium - Full - register for the waiting list: https://events.spacepole.be/event/208/
* Feb 5, 2025, 14h, STCE Seminar: Tropospheric ozone trends from harmonized ground-based measurements, RMI Conference Room
* Mar 17-18, 2025, Inleiding tot het ruimteweer, enkel voor leden van volkssterrenwachten, Brussels, Belgium - Full
* Mar 24, 2025, STCE Lecture From Physics to Forecasting, ESA Academy's Space Weather Training Course
* April 28-30, 2025, STCE Space Weather Introductory Course, Brussels, Belgium - register: https://events.spacepole.be/event/214/
* May 26-27, 2025, STCE Course Space Weather impacts on aviation, online - register: https://events.spacepole.be/event/215/
* Jun 23-25, 2025, STCE Space Weather Introductory Course, Brussels, Belgium - register: https://events.spacepole.be/event/216/
* Sep 15-16, 2025, STCE Course Space Weather impacts on aviation, online - register: https://events.spacepole.be/event/218/
* Nov 17-19, 2025, STCE Space Weather Introductory Course, Brussels, Belgium - register: https://events.spacepole.be/event/217/
To register for a course and check the seminar details, navigate to the STCE Space Weather Education Center: https://www.stce.be/SWEC
If you want your event in the STCE newsletter, contact us: stce_coordination at stce.be
Website: https://www.stce.be/SWEC