- Table of Content
- 1.A stretched ou...
- 2.Kids investiga...
- 3.Review of spac...
- 4.Noticeable Sol...
- 5.Geomagnetic Ob...
- 6.The SIDC space...
- 7.PROBA2 Observa...
- 8.International ...
- 9.Review of Iono...
- 10.STCE Courses a...
2. Kids investigating the Sun
3. Review of space weather
4. Noticeable Solar Events
5. Geomagnetic Observations in Belgium
6. The SIDC space Weather Briefing
7. PROBA2 Observations (6 Jan 2025 - 12 Jan 2025)
8. International Sunspot Number by SILSO
9. Review of Ionospheric Activity
10. STCE Courses and seminars
A stretched out filament
Solar prominences are clouds of charged particles ("plasma") above the solar surface squeezed between regions of opposite magnetic polarity. Being cooler and denser than the plasma underneath and their surroundings, they appear as bright blobs when seen near the solar limb and as dark lines when seen on the solar disk (then they are called "filaments"). Special filters are required to observe these features, such as in the Hydrogen-alpha (H-alpha) line in the red part of the solar spectrum (656,28 nm), or in some extreme ultraviolet (EUV) passbands such as GOES/SUVI 195. Filaments are structures that only survive by the stability of the surrounding magnetic fields. Hence, longer filaments (from about 20 degrees in length onwards) are prone to erupt. Indeed, as the magnetic regions suspending the filament may become unstable, the filament can erupt and throw a cloud of ionized particles towards the Earth where it can cause geomagnetic disturbances. These eruptions are more likely to occur as the filament grows longer, typically around 200.000 km. Such long filaments usually develop outside sunspot groups.
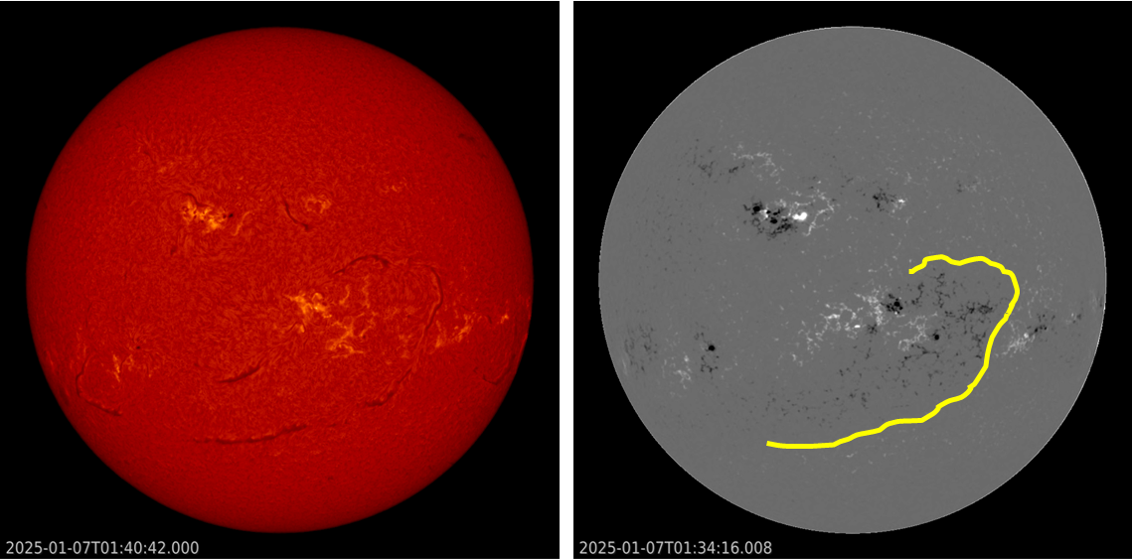
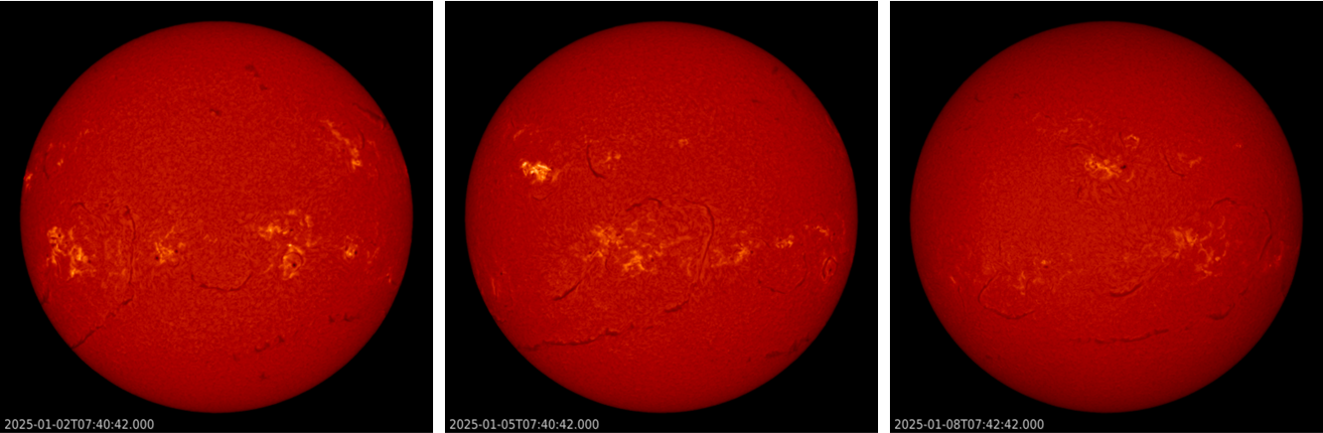
The above imagery shows the Sun's chromosphere ("inner atmosphere" ; left, with off-disk features removed) and the corresponding magnetogram (right) on 7 January. The magnetogram has the outline of the filament added in yellow, such that one can see how this structure meanders between the magnetic fields of opposite polarity. Note black is "negative" polarity, with field lines returning into the Sun, while white is "positive" polarity with field lines pointing away from the Sun. While it was transiting the central meridian, the filament's length varied between 1.2 million and 1.4 million km. Such long filaments are not uncommon, with various discussed in previous STCE newsitems (https://www.stce.be/news/203/welcome.html and https://www.stce.be/news/294/welcome.html and https://www.stce.be/node/756 ). The H-alpha images (GONG) underneath show the evolution of the filament on 2, 5 and 8 January. It is so long it takes 4 (four!) days to fully round the Sun's west limb. Curious to see if this filament will survive the Sun's far side transit.
Kids investigating the Sun
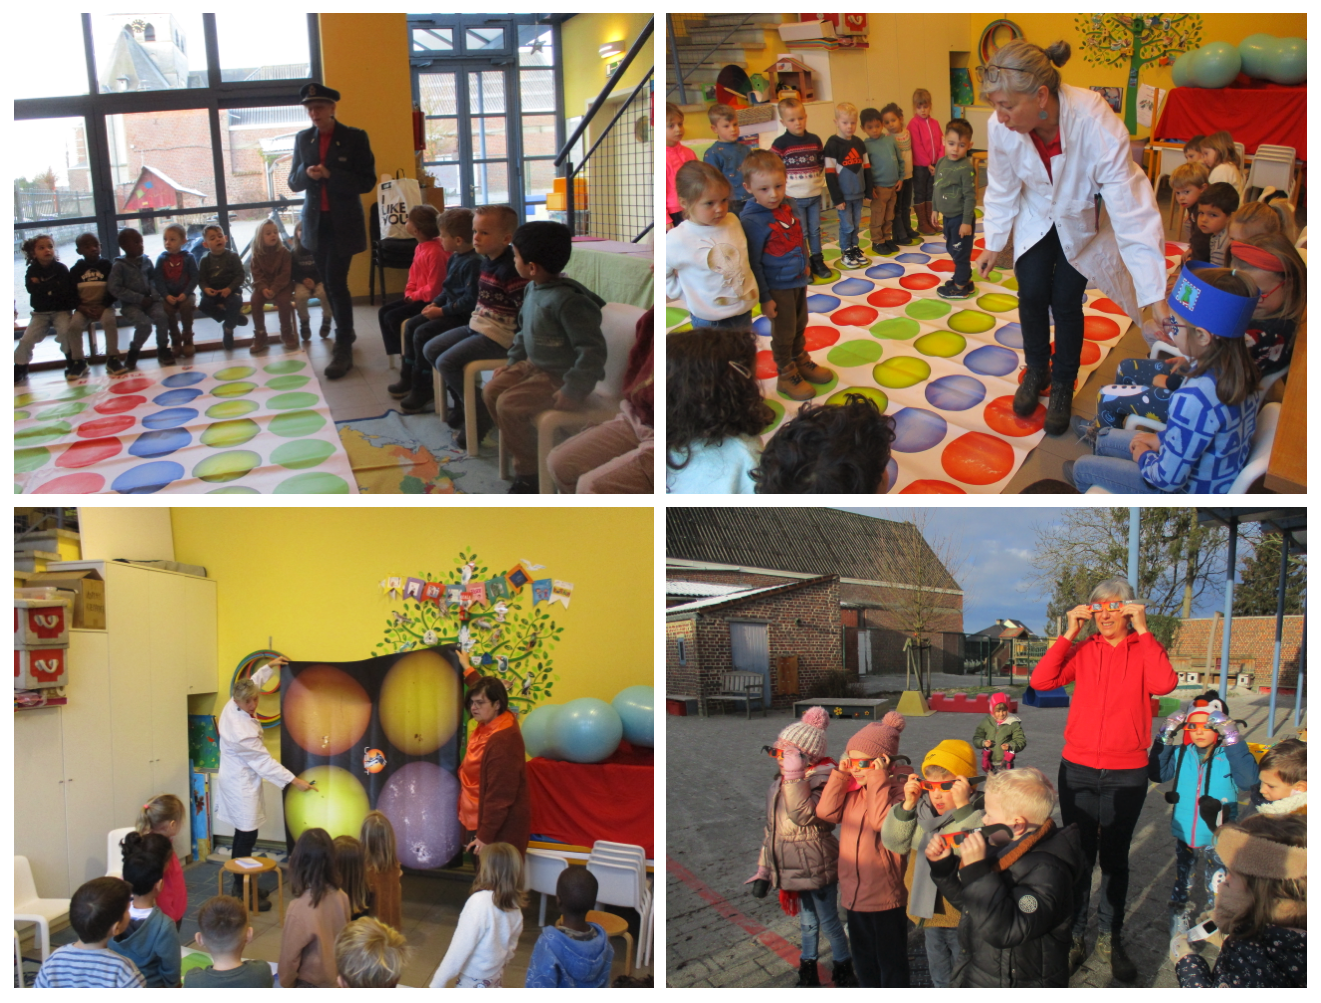
A Tuesday in the Kindergarten 't Okkerzeeltje.
A pilot visits the school. He tells the children from the blue and the red class that there were problems during the flight the day before with the radio link. Pilots use a radio link to talk to pilots in other aircraft or air traffic controllers in the tower at an airport. How was this possible?
Together with a solar scientist, the toddlers investigated and studied the sun. With special binoculars that fly along with satellites, the solar scientist could take pictures of the sun. They even looked with their own eyes at the sun. The sun is so bright that it was visible looking through dark eclipse glasses! The sun must be very strong and energetic. By looking at images of a solar eclipse and of the sun, they discovered that there are 'threads' and spots on the sun. Those threads can get so badly tangled that they break making the spots to explode.
The figured out that it was such a solar storm causing the problems with the radio phone of the pilot. But the sun not only causes problems. It gives warmth on such a cold Tuesday and it also creates the beautiful northern lights.
Review of space weather
Solar Active Regions (ARs) and flares
The solar flaring activity over the past week was low to moderate. An M4.8 flare (SIDC Flare 3226) was the strongest flare. It peaked at 16:24 UTC on January 06 and was associated with SIDC Sunspot Group 360/NOAA Active Region 3947 (beta-gamma-delta). There were over seventeen numbered and several unnumbered active regions on the visible solar disc. The entire week was dominated by activity from SIDC Sunspot Group 360/NOAA Active Region 3947. There was some moderate activity from behind the west limb on January 07 and a C9.8-flare with peak time 06:37 UTC on January 08. This was associated with the magnetically simple region SIDC Sunspot Group 337/NOAA Active Region 3950 (alpha). The solar activity at the end of the week was low with SIDC Sunspot Group 360/NOAA Active Region 3947 (beta-gamma) decreasing in magnetic complexity and becoming less active.
Coronal mass ejections
No clear Earth-directed coronal mass ejections (CMEs) were detected in the available coronagraph imagery. A westward partial halo CME was detected in the LASCO/C2 data starting around 00:12 UTC on January 08. The CME was related to activity behind the west limb and thus not expected to impact the Earth. A filament erupted when it was near the central meridian, around 20 degrees north from the disc centre. The filament was ejected at about 10:30 UTC on January 09. This could be seen in SUVI and SDO/AIA. Data gaps and delay in the chronograph imagery made the analysis of this event challenging. A possibly related faint and weak coronal mass ejection (CME) was observed by LASCO/C2 coronagraph in the UTC morning on January 09. The CME was not expected to notably impact Earth.
Coronal Holes
Several positive and negative polarity coronal holes have crossed the central meridian throughout the week, but no clear signatures of high speed streams related to them were observed in the in situ solar wind data at L1.
Proton flux levels
The greater than 10 MeV proton flux started at slightly enhanced levels due a fading proton event from the previous week. The greater than 10 MeV proton flux returned to nominal levels by the end of January 06.
Electron fluxes at GEO
The greater than 2 MeV electron flux as measured by GOES 16 and GOES 18 was crossing the 1000 pfu threshold on daily basis at the beginning of the week and decreased below the 1000 pfu threshold from January 10 onwards. The corresponding electron fluence started at nominal levels, then increased towards moderate levels and returned back to nominal levels on January 11.
Solar wind at L1
A high speed stream with velocities above 600 km/s passed the L1 point in the beginning of the week. A transient, possibly the glancing blow from the partial halo CME of January 04, was registered in the solar wind data early UTC on January 07 with velocities close to 634 km/s. The solar wind speed then dropped. But between January 09 - January 11, the wind speed picked up again. This could possibly be related to two positive polarity equatorial coronal holes. On January 12, the solar wind speed was again low.
Geomagnetism
The geomagnetic conditions throughout the week were globally quiet to active. Quiet to unsettled geomagnetic conditions were registered locally over Belgium, with two isolated active and several minor storm periods on January 05.
Noticeable Solar Events
| DAY | BEGIN | MAX | END | LOC | XRAY | OP | 10CM | TYPE | Cat | NOAA |
| 06 | 0129 | 0152 | 0208 | N11E30 | M3.1 | 1N | 82 | 3947 | ||
| 06 | 0336 | 0350 | 0354 | N11E31 | M1.4 | 1F | 82 | 3947 | ||
| 06 | 1612 | 1624 | 1630 | M4.8 | II/2IV/1 | 82 | 3947 | |||
| 07 | 2235 | 2305 | 2342 | M1.1 | 3939 | |||||
| 09 | 0018 | 0026 | 0033 | M1.1 | 82 | 3947 | ||||
| 10 | 2229 | 2246 | 2253 | N12W32 | M0.9 | SN | 82 | 3947 |
| LOC: approximate heliographic location | TYPE: radio burst type |
| XRAY: X-ray flare class | Cat: Catania sunspot group number |
| OP: optical flare class | NOAA: NOAA active region number |
| 10CM: peak 10 cm radio flux |
Geomagnetic Observations in Belgium
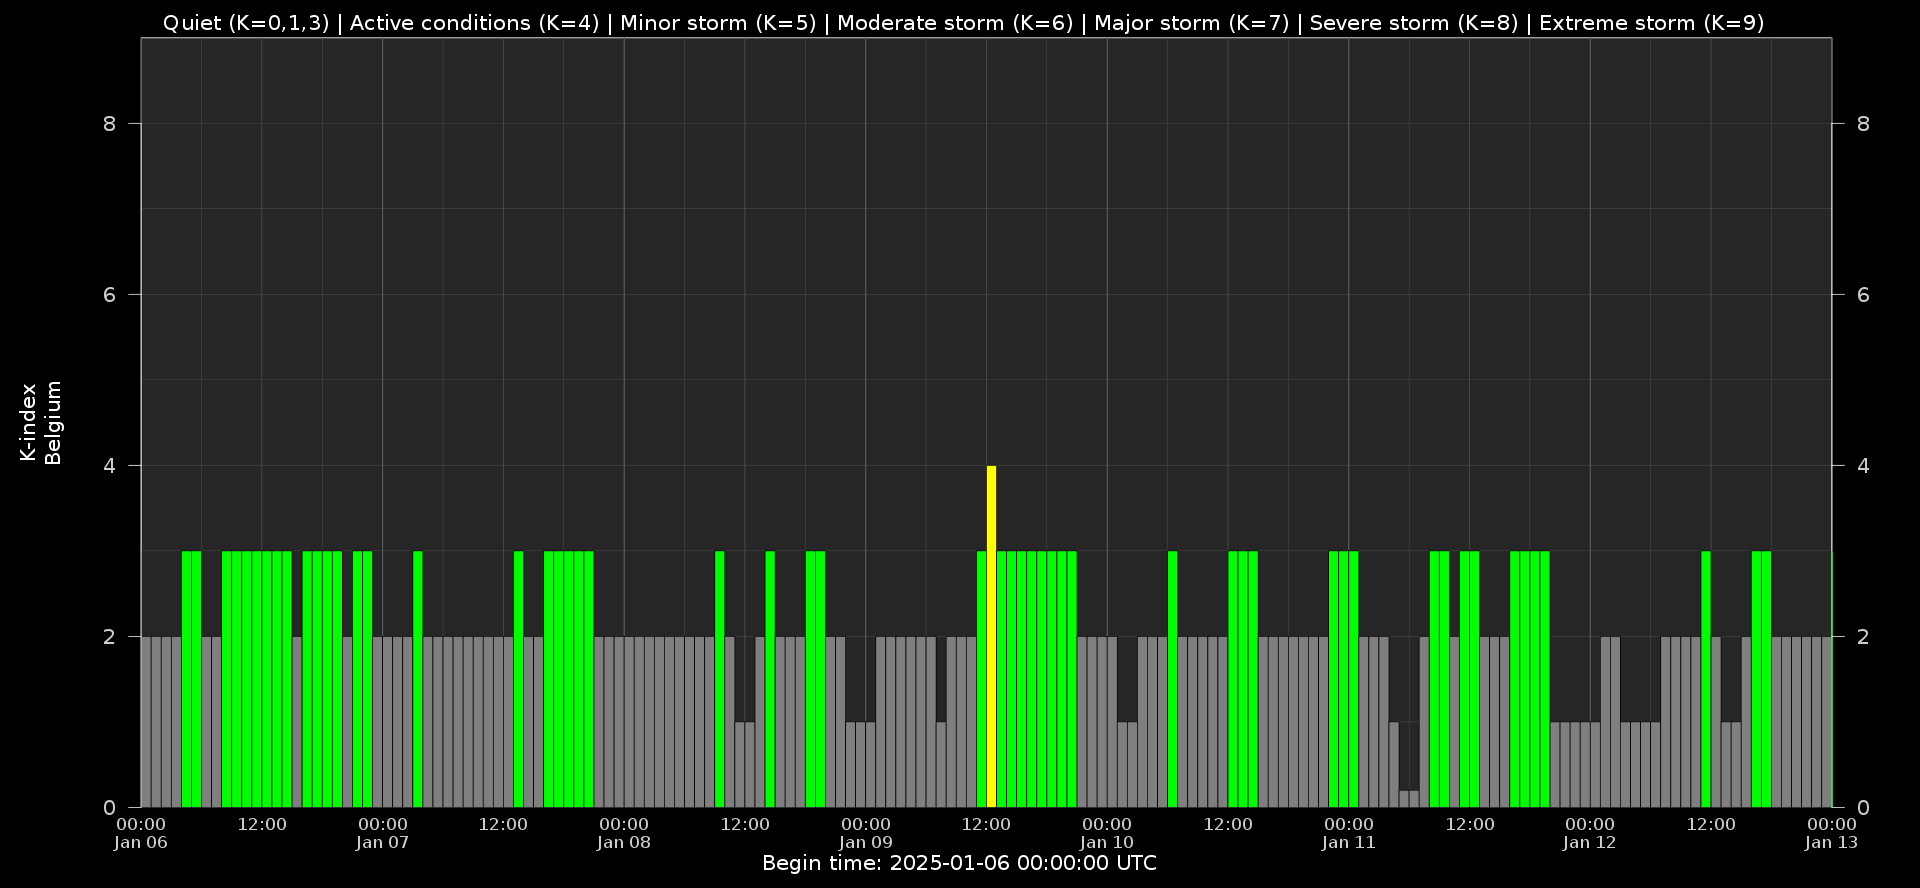
Local K-type magnetic activity index for Belgium based on data from Dourbes (DOU) and Manhay (MAB). Comparing the data from both measurement stations allows to reliably remove outliers from the magnetic data. At the same time the operational service availability is improved: whenever data from one observatory is not available, the single-station index obtained from the other can be used as a fallback system.
Both the two-station index and the single station indices are available here: http://ionosphere.meteo.be/geomagnetism/K_BEL/
The SIDC space Weather Briefing
The Space Weather Briefing of the past week presented by the forecaster on duty.
The pdf of the presentation can be found here: https://www.stce.be/briefings/20250113_SWbriefing.pdf
PROBA2 Observations (6 Jan 2025 - 12 Jan 2025)
Solar Activity
Solar flare activity fluctuated from low to moderate during the week.
In order to view the activity of this week in more detail, we suggest to go to the following website from which all the daily (normal and difference) movies can be accessed: https://proba2.oma.be/ssa
This page also lists the recorded flaring events.
A weekly overview movie (SWAP week 772) can be found here: https://proba2.sidc.be/swap/data/mpg/movies/weekly_movies/weekly_movie_2025_01_06.mp4.
Details about some of this week's events can be found further below.
If any of the linked movies are unavailable they can be found in the P2SC movie repository here: https://proba2.oma.be/swap/data/mpg/movies/.
Monday January 06
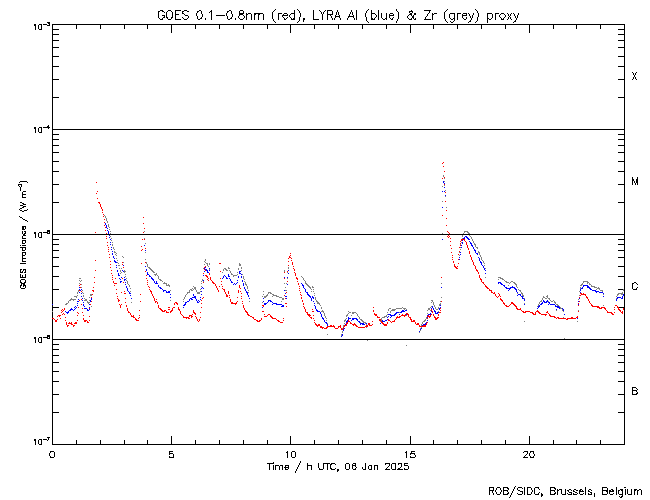
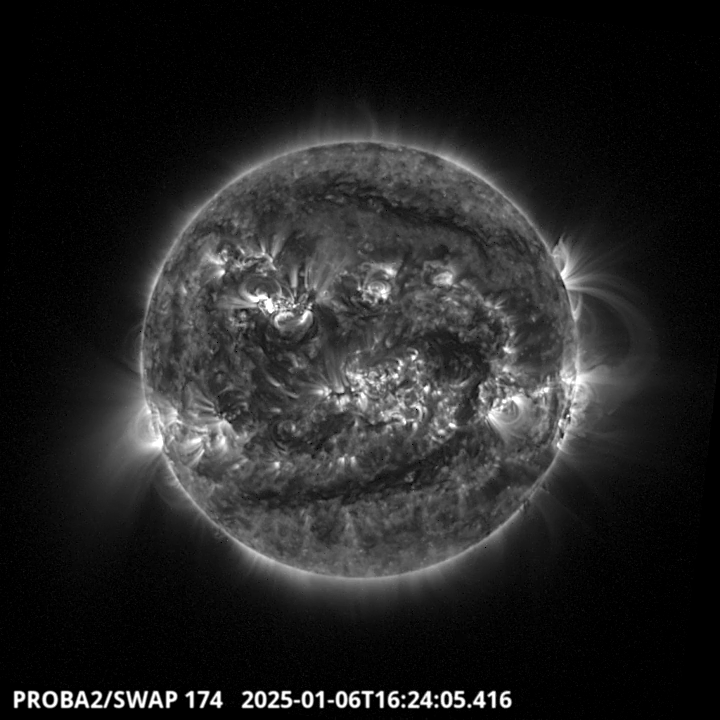
The largest flare of this week was an M4.8, and it was observed by LYRA (top panel) and SWAP (bottom panel). The flare peaked on 2025-Jan-06 at 16:24 UT. It occurred in the north-eastern quadrant of the Sun, originating from active region NOAA3947.
Find a SWAP movie of the event here: https://proba2.sidc.be/swap/movies/20250106_swap_movie.mp4.
International Sunspot Number by SILSO
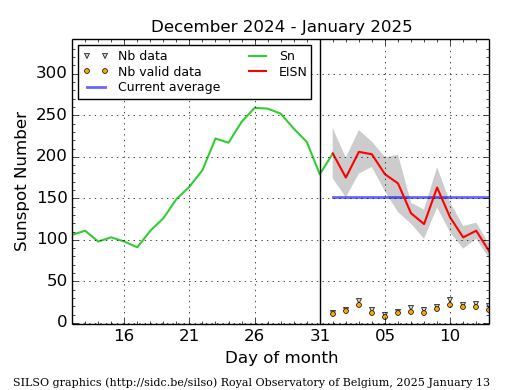
The daily Estimated International Sunspot Number (EISN, red curve with shaded error) derived by a simplified method from real-time data from the worldwide SILSO network. It extends the official Sunspot Number from the full processing of the preceding month (green line), a few days more than one solar rotation. The horizontal blue line shows the current monthly average. The yellow dots give the number of stations that provided valid data. Valid data are used to calculate the EISN. The triangle gives the number of stations providing data. When a triangle and a yellow dot coincide, it means that all the data is used to calculate the EISN of that day.
Review of Ionospheric Activity
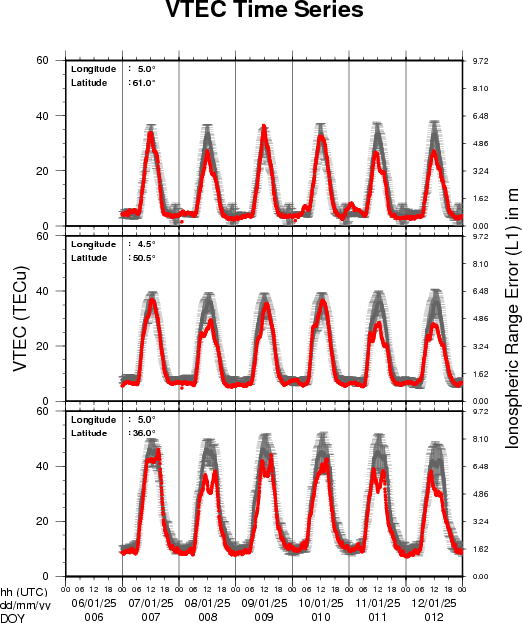
VTEC time series at 3 locations in Europe from 6 Jan 2025 till 12 Jan 2025
The top figure shows the time evolution of the Vertical Total Electron Content (VTEC) (in red) during the last week at three locations:
a) in the northern part of Europe(N 61deg E 5deg)
b) above Brussels(N 50.5deg, E 4.5 deg)
c) in the southern part of Europe(N 36 deg, E 5deg)
This top figure also shows (in grey) the normal ionospheric behaviour expected based on the median VTEC from the 15 previous days.
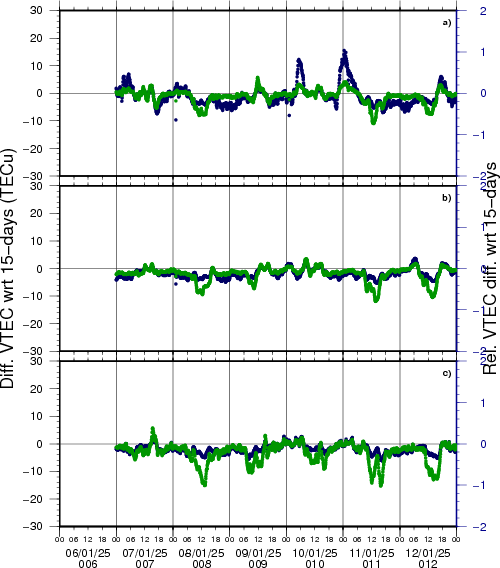
The time series below shows the VTEC difference (in green) and relative difference (in blue) with respect to the median of the last 15 days in the North, Mid (above Brussels) and South of Europe. It thus illustrates the VTEC deviation from normal quiet behaviour.
The VTEC is expressed in TECu (with TECu=10^16 electrons per square meter) and is directly related to the signal propagation delay due to the ionosphere (in figure: delay on GPS L1 frequency).
The Sun's radiation ionizes the Earth's upper atmosphere, the ionosphere, located from about 60km to 1000km above the Earth's surface.The ionization process in the ionosphere produces ions and free electrons. These electrons perturb the propagation of the GNSS (Global Navigation Satellite System) signals by inducing a so-called ionospheric delay.
See http://stce.be/newsletter/GNSS_final.pdf for some more explanations; for more information, see https://gnss.be/SpaceWeather
STCE Courses and seminars
Courses, seminars and presentations with the Sun-Space-Earth system and Space Weather as the main theme. We provide occasions to get submerged in our world through educational, informative and instructive activities.
* Jan 28-30, 2025, Role of the ionosphere and space weather in military communications, Brussels, Belgium - Full - register for the waiting list: https://events.spacepole.be/event/208/
* Feb 5, 2025, 14h, STCE Seminar: Tropospheric ozone trends from harmonized ground-based measurements, RMI Conference Room
* Mar 17-18, 2025, Inleiding tot het ruimteweer, enkel voor leden van volkssterrenwachten, Brussels, Belgium - Full
* Mar 24, 2025, STCE Lecture From Physics to Forecasting, ESA Academy's Space Weather Training Course
* April 28-30, 2025, STCE Space Weather Introductory Course, Brussels, Belgium - register: https://events.spacepole.be/event/214/
* May 26-27, 2025, STCE Course Space Weather impacts on aviation, online - register: https://events.spacepole.be/event/215/
* Jun 23-25, 2025, STCE Space Weather Introductory Course, Brussels, Belgium - register: https://events.spacepole.be/event/216/
* Sep 15-16, 2025, STCE Course Space Weather impacts on aviation, online - register: https://events.spacepole.be/event/218/
* Nov 17-19, 2025, STCE Space Weather Introductory Course, Brussels, Belgium - register: https://events.spacepole.be/event/217/
To register for a course and check the seminar details, navigate to the STCE Space Weather Education Center: https://www.stce.be/SWEC
If you want your event in the STCE newsletter, contact us: stce_coordination at stce.be

Website: https://www.stce.be/SWEC