- Table of Content
- 1.Comet ATLAS
- 2.Topical Issue ...
- 3.Review of spac...
- 4.Noticeable Sol...
- 5.PROBA2 Observa...
- 6.International ...
- 7.Geomagnetic Ob...
- 8.The SIDC Space...
- 9.Review of Iono...
- 10.STCE Courses a...
2. Topical Issue "Severe SWx events of May 2024 and their impacts"
3. Review of space weather
4. Noticeable Solar Events
5. PROBA2 Observations (13 Jan 2025 - 19 Jan 2025)
6. International Sunspot Number by SILSO
7. Geomagnetic Observations in Belgium
8. The SIDC Space Weather Briefing
9. Review of Ionospheric Activity
10. STCE Courses and seminars
Comet ATLAS
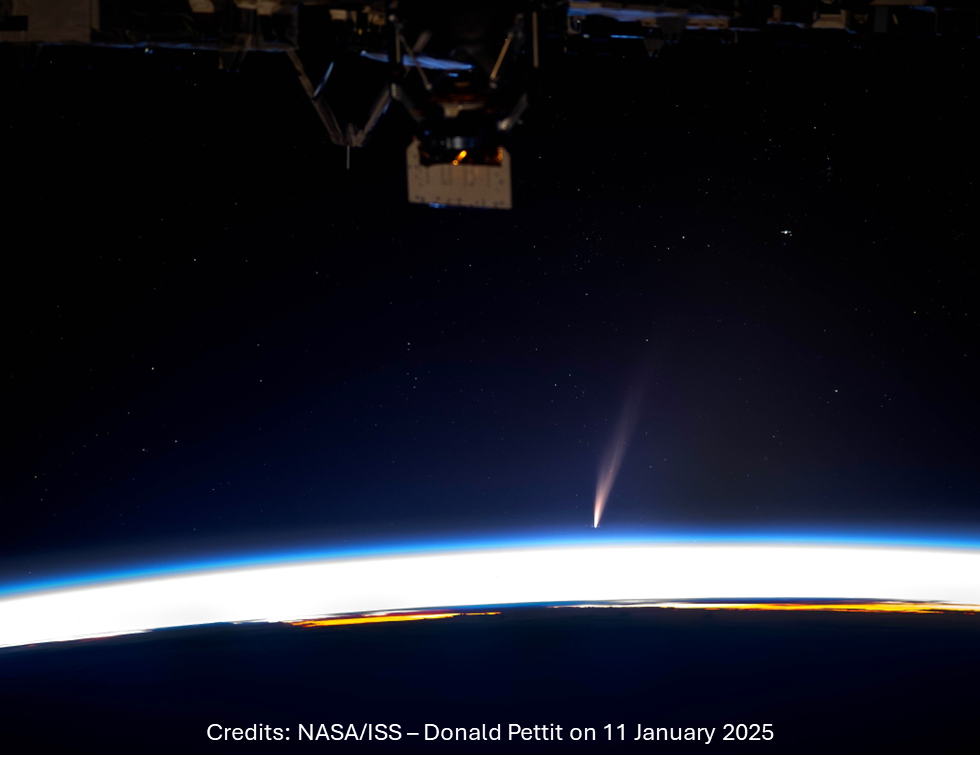
Comets are small bodies of rock, dust and ice that are moving through our solar system. When passing the Sun, these bodies warm and release dust and gas that is visible as a tail. Comet ATLAS C/2024 G3 was discovered by the Asteroid Terrestrial-impact Last Alert System (ATLAS) survey on 5 April 2024, in images obtained with a 0.5-m reflector telescope located in Rio Hurtado, Chile. It made its closest approach to the Sun (called "perihelion") on 13 January 2025. This is a periodic comet with the most recent perihelion passage changing its period from 180.000 years to 600.000 years. Comet ATLAS was photographed on 11 January by Donald Pettit on board the International Space Station. It is currently best visible from the southern hemisphere, but also decreasing in brightness and with hints of a disintegrating nucleus.
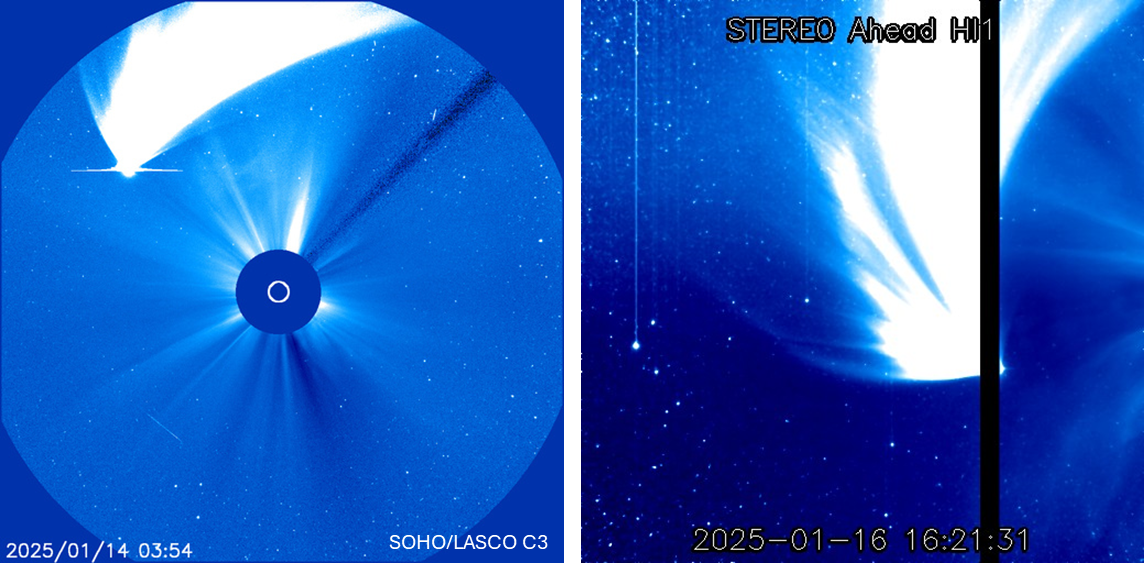
The comet was observed by SOHO (https://soho.nascom.nasa.gov/data/realtime-images.html ) and STEREO-A (https://stereo-ssc.nascom.nasa.gov/beacon/beacon_secchi.shtml ) but only by 2 of their instruments. From 11 to 15 January, it was imaged by SOHO's LASCO/C3 coronagraph (the one with the widest field of view), and from 13 to 17 January it was present in imagery from STEREO-A's Heliospheric Imager 1 (HI1 - see this newsitem at https://www.stce.be/news/581/welcome.html for more details on the HI instruments). STEREO-A is currently leading the Earth by 29 degrees (STEREO Science Center at https://stereo-ssc.nascom.nasa.gov/where.shtml ), and so in these HI1 images the Sun is on the right and out of view, whereas the Earth is on the left and out of view. The bright dot that can be seen on the left is the planet Saturn. The dark vertical band is to avoid saturation of the image due to the bright core of the comet. The detail in the comet's tail is real. Clips are available in the online version of this article at https://www.stce.be/news/745/welcome.html
Topical Issue "Severe SWx events of May 2024 and their impacts"
The Journal of Space Weather and Space Climate (JSWSC - https://www.swsc-journal.org/ ) has extended the deadline for submissions to the Topical Issue "Severe space weather events of May 2024 and their impacts", to 30 April 2025.
The space weather events of May 2024 were in many aspects the strongest of the last two decades, as indicated by comprehensive measurements and impacts recorded worldwide. This series of events was initiated by the solar active region NOAA 3664, which gave rise to numerous large flares, some having exceeded the X5 level, and associated moderately large fast coronal mass ejections (CMEs). Many of them were Earth-directed and several exceeded 1000 km/s launch speed.
Due to the rapid succession and varying launch speeds, several CMEs merged and interacted as they travelled through the interplanetary medium, leading to enhanced effects on the Earth's space environment. They gave rise to a geomagnetic storm commencing on 10 May which rose to the G5 level persisting through subsequent days with observable auroras at low magnetic latitudes (well below 50°) in both hemispheres.
These space weather conditions resulted in strong radio blackouts, a moderate solar energetic particle event, including GLE 74 early on 11 May 2024, and radiation-belt enhancements throughout the following days.
Reports from around the globe suggest impacts on critical national infrastructures. Also, a degradation of GNSS systems' performance was clearly seen across several countries.
This topical issue welcomes submissions focusing on these events, across various domains which include, but are not limited to, observations, simulations/modeling, and impacts, that cover all aspects of these severe space weather events throughout the first half of May 2024.
The Topical Editor-in-Chief is Jaroslav Urbář (urbar(at)ufa.cas.cz) from the Institute of Atmospheric Physics (CAS) of the Czech Republic. Manuscripts must be submitted via the JSWSC online submission tool. Guidelines (https://www.swsc-journal.org/author-information/instructions-for-authors ) for submission of papers are found on the JSWSC website under the tab "Instruction for Authors". The deadline for submissions (https://www.swsc-journal.org/topical-issues-open-for-submission ) is now 30 April 2025.
Review of space weather
Solar Active Regions (ARs) and flares
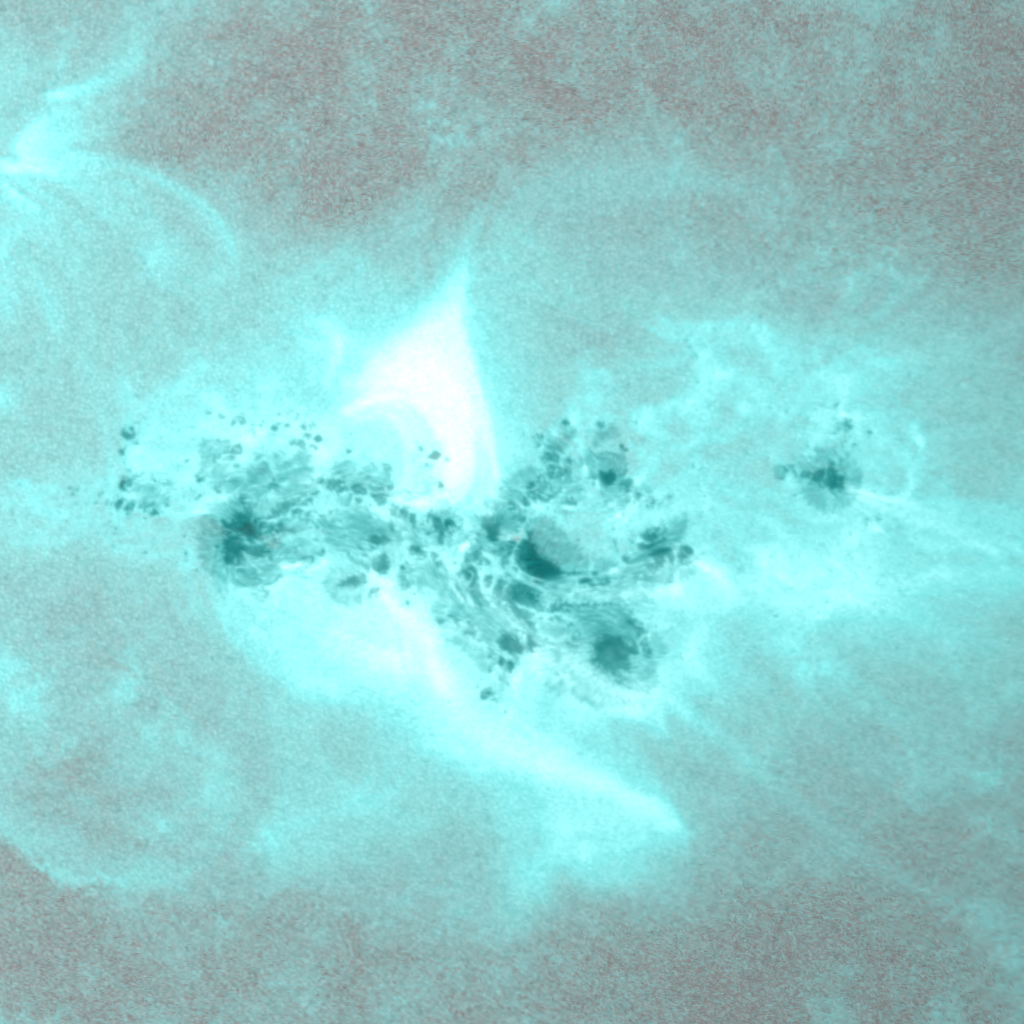
Solar flaring activity was low at the beginning of the week, but became moderate to high towards the end of the week. There were a total number of 15 active regions observed on the visible solar disk over the week. A total of 54 C-class flares and 11 M-class flares were observed. The largest flare was a M7.4 flare, peaking on 17 January at 13:35 UTC, which was produced by NOAA Active Region 3964 (beta-gamma). NOAA AR 3964 was the most active and produced almost all of the M-class flares this week. The SDO images underneath show the Sun's full disk in white light (sunspot groups; left) and in extreme ultraviolet (SDO/AIA 094; right) near the peak of the M7 flare on 17 January. The flare is the bright flash on the right in the EUV image.

Coronal mass ejections
During the past week, no CME (coronal mass ejection) with an Earth directed component was observed.
Coronal holes
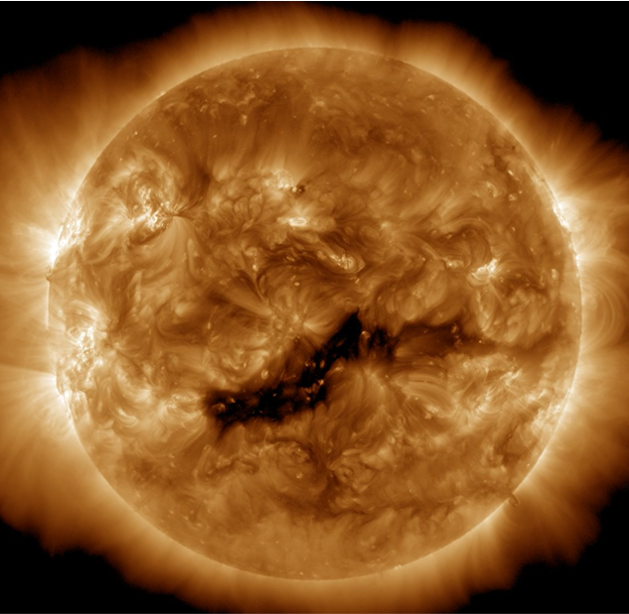
During the past week, one large east-west elongated negative polarity equatorial coronal hole (CH) crossed the central meridian in the southern hemisphere between 13 and 17 January. The CH can be seen underneath in the extreme ultraviolet image taken by the Solar Dynamics Observatory (SDO/AIA 193) on 15 January.
Proton flux levels
The greater than 10 MeV GOES proton flux was below the 10 pfu threshold for the entire week.
Electron fluxes at GEO
The greater than 2 MeV electron flux as measured by GOES 16 remained below the 1000 pfu threshold. The 24h electron fluence was at nominal levels.
Solar wind
The solar wind at Earth was mainly slow during the week, except on 17 January and the beginning of 18 January when the solar wind at Earth was under the influence of the high speed stream of the coronal hole. The solar wind ranged between 284 and 610 km/s and the interplanetary magnetic field was between 4 and 11 nT, and with the Bz reaching a minimum value of -10 nT.
Geomagnetism
Geomagnetic conditions were both globally and locally quiet to unsettled, but with some short periods of active conditions (Kp = 4) over the week.
Noticeable Solar Events
| DAY | BEGIN | MAX | END | LOC | XRAY | OP | 10CM | TYPE | Cat | NOAA |
| 17 | 0201 | 0211 | 0217 | M1.3 | 3964 | |||||
| 17 | 0308 | 0320 | 0334 | M1.1 | VI/2III/1 | 3961 | ||||
| 17 | 0910 | 0919 | 0923 | M2.0 | 3964 | |||||
| 17 | 1119 | 1137 | 1149 | M1.5 | 3964 | |||||
| 17 | 1324 | 1335 | 1339 | M7.4 | CTM/1 | 3964 | ||||
| 17 | 1842 | 1850 | 1904 | N8W33 | M2.1 | SN | 3964 | |||
| 17 | 1944 | 1949 | 1955 | N7W32 | M1.8 | S | III/1 | 3964 | ||
| 17 | 1959 | 2001 | 2002 | N6W29 | M1.1 | SF | 3964 | |||
| 17 | 2200 | 2205 | 2214 | N8W34 | M1.0 | 1 | CTM/2III/1 | 3964 | ||
| 18 | 0044 | 0058 | 0103 | N11W32 | M1.7 | SN | VI/2 | 3964 | ||
| 18 | 0300 | 0307 | 0315 | N11W32 | M1.1 | 1N | 3964 | |||
| 19 | 0328 | 0332 | 0336 | M2.4 | 3964 |
| LOC: approximate heliographic location | TYPE: radio burst type |
| XRAY: X-ray flare class | Cat: Catania sunspot group number |
| OP: optical flare class | NOAA: NOAA active region number |
| 10CM: peak 10 cm radio flux |
PROBA2 Observations (13 Jan 2025 - 19 Jan 2025)
Solar Activity
Solar flare activity fluctuated from low to moderate during the week.
In order to view the activity of this week in more detail, we suggest to go to the following website from which all the daily (normal and difference) movies can be accessed: https://proba2.oma.be/ssa
This page also lists the recorded flaring events.
A weekly overview movie (SWAP week 773) can be found here: https://proba2.sidc.be/swap/data/mpg/movies/weekly_movies/weekly_movie_2025_01_13.mp4.
Details about some of this week's events can be found further below.
If any of the linked movies are unavailable they can be found in the P2SC movie repository here: https://proba2.oma.be/swap/data/mpg/movies/.
Friday January 17
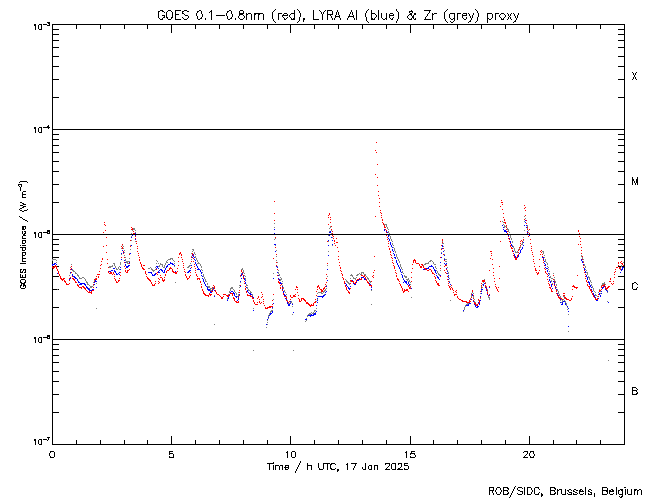
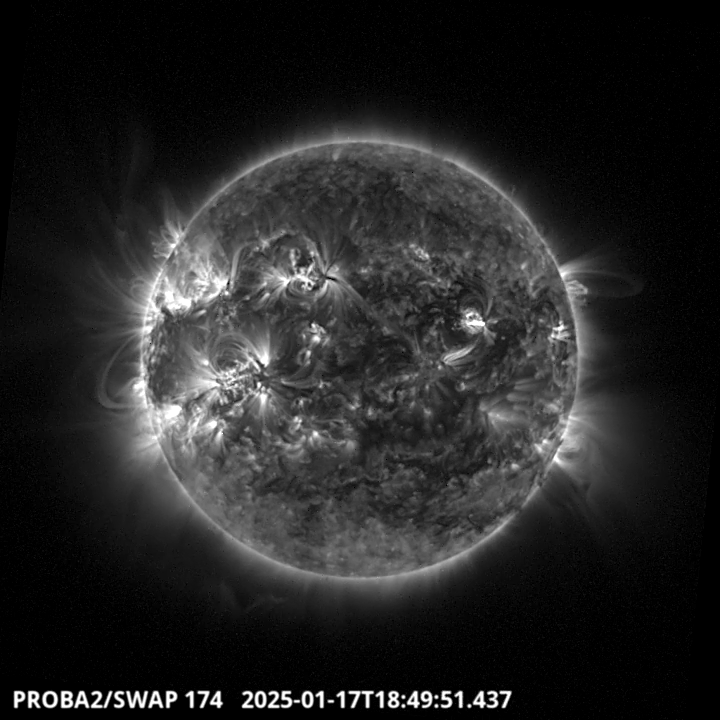
The largest flare of this week was an M7.4 (from active region NOAA3964) on 2025-Jan-17, but it was not observed by PROBA2 due to an orbital occultation. The largest flare observed by LYRA (top) and by SWAP (bottom) was an M2.1. The flare peaked on 2025-Jan-17 at 18:50 UT. It occurred close to the equator in the western hemisphere, originating from AR NOAA3964.
Find a SWAP movie of the event here: https://proba2.sidc.be/swap/movies/20250117_swap_movie.mp4.
International Sunspot Number by SILSO
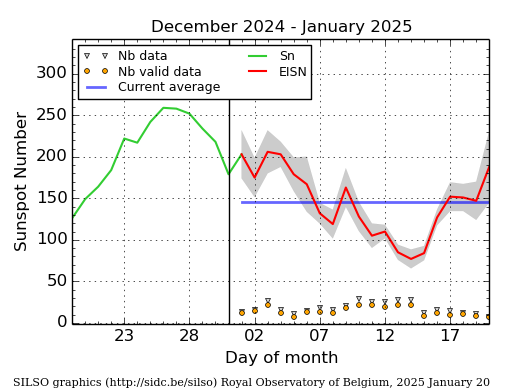
The daily Estimated International Sunspot Number (EISN, red curve with shaded error) derived by a simplified method from real-time data from the worldwide SILSO network. It extends the official Sunspot Number from the full processing of the preceding month (green line), a few days more than one solar rotation. The horizontal blue line shows the current monthly average. The yellow dots give the number of stations that provided valid data. Valid data are used to calculate the EISN. The triangle gives the number of stations providing data. When a triangle and a yellow dot coincide, it means that all the data is used to calculate the EISN of that day.
Geomagnetic Observations in Belgium
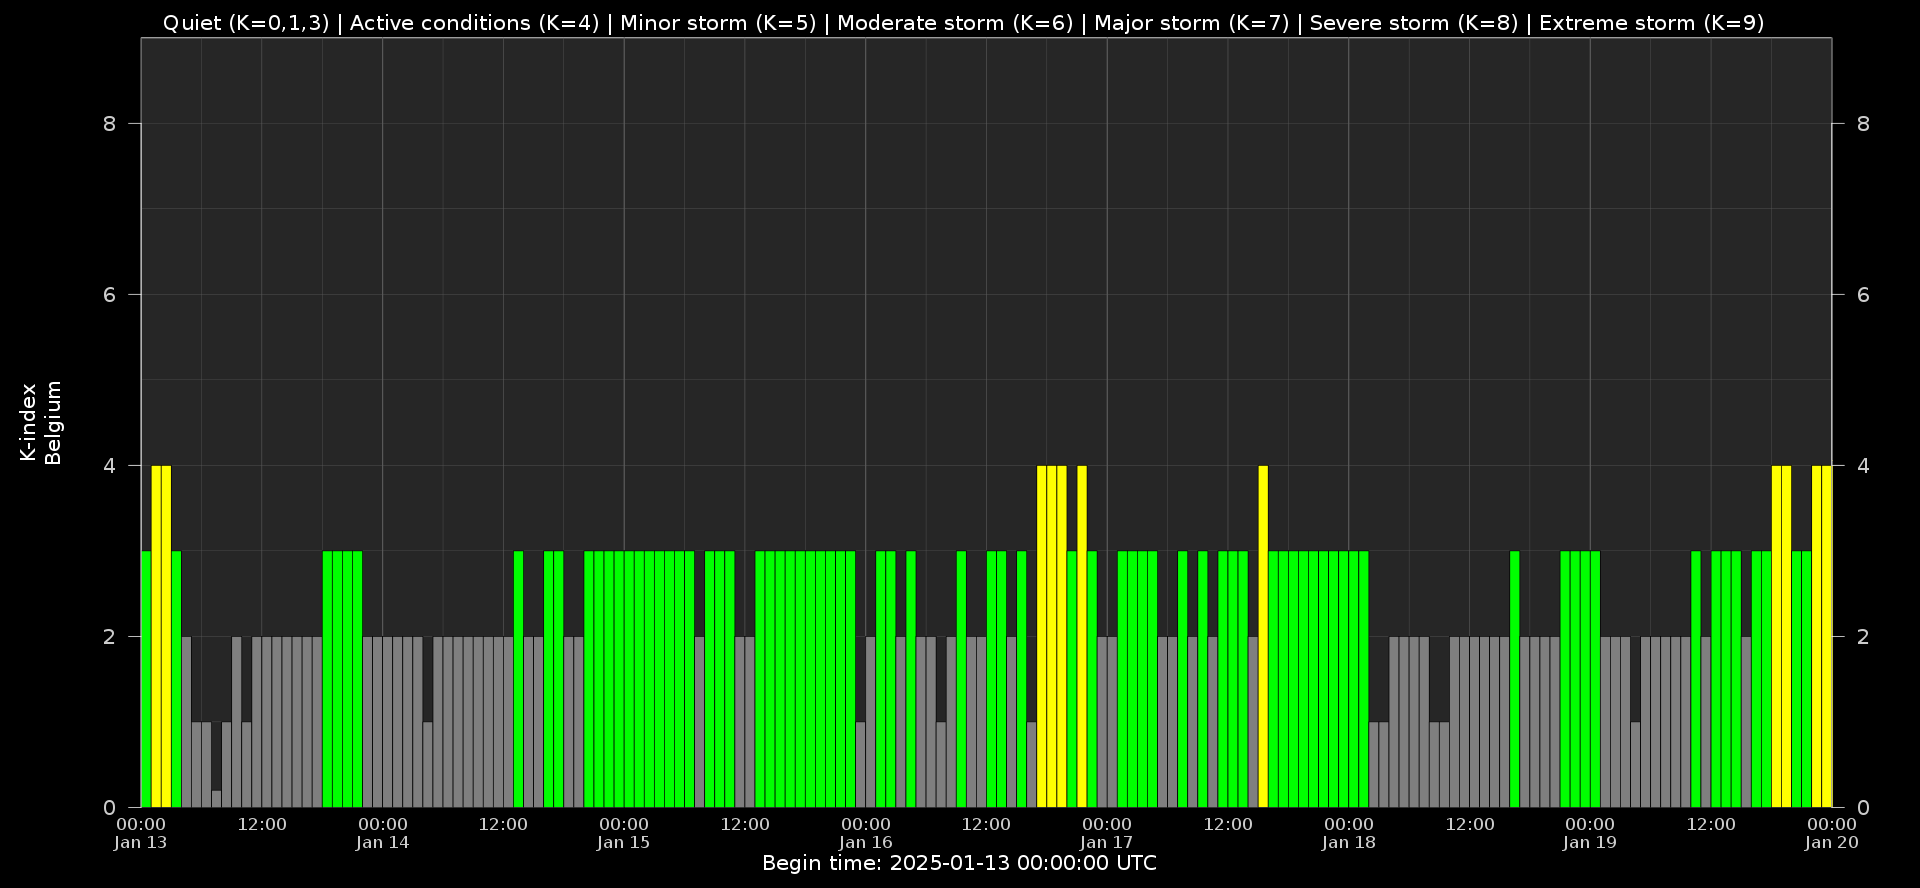
Local K-type magnetic activity index for Belgium based on data from Dourbes (DOU) and Manhay (MAB). Comparing the data from both measurement stations allows to reliably remove outliers from the magnetic data. At the same time the operational service availability is improved: whenever data from one observatory is not available, the single-station index obtained from the other can be used as a fallback system.
Both the two-station index and the single station indices are available here: http://ionosphere.meteo.be/geomagnetism/K_BEL/
The SIDC Space Weather Briefing
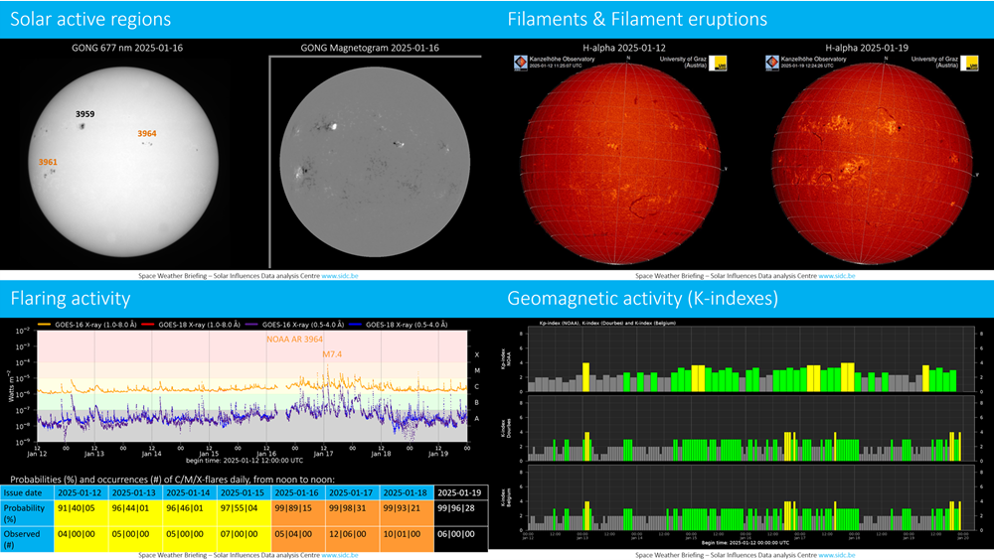
The Space Weather Briefing of the past week presented by the forecaster on duty.
The pdf of the presentation can be found here: https://www.stce.be/briefings/20250120_SWbriefing.pdf
Review of Ionospheric Activity
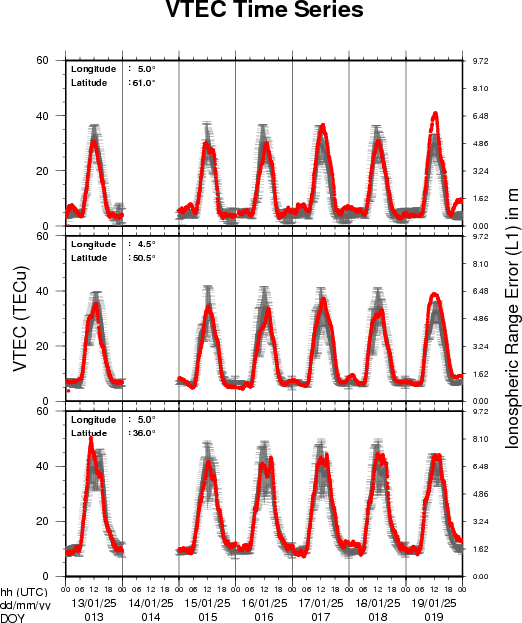
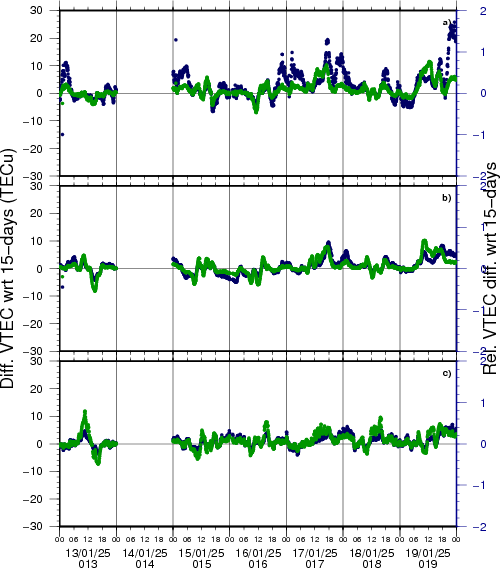
VTEC time series at 3 locations in Europe from 13 Jan 2025 till 19 Jan 2025
The top figure shows the time evolution of the Vertical Total Electron Content (VTEC) (in red) during the last week at three locations:
a) in the northern part of Europe(N 61deg E 5deg)
b) above Brussels(N 50.5deg, E 4.5 deg)
c) in the southern part of Europe(N 36 deg, E 5deg)
This top figure also shows (in grey) the normal ionospheric behaviour expected based on the median VTEC from the 15 previous days.
The time series below shows the VTEC difference (in green) and relative difference (in blue) with respect to the median of the last 15 days in the North, Mid (above Brussels) and South of Europe. It thus illustrates the VTEC deviation from normal quiet behaviour.
The VTEC is expressed in TECu (with TECu=10^16 electrons per square meter) and is directly related to the signal propagation delay due to the ionosphere (in figure: delay on GPS L1 frequency).
The Sun's radiation ionizes the Earth's upper atmosphere, the ionosphere, located from about 60km to 1000km above the Earth's surface.The ionization process in the ionosphere produces ions and free electrons. These electrons perturb the propagation of the GNSS (Global Navigation Satellite System) signals by inducing a so-called ionospheric delay.
See http://stce.be/newsletter/GNSS_final.pdf for some more explanations; for more information, see https://gnss.be/SpaceWeather
STCE Courses and seminars
Courses, seminars and presentations with the Sun-Space-Earth system and Space Weather as the main theme. We provide occasions to get submerged in our world through educational, informative and instructive activities.
* Jan 28-30, 2025, Role of the ionosphere and space weather in military communications, Brussels, Belgium - Full - register for the waiting list: https://events.spacepole.be/event/208/
* Feb 5, 2025, 14h, STCE Seminar: Tropospheric ozone trends from harmonized ground-based measurements, RMI Conference Room
* Mar 17-18, 2025, Inleiding tot het ruimteweer, enkel voor leden van volkssterrenwachten, Brussels, Belgium - Full
* Mar 24, 2025, STCE Lecture: From Physics to Forecasting, ESA Academy's Space Weather Training Course
* Apr 28-30, 2025, STCE Space Weather Introductory Course, Brussels, Belgium - register: https://events.spacepole.be/event/214/
* May 26-27, 2025, STCE Course Space Weather impacts on aviation, online - register: https://events.spacepole.be/event/215/
* Jun 23-25, 2025, STCE Space Weather Introductory Course, Brussels, Belgium - register: https://events.spacepole.be/event/216/
* Sep 15-16, 2025, STCE Course Space Weather impacts on aviation, online - register: https://events.spacepole.be/event/218/
* Nov 17-19, 2025, STCE Space Weather Introductory Course, Brussels, Belgium - register: https://events.spacepole.be/event/217/
To register for a course and check the seminar details, navigate to the STCE Space Weather Education Center: https://www.stce.be/SWEC
If you want your event in the STCE newsletter, contact us: stce_coordination at stce.be
