- Table of Content
- 1.Topical Issue ...
- 2.Space Weather ...
- 3.Review of sola...
- 4.International ...
- 5.Noticeable Sol...
- 6.PROBA2 Observa...
- 7.Geomagnetic Ob...
- 8.The SIDC Space...
- 9.Review of Iono...
- 10.STCE courses a...
2. Space Weather and the ionosphere
3. Review of solar activity
4. International Sunspot Number by SILSO
5. Noticeable Solar Events
6. PROBA2 Observations (20 Jan 2025 - 26 Jan 2025)
7. Geomagnetic Observations in Belgium
8. The SIDC Space Weather Briefing
9. Review of Ionospheric Activity
10. STCE courses and seminars
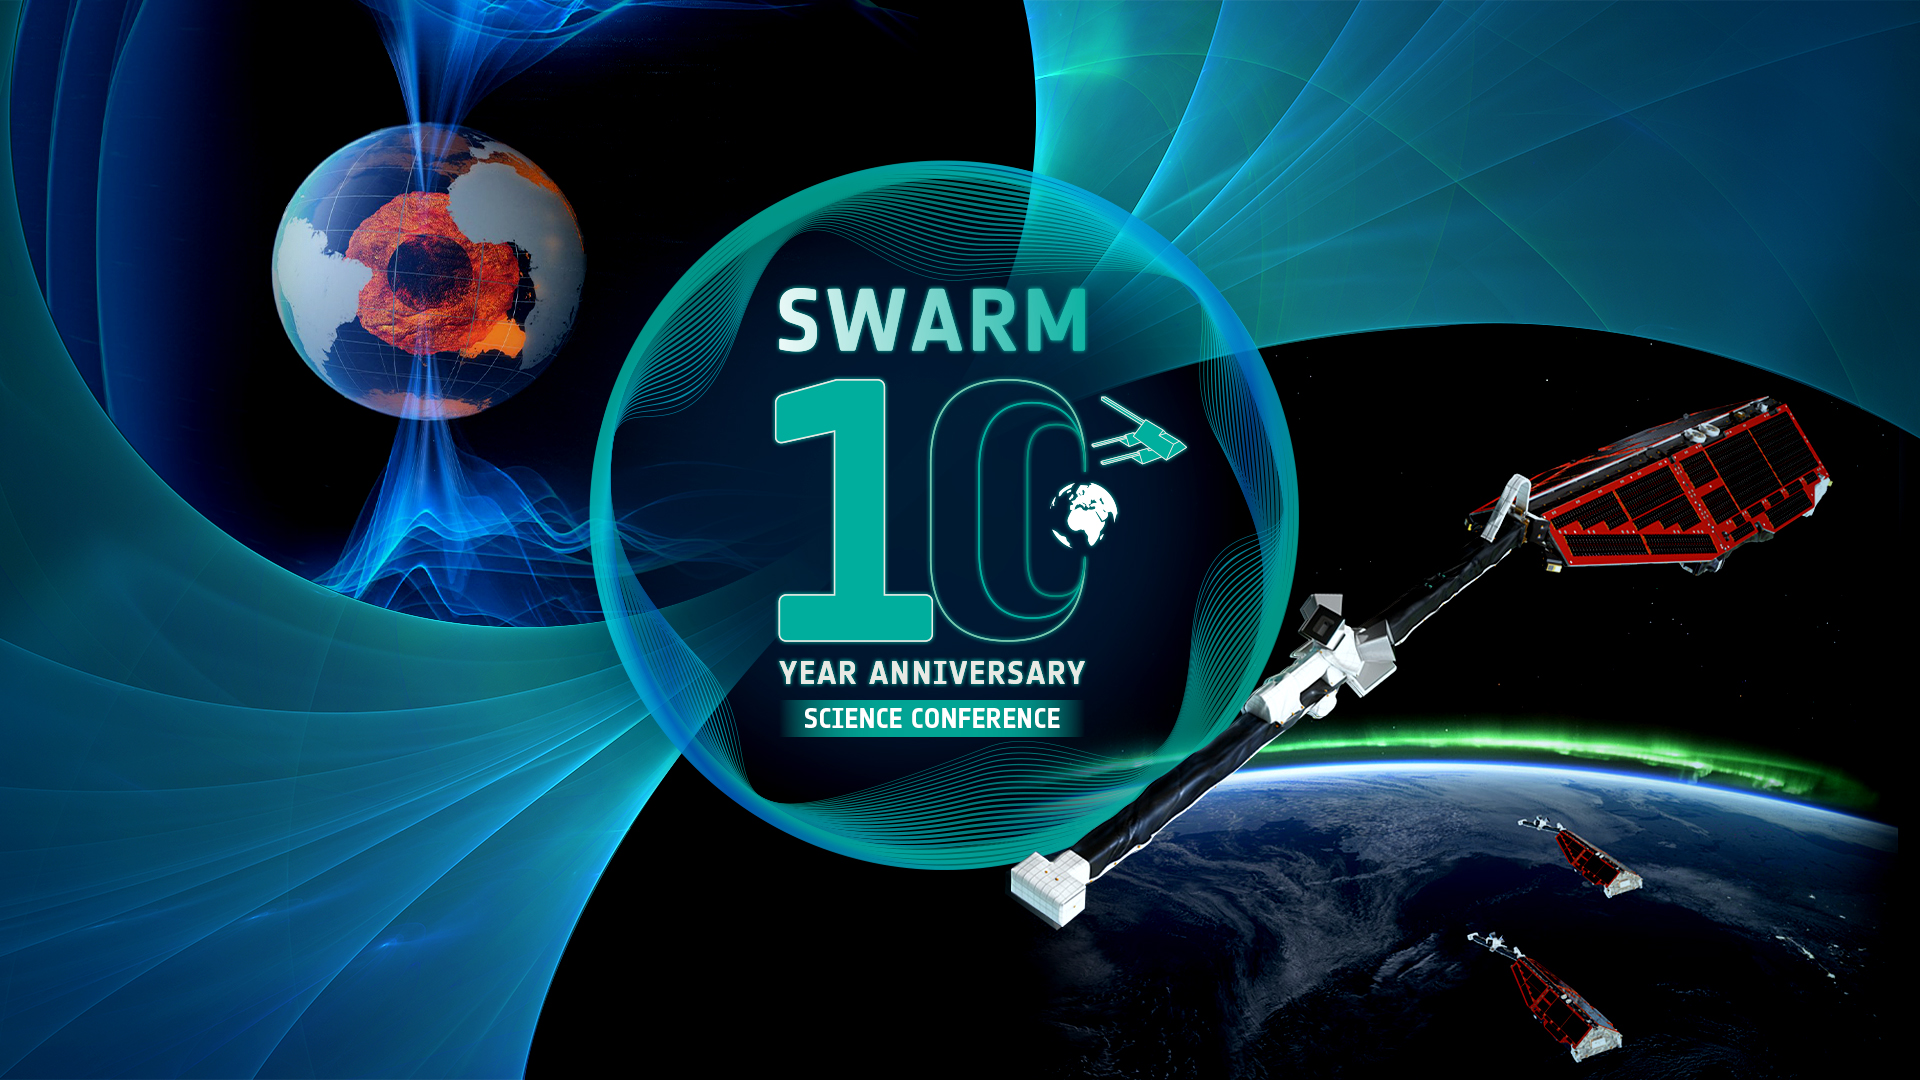
Topical Issue "Swarm 10-Year Anniversary"
The Journal of Space Weather and Space Climate (JSWSC) has extended the deadline for submissions to the Topical Issue "Swarm 10-Year Anniversary" to 15 April 2025.
The topical issue (TI) is dedicated to new results from ESA's Swarm mission, in particular to investigations of the Magnetosphere-Ionosphere Coupling, Ionospheric and Thermospheric processes, and their implications for Space Weather, including potential impacts on critical infrastructure. This issue seeks to bring together cutting-edge studies that shed light on the quiet-time and dynamic ionosphere, including the study of Alfvén waves, Equatorial Spread-F events, plasma bubbles, ULF plasma waves, Field-Aligned Currents etc.
Swarm is ESA's first constellation mission for Earth Observation. The mission consists of three identical satellites, A(lpha), B(ravo), and C(harlie), which were launched on 22 November 2013 into a low altitude (about 500 km) near-polar orbit. Swarm is dedicated to creating a highly detailed survey of Earth's geomagnetic field and its temporal evolution, complemented by electric field and neutral atmosphere observations in the topside ionosphere-thermosphere. After an initial nominal mission of four years, until November 2017, Swarm was granted two four-year extensions, with an option to further extend the mission, possibly towards covering two solar cycles. Swarm data presents an invaluable opportunity to validate, refine, and augment existing knowledge in the upper atmosphere domain.
While this Topical Issue arises from the Swarm 10-year anniversary conference in April 2024 (https://www.swarm-anniversary-and-science.org/ ), contributions are not limited to participants of the conference. The TI is open to all submissions that fit its scope. Submissions focusing on the near-Earth space science performed with Swarm, including external fields (e.g. magnetosphere-ionosphere-thermosphere coupling, quiet-time ionosphere, dynamic ionosphere etc.) and space weather aspects, are strongly encouraged. The integration of observations and models is particularly welcomed, fostering a deeper understanding of ionospheric physics within the context of space weather.
The Topical Editor-in-Chief is Georgios Balasis (gbalasis(at)noa.gr) from the National Observatory of Athens (NOA) in Greece. Manuscripts must be submitted via the JSWSC online submission tool (https://www.editorialmanager.com/jswsc/ ). Guidelines for submission of papers are found on the JSWSC website under the tab "Instruction for Authors" (https://www.swsc-journal.org/author-information/instructions-for-authors ). The deadline for submissions (https://www.swsc-journal.org/topical-issues-open-for-submission ) is now 15 April 2025.
Space Weather and the ionosphere
Ionograms, plasma frequency, plasma bubbels, equatorial ionisation anomaly, refraction, neutral gas, space weather phenomena and 8 people eager to learn all about the magical ionosphere. resulted in 3 informal but intense teaching days.
We have already plans for a next course on the role of the ionosphere and space weather in military communications.
Thanks to Tobias, Christophe, Jan, Dries, Olivier, Antonio, Jean-Marie, Yana and Elke for making this happen.

The course: https://events.spacepole.be/event/208/
Review of solar activity
Solar Active Regions (ARs) and flares
The solar flaring activity was low to moderate. There were 12 numbered active regions on the visible solar disk which produced more than 80 C-class flares and 3 M-class flares. The largest flare was a M3.3 flare peaking at 10:39 UTC on Jan 21 from SIDC Sunspot Group 347 (NOAA Active Region 3967). During the flare, SIDC Sunspot Group 347 had a beta configuration of its photospheric magnetic field. SIDC Sunspot Groups 346 and 378 (NOAA Active Regions 3961 and 3964) were the most complex regions with beta-gamma-delta magnetic configurations. At the end of the week, 8 sunspot groups were visible on the solar disk.
Coronal mass ejections
A coronal mass ejection (CME) was observed on STEREO-A/SECCHI coronograph images at 10:53 UTC on Jan 21. This CME was the result of an eruptive filament at the time and location of the M3.3 flare. A type II radio burst, a coronal dimming and EUV wave were observed. The CME had a projected width of about 110 deg and a projected speed of about 700 km/s. With its main component in the SE direction, a glancing blow was expected to influence the Earth on Jan 24, but it was not detected at Earth.
A partial halo CME was observed on SOHO/LASCO-C2 images at 11:36 UTC on Jan 22. This CME was associated with a M1.3 flare, which peaked at 11:08 UTC on Jan 22, produced by SIDC Sunspot Group 346 (NOAA Active Region 3961, S16 W15) and the filament eruptions near the same AR. Again, a type type II radio burst, coronal dimming and an EUV wave were observed. The CME had a projected speed of about 600 km/s. It was expected to impact the Earth on Jan 25, but it was not detected at Earth.
Two CMEs in the solar W limb were seen on SOHO/LASCO-C2 images on Jan 25. First one was seen at 03:24 UTC and second one at 17:48 UTC on Jan 25. These CMEs were related to C-class flaring and jets from NOAA AR 3961 (S11 W66 and S11 W78). They had a projected width of about 110 deg, and a projected speed of about 420 km/s and 800 km/s, respectively. Another faint and slow partial halo CME originated from the same AR on Jan 24. Apart from these CMEs, there were few other narrow and faint CMEs from the same AR.
Coronal Holes
No coronal hole crossing the central solar meridian was observed during the past week.
Proton flux levels
The 10 MeV proton flux remained below the 10 pfu threshold level over the past week.
Electron fluxes at GEO
The greater than 2 MeV electron flux measured by the GOES-16 satellite, remained mostly below the 1000 pfu threshold level over the past week, except during some intervals on Jan 20, Jan 22, and Jan 23 , when it slightly exceeded the threshold level. The greater than 2 MeV electron flux measured by the GOES-18 satellite, was above the 1000 pfu threshold level during the later part each day.
Solar wind
At the beginning of the week, Earth was still under the influence of a high speed stream (HSS) from the elongated, negative polarity coronal hole which crossed the central meridian on Jan 17. The solar wind speed rose up to 710 km/s, the interplanetary magnetic field (IMF) increased up to 10 nT, and Bz component decreased to -10 nT. It returned to slow solar wind conditions on Jan 24 and remained so for the rest of the week. At the end of the week, the solar wind speed was around 300 km/s and the IMF was around 3 nT.
Geomagnetism
At the start of the week, the magnetosphere of Earth reached active conditions (NOAA Kp and K_BEL 4), both on the global and local (over Belgium) scale, due to the impact of high speed stream from the coronal hole which crossed the central meridian on Jan 17. It decreased to unsettled conditions (Kp and K_BEL 3) on Jan 20 globally and on Jan 21 locally. It was quiet (Kp and K_BEL 1 to 2) at the end of the week.
International Sunspot Number by SILSO
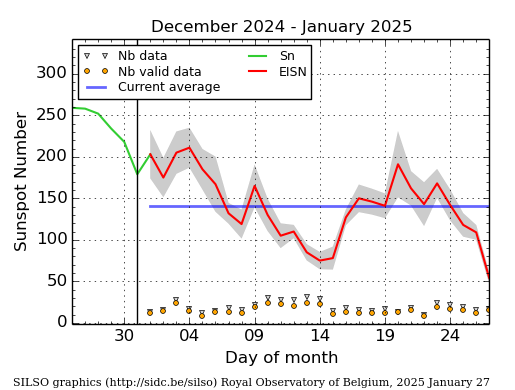
The daily Estimated International Sunspot Number (EISN, red curve with shaded error) derived by a simplified method from real-time data from the worldwide SILSO network. It extends the official Sunspot Number from the full processing of the preceding month (green line), a few days more than one solar rotation. The horizontal blue line shows the current monthly average. The yellow dots give the number of stations that provided valid data. Valid data are used to calculate the EISN. The triangle gives the number of stations providing data. When a triangle and a yellow dot coincide, it means that all the data is used to calculate the EISN of that day.
Noticeable Solar Events
| DAY | BEGIN | MAX | END | LOC | XRAY | OP | 10CM | TYPE | Cat | NOAA |
| 21 | 1008 | 1039 | 1100 | S19E23 | M3.3 | SF | VI/2II/2III/1 | 9 | 3967 | |
| 22 | 1044 | 1108 | 1135 | S12W12 | M1.3 | 1F | III/1II/2 | 2 | 3961 | |
| 24 | 2048 | 2104 | 2117 | S4W67 | M2.7 | 1F | III/2 | 2 | 3961 |
| LOC: approximate heliographic location | TYPE: radio burst type |
| XRAY: X-ray flare class | Cat: Catania sunspot group number |
| OP: optical flare class | NOAA: NOAA active region number |
| 10CM: peak 10 cm radio flux |
PROBA2 Observations (20 Jan 2025 - 26 Jan 2025)
Solar Activity
Solar flare activity fluctuated from low to moderate during the week.
In order to view the activity of this week in more detail, we suggest to go to the following website from which all the daily (normal and difference) movies can be accessed: https://proba2.oma.be/ssa
This page also lists the recorded flaring events.
A weekly overview movie (SWAP week 774) can be found here: https://proba2.sidc.be/swap/data/mpg/movies/weekly_movies/weekly_movie_2025_01_20.mp4.
Details about some of this week's events can be found further below.
If any of the linked movies are unavailable they can be found in the P2SC movie repository here: https://proba2.oma.be/swap/data/mpg/movies/.
Tuesday January 21
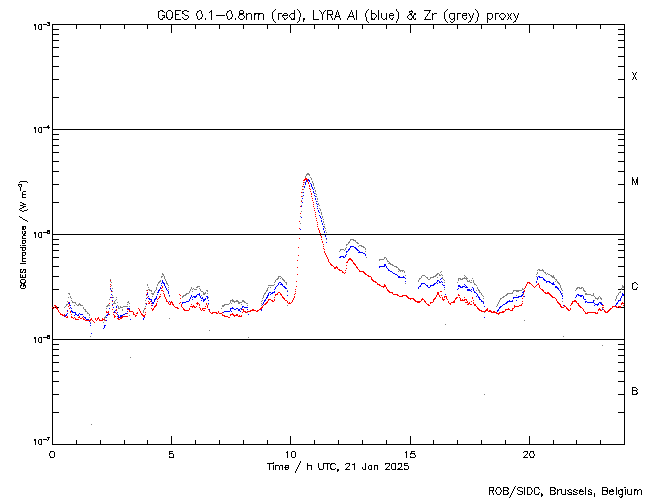
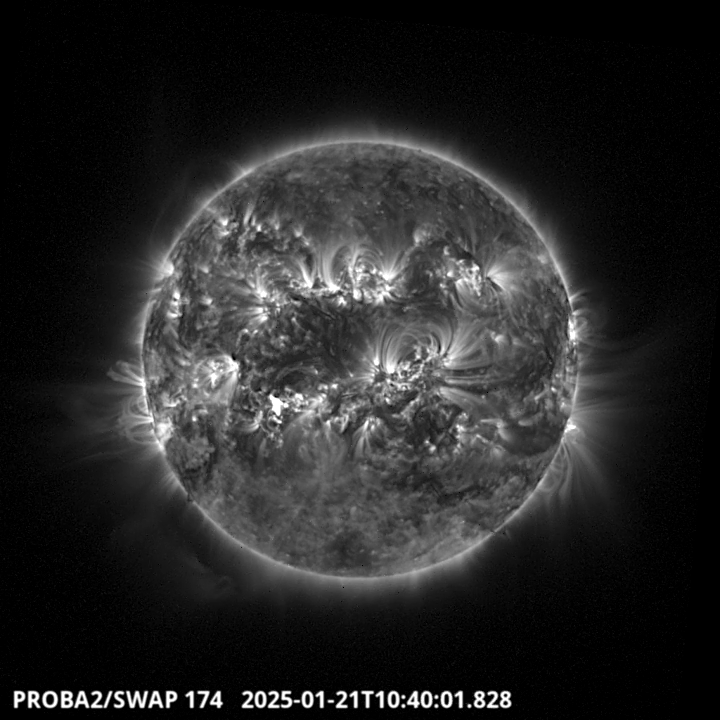
The largest flare of this week was an M3.3, and it was observed by LYRA (top panel) and SWAP (bottom panel). The flare peaked on 2025-Jan-21 at 10:39 UT. It occurred in the south-eastern quadrant of the Sun, originating from active region NOAA3967.
Find a SWAP movie of the event here: https://proba2.sidc.be/swap/movies/20250121_swap_movie.mp4.
Geomagnetic Observations in Belgium
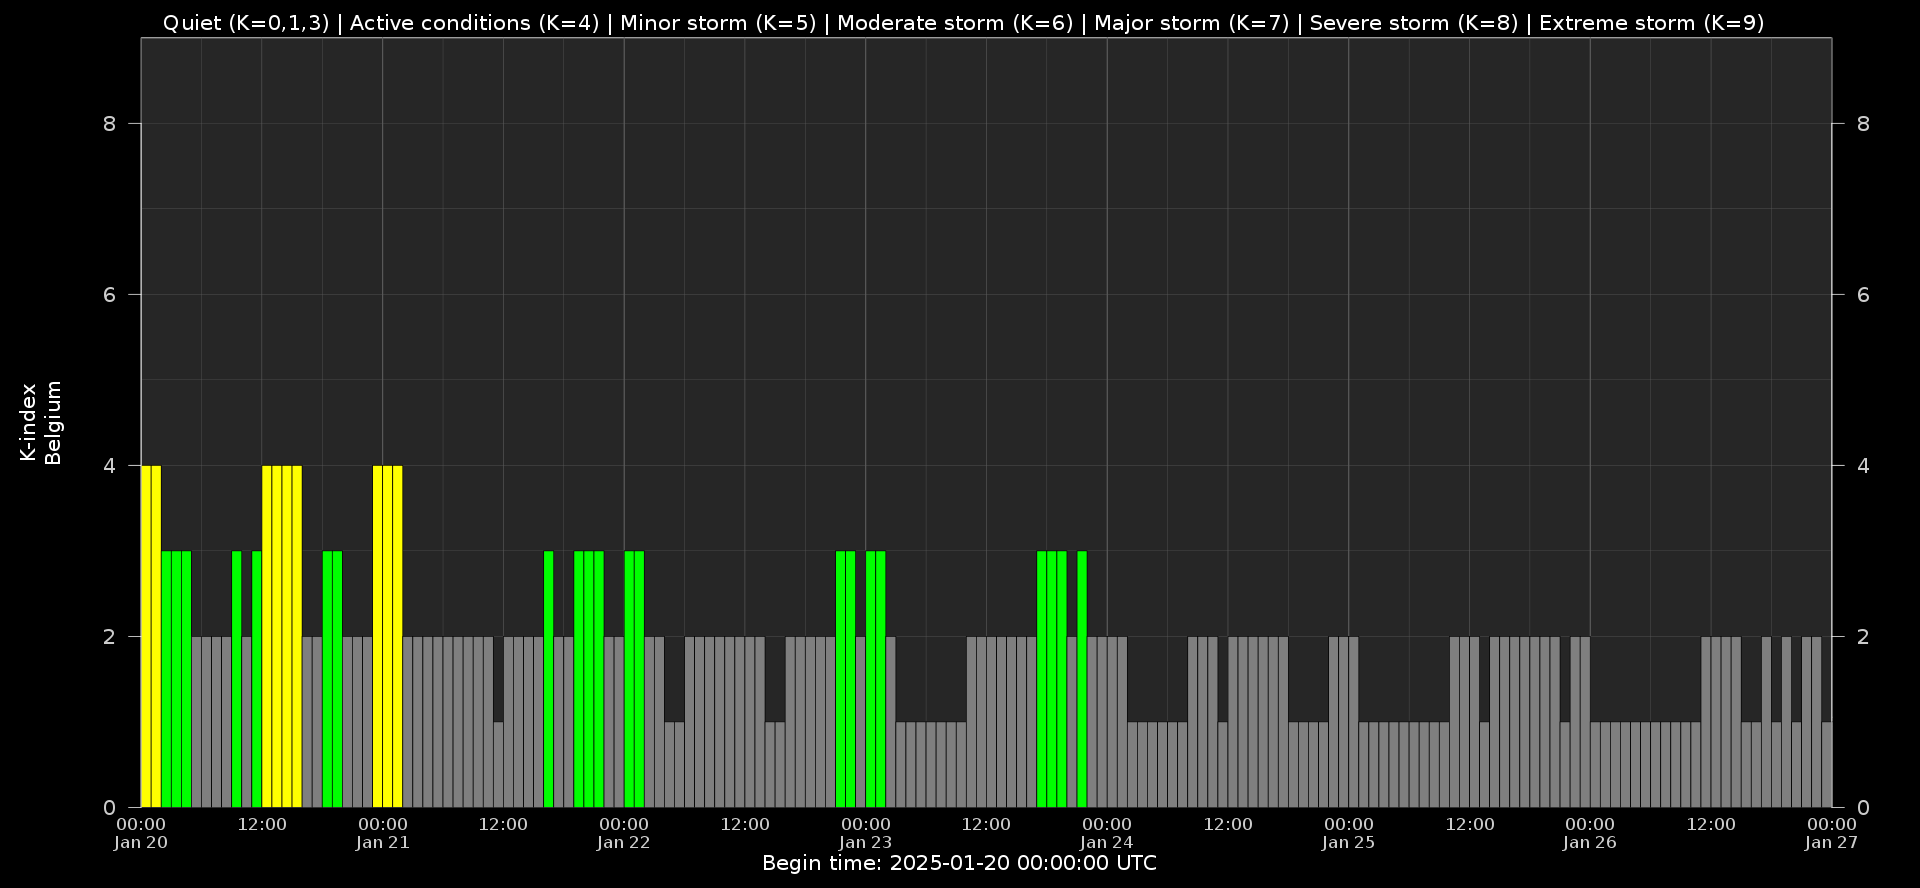
Local K-type magnetic activity index for Belgium based on data from Dourbes (DOU) and Manhay (MAB). Comparing the data from both measurement stations allows to reliably remove outliers from the magnetic data. At the same time the operational service availability is improved: whenever data from one observatory is not available, the single-station index obtained from the other can be used as a fallback system.
Both the two-station index and the single station indices are available here: http://ionosphere.meteo.be/geomagnetism/K_BEL/
The SIDC Space Weather Briefing
The Space Weather Briefing presented by the forecaster on duty from 19 to 26 January.
The pdf of the presentation can be found here: https://www.stce.be/briefings/20250127_SWbriefing.pdf
Review of Ionospheric Activity
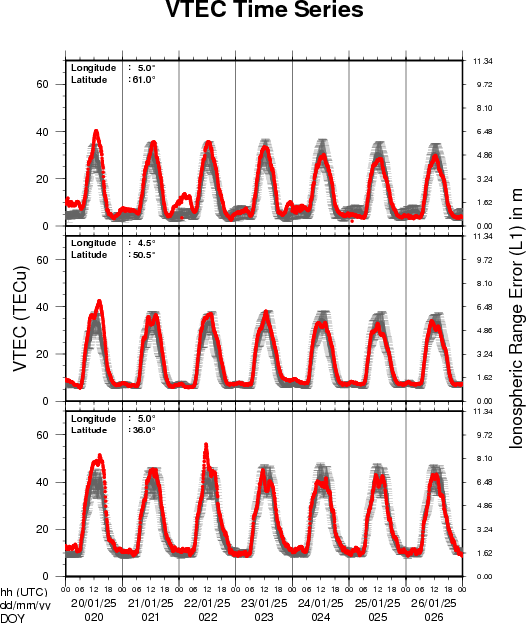
VTEC time series at 3 locations in Europe from 20 Jan 2025 till 26 Jan 2025
The top figure shows the time evolution of the Vertical Total Electron Content (VTEC) (in red) during the last week at three locations:
a) in the northern part of Europe(N 61deg E 5deg)
b) above Brussels(N 50.5deg, E 4.5 deg)
c) in the southern part of Europe(N 36 deg, E 5deg)
This top figure also shows (in grey) the normal ionospheric behaviour expected based on the median VTEC from the 15 previous days.
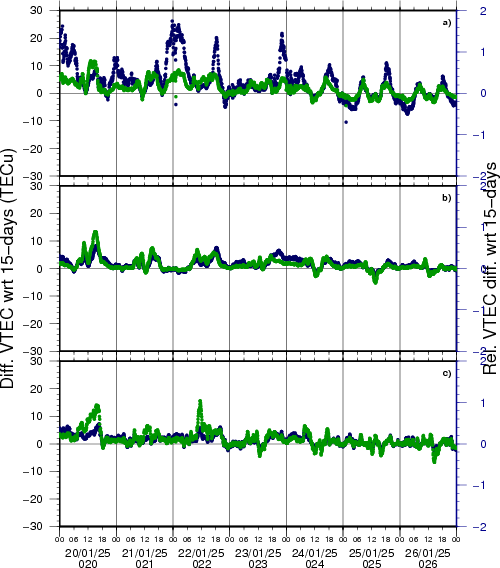
The time series below shows the VTEC difference (in green) and relative difference (in blue) with respect to the median of the last 15 days in the North, Mid (above Brussels) and South of Europe. It thus illustrates the VTEC deviation from normal quiet behaviour.
The VTEC is expressed in TECu (with TECu=10^16 electrons per square meter) and is directly related to the signal propagation delay due to the ionosphere (in figure: delay on GPS L1 frequency).
The Sun's radiation ionizes the Earth's upper atmosphere, the ionosphere, located from about 60km to 1000km above the Earth's surface.The ionization process in the ionosphere produces ions and free electrons. These electrons perturb the propagation of the GNSS (Global Navigation Satellite System) signals by inducing a so-called ionospheric delay.
See http://stce.be/newsletter/GNSS_final.pdf for some more explanations; for more information, see https://gnss.be/SpaceWeather
STCE courses and seminars
Courses, seminars and presentations with the Sun-Space-Earth system and Space Weather as the main theme. We provide occasions to get submerged in our world through educational, informative and instructive activities.
* Feb 5, 2025, 14h, STCE Seminar: Tropospheric ozone trends from harmonized ground-based measurements, RMI Conference Room
* Mar 17-18, 2025, Inleiding tot het ruimteweer, enkel voor leden van volkssterrenwachten, Brussels, Belgium - Full
* Mar 24, 2025, STCE Lecture From Physics to Forecasting, ESA Academy's Space Weather Training Course
* April 28-30, 2025, STCE Space Weather Introductory Course, Brussels, Belgium - register: https://events.spacepole.be/event/214/
* May 26-27, 2025, STCE Course Space Weather impacts on aviation, online - register: https://events.spacepole.be/event/215/
* Jun 23-25, 2025, STCE Space Weather Introductory Course, Brussels, Belgium - register: https://events.spacepole.be/event/216/
* Sep 15-16, 2025, STCE Course Space Weather impacts on aviation, online - register: https://events.spacepole.be/event/218/
* Nov 17-19, 2025, STCE Space Weather Introductory Course, Brussels, Belgium - register: https://events.spacepole.be/event/217/
To register for a course and check the seminar details, navigate to the STCE Space Weather Education Center: https://www.stce.be/SWEC
If you want your event in the STCE newsletter, contact us: stce_coordination at stce.be

Website: https://www.stce.be/SWEC