- Table of Content
- 1.A flock of sun...
- 2.Eight PITHIA-N...
- 3.Review of sola...
- 4.International ...
- 5.PROBA2 Observa...
- 6.Noticeable Sol...
- 7.Geomagnetic Ob...
- 8.Review of Iono...
- 9.The SIDC Space...
- 10.Upcoming Activ...
2. Eight PITHIA-NRF TNA Call is open
3. Review of solar and geomagnetic activity
4. International Sunspot Number by SILSO
5. PROBA2 Observations
6. Noticeable Solar Events
7. Geomagnetic Observations in Belgium
8. Review of Ionospheric Activity
9. The SIDC Space Weather Briefing
10. Upcoming Activities
A flock of sunspots
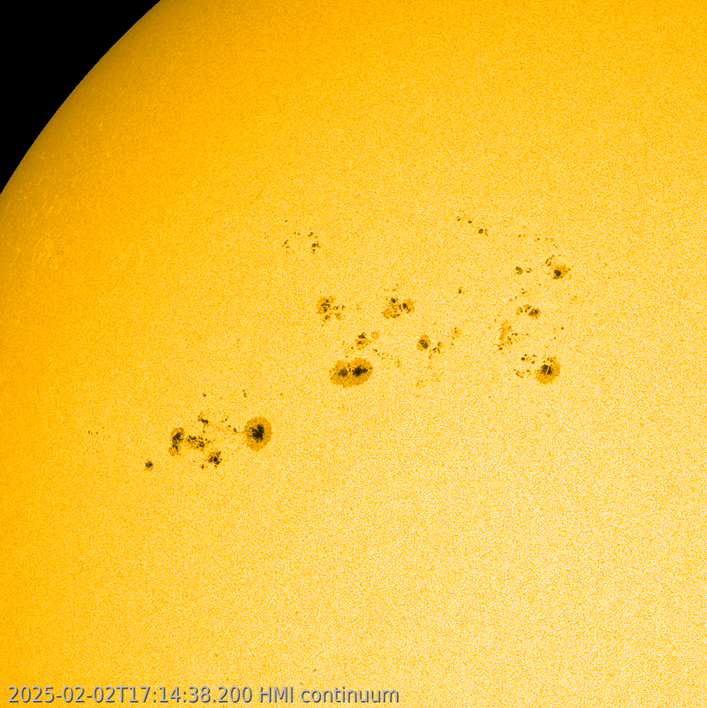
Once again, a swarm of sunspots is rotating over the solar disk. This time, the sunspot hive started to rotated over the northern solar hemisphere from 28 January onwards, and so -at the time of this writing (3 February)- it is close to the Sun's central meridian. Dozens of sunspots of varying sizes are squeezed together in an area of about 12 by 20 degrees. Then, late on 1 February, additional, isolated sunspot groups started to develop to the northeast ("upper left") and southeast ("lower left") of this cluster, adding even more to the size of this already very complex area. The SDO/HMI image underneath shows the entire sunspot cluster a day later, with a clip covering the period from 1 to early 3 February available in the online version of this newsitem at https://www.stce.be/news/747/welcome.html
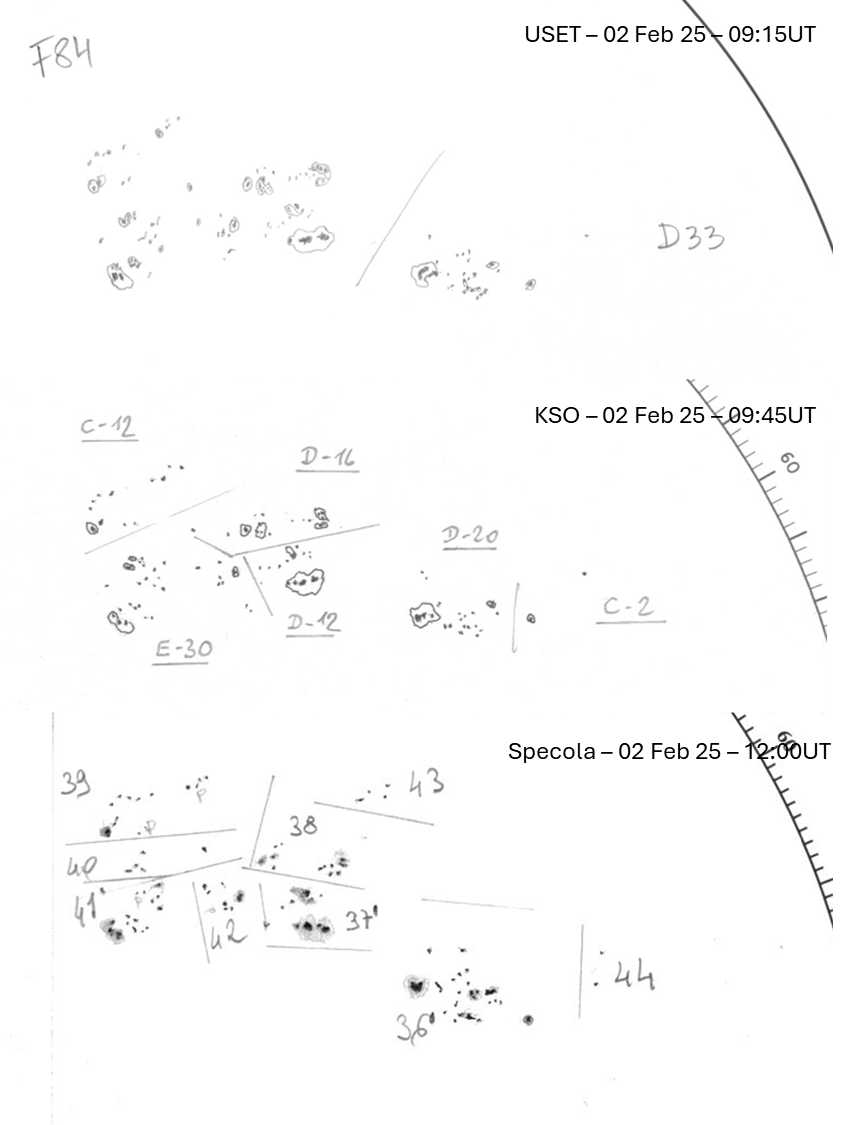
To the solar observers, this kind of sunspot clusters is also known as the "sunspots from hell" (that's a little joke...). Indeed, it is downright difficult to determine how many sunspot groups are actually present in such a cluster, as can be gauged from the solar drawings underneath. They were all made by reputable solar observatories such as USET (Royal Observatory of Belgium https://www.sidc.be/uset/ ), The Kanzelhöhe Observatory for Solar and Environmental Research (KSO, Austria - http://cesar.kso.ac.at/ ), and the Specola Observatory in Locarno (Specola Solare Ticinese, Switzerland - https://www.specola.ch/en/home-english/ ). For 2 February, they count respectively 2, 6, and 9 sunspot groups, as shown in the drawing cuts underneath. Note the reversed image orientation compared to the SDO imagery, i.e. in the east-west direction, and that the Specola observation contains at least one group that was not visible yet a few hours earlier in the USET and KSO observations (Specola nr 43 ; NOAA 13982). The NOAA/USAF observers reported 5 active regions (https://www.solarmonitor.org/index.php ).
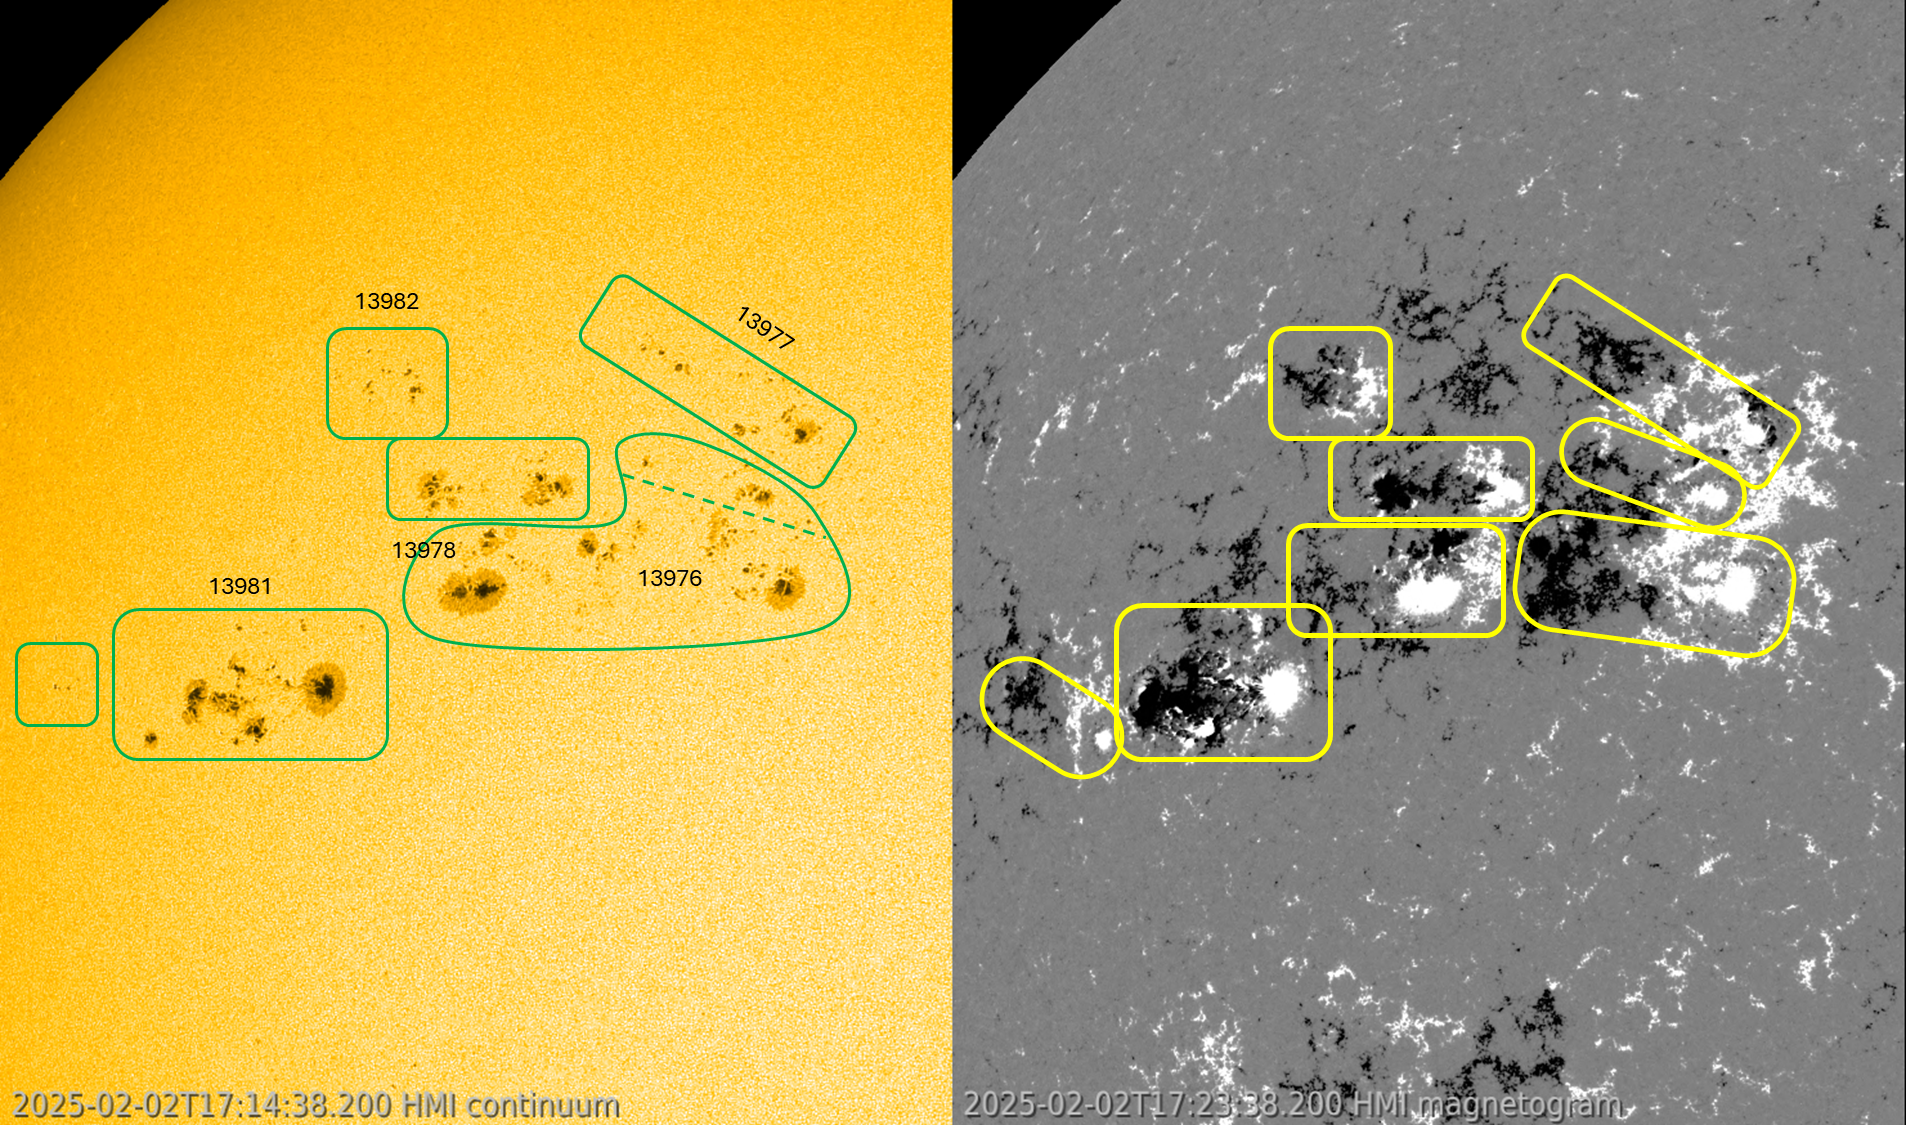
Claiming that there's a single, correct solution to this problem is a bit exaggerated, certainly in view of the rapidly evolving number, size and location of the various sunspots. For splitting up sunspot groups, one has to keep in mind that a solar observer -in order to keep consistency with the old observations when no magnetic imagery was available- is only allowed to use white light imagery. He can use "rules" such as e.g. that the leading spot usually is larger and more inclined to the solar equator than the trailing spot. Independent active regions evolve by themselves, without much interaction with their neighbours. Also, in case there's still doubt, sunspots and sunspot groups less than 5 degrees in latitude and/or 10 degrees in longitude are usually taken together. The annotated SDO/HMI white light image (underneath left) shows a possible solution of 6 sunspot regions (green boxes), with a debatable 7th group possible (above the dashed line). The numbers in black are the active regions as reported by NOAA. On the right is the corresponding SDO/HMI magnetogram. Here, the simplest way forward is to look for bipolar regions, with in this case "white" being the magnetic polarity of the leading region (magnetic field lines coming out of the solar surface), and "black" being the magnetic polarity of the trailing region. Here, 8 regions can be quite easily identified (yellow boxes).
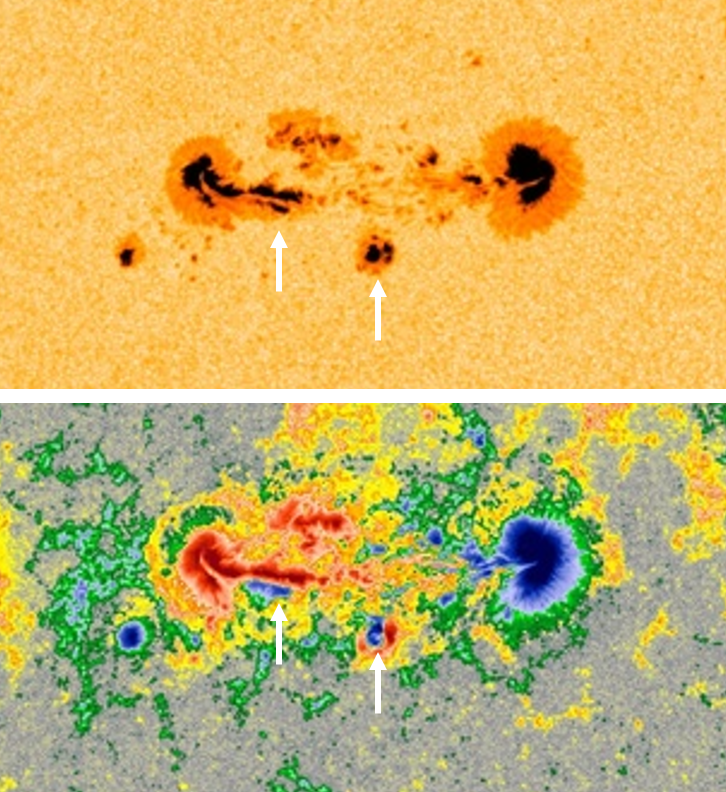
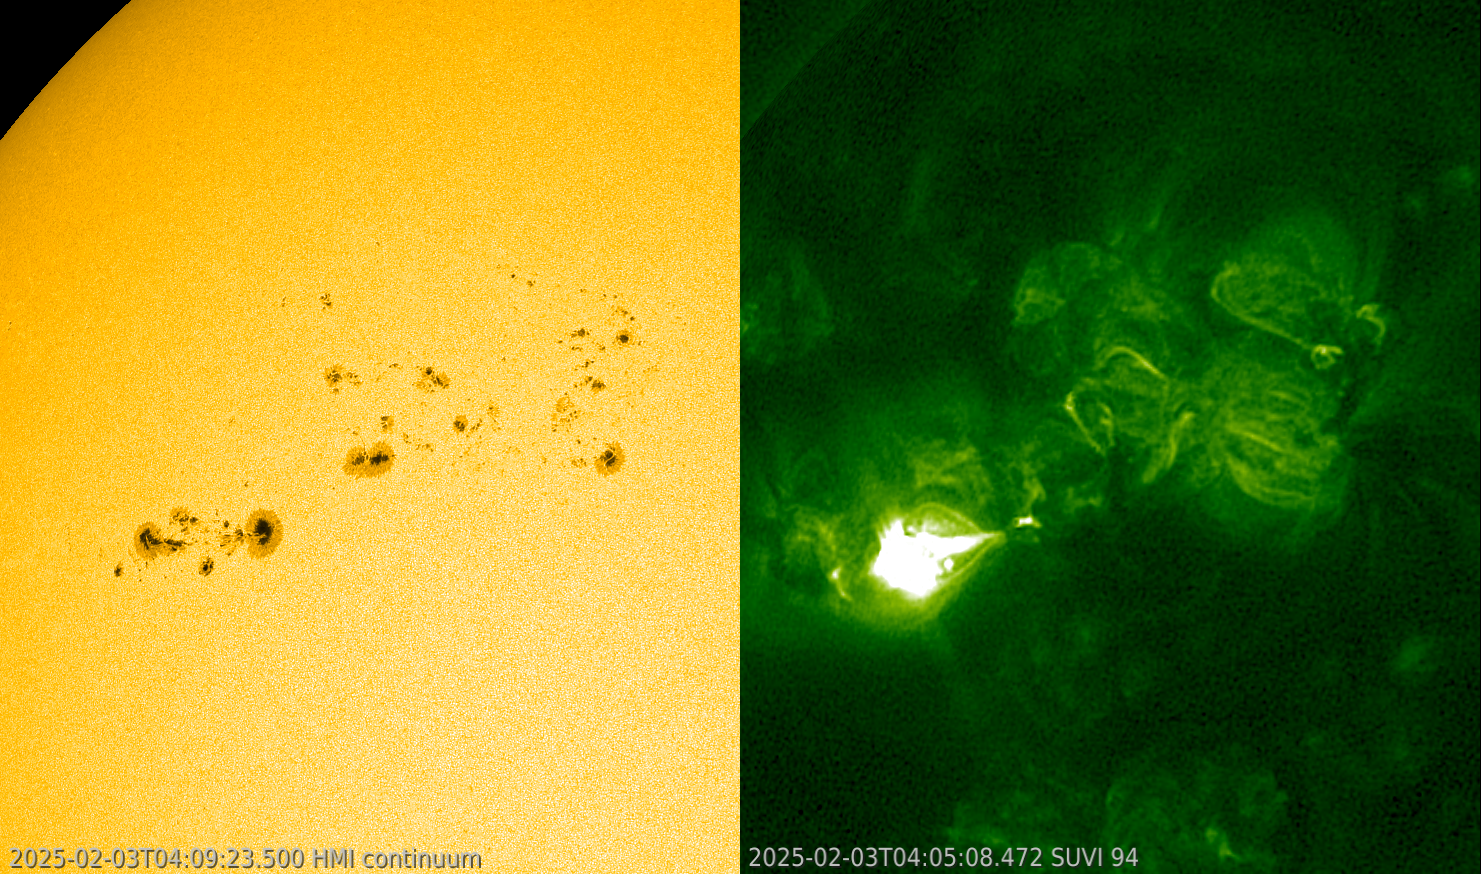
Correctly separating the sunspot groups (as much as possible) is important, as it is the first step in the classification of the groups: usually according to the McIntosh scheme in white light, and according to the Mount Wilson scheme when using a magnetogram (see the STCE SWx classification page at https://www.stce.be/educational/classification ). At least here, there's one certainty: if there's a magnetic delta structure present in an active region, then the chance on (strong) flares is significantly higher than if there's no delta present. A sunspot group is said to contain a delta structure when it has at least one mature spot that contains umbrae of opposite magnetic polarities separated by less than 2 degrees and situated within the common penumbra. The imagery underneath shows a white light image and a magnetogram of NOAA 13981 early on 3 February. The region clearly contains 2 delta structures, as indicated by the white arrows. From 2 February onwards, it was the source of several M-class flares, the strongest being an M8.8 flare peaking on 3 February at 03:58UTC. A combo of a SDO/HMI white light image and a GOES/SUVI extreme ultraviolet image can be found underneath (the online clip covers 2-3 February). Notice also how some of the spots are stretched, another sign of the powerful magnetic field strengths that are present there. It's obvious that an X-class flare is possible from this region as long as the magnetic delta structures persist.
Eight PITHIA-NRF TNA Call is open
The Eight TNA Call is open from 2 February 2025 until 2 March 2025 .
PITHIA-NRF launches its eight call. This is an extra call within the frame of PITHIA-NRF project goal to provide effective and convenient access to the best European research facilities for observations of the upper atmosphere, including the plasmasphere, ionosphere and thermosphere. This access is organised through the Trans-National Access (TNA) programme, and it provides an opportunity for researcher and other users to execute and carry out their own projects at one of the PITHIA-NRF research facilities.
The call opens from 2 February 2025. It is an Open Call, and applications are handled as they arrive with typical evaluation times of 2 to 3 weeks. If accepted the projects can commence for organisation and realisation from mid-February 2025, with the extra condition that the final project report must be submitted at the latest by the end of May 2025. This call closes on 2 March 2025.
More information can be found on the PITHA-NRF website: https://pithia-nrf.eu/pithia-nrf-users/tna/tna-calls/eight-tna-call
Review of solar and geomagnetic activity
WEEK 1257 from 2025 Jan 27
Solar Active Regions and flares
The solar flaring activity was at low to moderate levels throughout the week, with 40 C-class flares and 11 M-class flares observed. There were 14 active regions (ARs) observed on the visible solar disk.
SIDC 368 (NOAA AR 3977), SIDC 388 (NOAA AR 3976) and SIDC 360 (NOAA AR 3978) produced most of the flaring activity. These regions rotated on disk at the start of the week and increased in size and magnetic complexity.
SIDC 391 (NOAA AR 3981) rotated on disk at the end of the week and produced several M-class flares.
The largest flare was a M6.7-flare, with peak time 14:00 UTC on January 31 and was associated with SIDC 388 (NOAA AR 3976).
Coronal mass ejections
Throughout the week 3 Coronal Mass Ejections (CMEs) with an Earth directed component were observed. The first CME was observed in LASCO data at 13:25 UTC on the 28th of January and was associated with SIDC sunspot group 388 (NOAA Active Region 3976). This CME had a glancing blow arrival at Earth on January 30.
The second CME was observed in LASCO data at 16:12 UTC on the 30th of January and was associated with a filament eruption in the southeast quadrant of the Sun. A third CME was observed in LASCO data at 14:24 UTC on January 31 and was associated with an M6.7 flare.
Coronal Holes
Returning SIDC Coronal Hole 82 (equatorial coronal hole with a positive polarity) and returning SIDC Coronal Hole 60 (mid-latitude coronal hole with a positive polarity) both crossed the central meridian between January 28 and February 01.
Proton flux levels
The greater than 10 MeV GOES proton flux remained at nominal levels throughout the week.
Electron fluxes at GEO
The greater than 2 MeV electron flux, as measured by the GOES-16 satellite, was below the 1000 pfu threshold level over the past week. The greater than 2 MeV electron flux, as measured by GOES-18, passed the 1000 pfu threshold during brief periods on January 26 and January 27.
Solar wind
At the beginning of the week, the Earth was under a slow solar wind regime. The solar wind became disturbed with the arrival of an ICME on January 30, followed by the arrival of a high-speed stream on January 31. The solar wind speed ranged between 258 km/s and 712 km/s. The total interplanetary magnetic field ranged between 0.8 nT and 18 nT, with the Bz reaching a minimum of -16 nT.
Geomagnetism
The geomagnetic conditions were globally and locally quiet to unsettled (Kp 1-3 and K BEL 1-3) at the start of the week and at the end of the week reached active conditions globally (Kp 4) and minor storm conditions locally (K BEL 5).
International Sunspot Number by SILSO
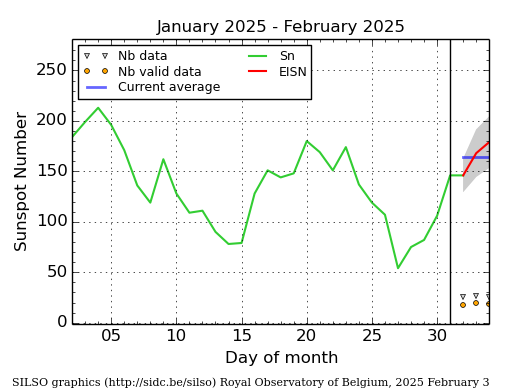
The daily Estimated International Sunspot Number (EISN, red curve with shaded error) derived by a simplified method from real-time data from the worldwide SILSO network. It extends the official Sunspot Number from the full processing of the preceding month (green line), a few days more than one solar rotation. The horizontal blue line shows the current monthly average. The yellow dots give the number of stations that provided valid data. Valid data are used to calculate the EISN. The triangle gives the number of stations providing data. When a triangle and a yellow dot coincide, it means that all the data is used to calculate the EISN of that day.
PROBA2 Observations
Solar Activity
Solar flare activity fluctuated from low to moderate during the week.
In order to view the activity of this week in more detail, we suggest to go to the following website from which all the daily (normal and difference) movies can be accessed: https://proba2.oma.be/ssa
This page also lists the recorded flaring events.
A weekly overview movie (SWAP week 775) can be found here: https://proba2.sidc.be/swap/data/mpg/movies/weekly_movies/weekly_movie_2025_01_27.mp4.
Details about some of this week's events can be found further below.
If any of the linked movies are unavailable they can be found in the P2SC movie repository here: https://proba2.oma.be/swap/data/mpg/movies/.
Friday January 31
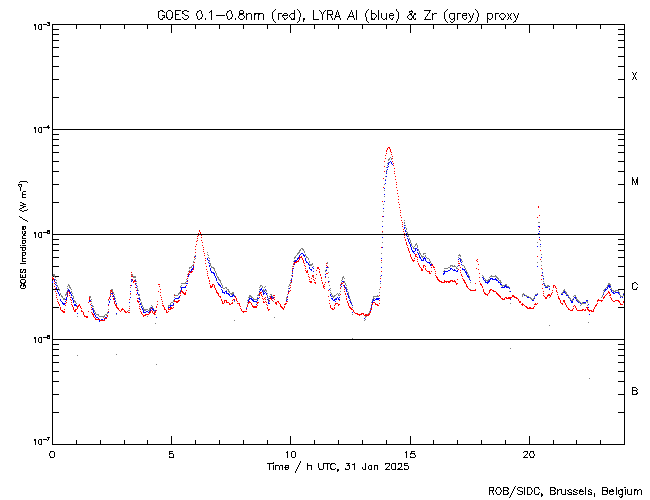
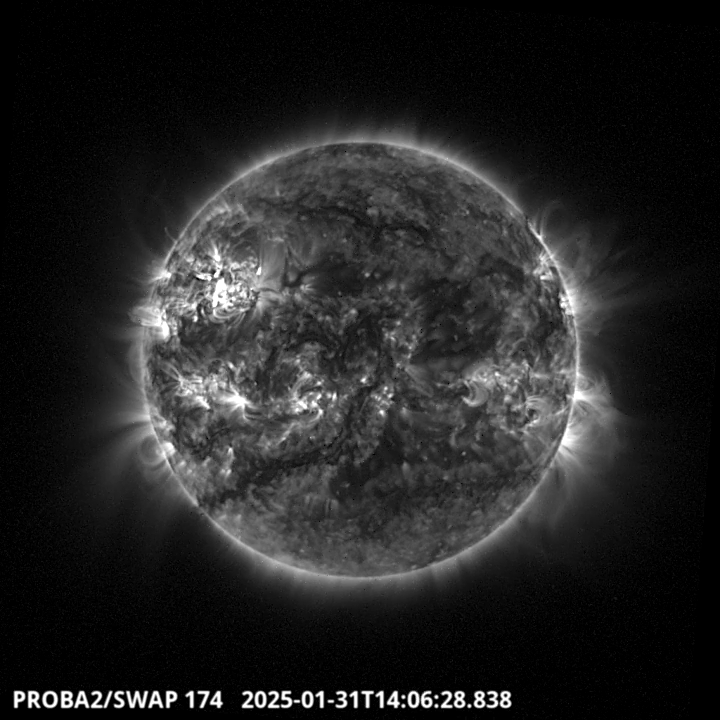
The largest flare of this week was an M6.7, and it was observed by LYRA (top panel) and SWAP (bottom panel). The flare peaked on 2025-Jan-31 at 14:06 UT. It occurred in the north-eastern quadrant of the Sun, originating from active region NOAA3978.
Find a SWAP movie of the event here: https://proba2.sidc.be/swap/movies/20250131_swap_movie.mp4.
Noticeable Solar Events
| DAY | BEGIN | MAX | END | LOC | XRAY | OP | 10CM | TYPE | Cat | NOAA |
| 27 | 0752 | 0812 | 0833 | M2.6 | 3976 | |||||
| 28 | 1941 | 1945 | 1949 | M1.7 | III/1 | 21 | 3977 | |||
| 29 | 0336 | 0408 | 0421 | M1.0 | III/1 | 21 | 3977 | |||
| 31 | 0548 | 0610 | 0620 | M1.0 | III/2 | 20 | 3976 | |||
| 31 | 1340 | 1406 | 1425 | N11E43 | M6.7 | 1N | VI/2 | 22 | 3978 | |
| 31 | 2014 | 2023 | 2028 | N23E28 | M1.8 | SF | III/3 | 21 | 3977 | |
| 01 | 1314 | 1319 | 1323 | M2.4 | II/2 | 21 | 3977 | |||
| 02 | 1001 | 1012 | 1021 | M3.0 | I/1 6 | 24 | 3981 | |||
| 02 | 1241 | 1250 | 1300 | M1.4 | 24 | 3981 | ||||
| 02 | 1358 | 1404 | 1408 | M5.1 | /3 | 21 | 3977 | |||
| 02 | 1508 | 1513 | 1517 | M1.2 | 21 | 3977 | ||||
| 02 | 1521 | 1533 | 1543 | M2.7 | 24 | 3981 | ||||
| 02 | 2309 | 2324 | 2342 | M4.1 | 24 | 3981 |
| LOC: approximate heliographic location | TYPE: radio burst type |
| XRAY: X-ray flare class | Cat: Catania sunspot group number |
| OP: optical flare class | NOAA: NOAA active region number |
| 10CM: peak 10 cm radio flux |
Geomagnetic Observations in Belgium

Local K-type magnetic activity index for Belgium based on data from Dourbes (DOU) and Manhay (MAB). Comparing the data from both measurement stations allows to reliably remove outliers from the magnetic data. At the same time the operational service availability is improved: whenever data from one observatory is not available, the single-station index obtained from the other can be used as a fallback system.
Both the two-station index and the single station indices are available here: http://ionosphere.meteo.be/geomagnetism/K_BEL/
Review of Ionospheric Activity

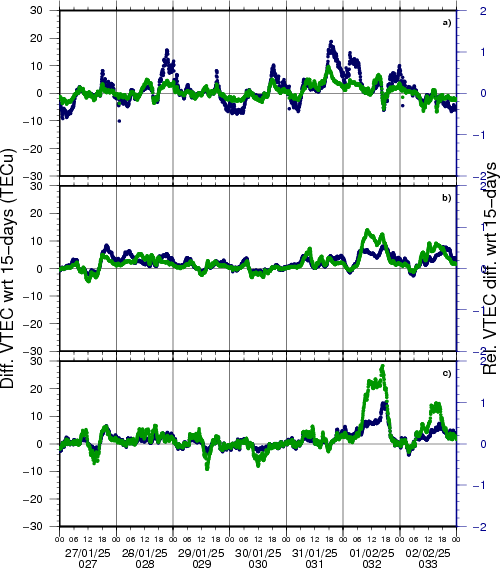
VTEC time series at 3 locations in Europe from 27 Jan 2025 till 2 Feb 2025
The top figure shows the time evolution of the Vertical Total Electron Content (VTEC) (in red) during the last week at three locations:
a) in the northern part of Europe(N 61deg E 5deg)
b) above Brussels(N 50.5deg, E 4.5 deg)
c) in the southern part of Europe(N 36 deg, E 5deg)
This top figure also shows (in grey) the normal ionospheric behaviour expected based on the median VTEC from the 15 previous days.
The time series below shows the VTEC difference (in green) and relative difference (in blue) with respect to the median of the last 15 days in the North, Mid (above Brussels) and South of Europe. It thus illustrates the VTEC deviation from normal quiet behaviour.
The VTEC is expressed in TECu (with TECu=10^16 electrons per square meter) and is directly related to the signal propagation delay due to the ionosphere (in figure: delay on GPS L1 frequency).
The Sun's radiation ionizes the Earth's upper atmosphere, the ionosphere, located from about 60km to 1000km above the Earth's surface.The ionization process in the ionosphere produces ions and free electrons. These electrons perturb the propagation of the GNSS (Global Navigation Satellite System) signals by inducing a so-called ionospheric delay.
See http://stce.be/newsletter/GNSS_final.pdf for some more explanations; for more information, see https://gnss.be/SpaceWeather
The SIDC Space Weather Briefing
The forecaster on duty presented the SIDC briefing that gives an overview of space weather from January 27 to February 2.
The pdf of the presentation can be found here: https://www.stce.be/briefings/20250203_SWbriefing.pdf
Upcoming Activities
Courses, seminars and presentations with the Sun-Space-Earth system and Space Weather as the main theme. We provide occasions to get submerged in our world through educational, informative and instructive activities.
* Mar 17-18, 2025, Inleiding tot het ruimteweer, enkel voor leden van volkssterrenwachten, Brussels, Belgium - register: https://events.spacepole.be/event/213/
* Mar 24, 2025, STCE Lecture From Physics to Forecasting, ESA Academy's Space Weather Training Course
* April 28-30, 2025, STCE Space Weather Introductory Course, Brussels, Belgium - register: https://events.spacepole.be/event/214/
* May 26-27, 2025, STCE Course Space Weather impacts on aviation, online - register: https://events.spacepole.be/event/215/
* Jun 23-25, 2025, STCE Space Weather Introductory Course, Brussels, Belgium - register: https://events.spacepole.be/event/216/
* Sep 15-16, 2025, STCE Course Space Weather impacts on aviation, online - register: https://events.spacepole.be/event/218/
* Nov 17-19, 2025, STCE Space Weather Introductory Course, Brussels, Belgium - register: https://events.spacepole.be/event/217/
To register for a course and check the seminar details, navigate to the STCE Space Weather Education Center: https://www.stce.be/SWEC
If you want your event in the STCE newsletter, contact us: stce_coordination at stce.be
Website: https://www.stce.be/SWEC