- Table of Content
- 1.Coronal hole
- 2.Solar poles co...
- 3.Beautiful EUI ...
- 4.Review of sola...
- 5.International ...
- 6.PROBA2 Observa...
- 7.Noticeable Sol...
- 8.Geomagnetic Ob...
- 9.Review of Iono...
- 10.The SIDC Space...
- 11.Upcoming Activ...
2. Solar poles coming into EUI's view
3. Beautiful EUI flare
4. Review of solar and geomagnetic activity
5. International Sunspot Number by SILSO
6. PROBA2 Observations
7. Noticeable Solar Events
8. Geomagnetic Observations in Belgium
9. Review of Ionospheric Activity
10. The SIDC Space Weather Briefing
11. Upcoming Activities
Coronal hole
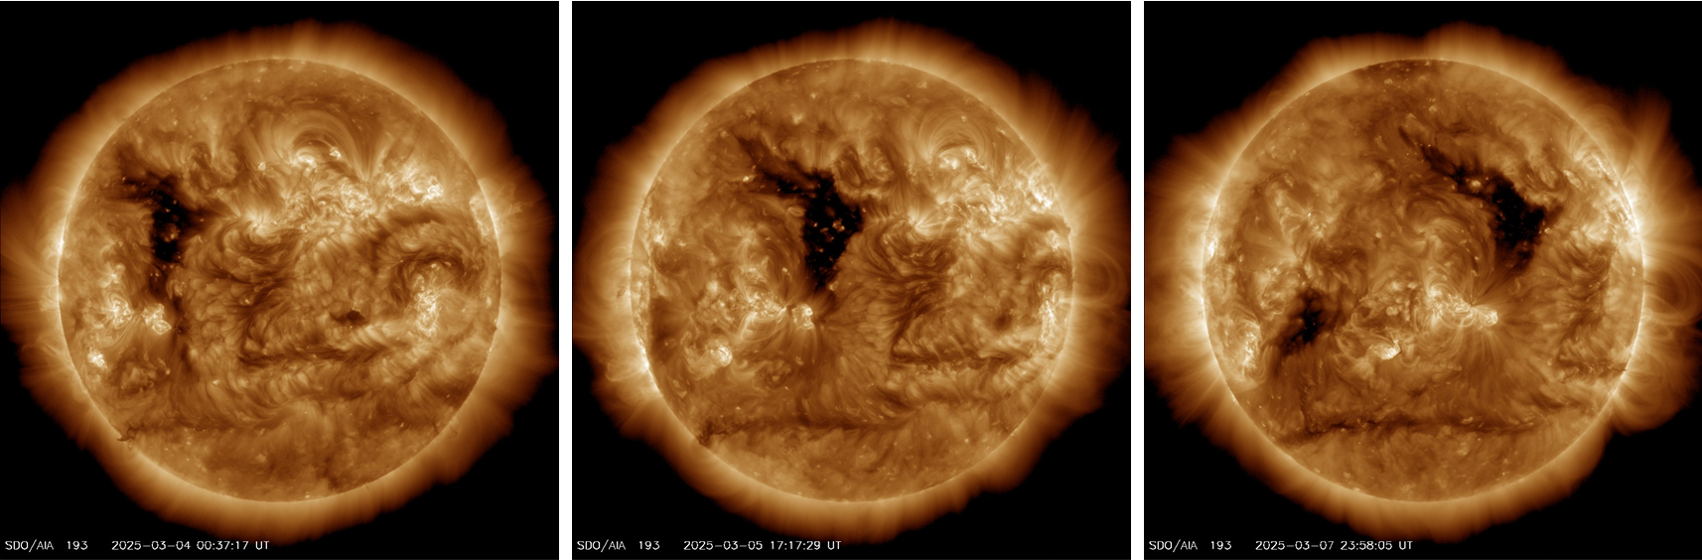
Coronal holes are regions in the hot solar atmosphere ("corona") where the plasma density at that temperature is very low compared to its surroundings, and thus they look like dark shapes in the corona. Linked to unipolar, open magnetic fields stretching into space, they are the source of the high-speed solar wind which can create geomagnetic disturbances. A relatively large equatorial coronal hole started to transit the Sun's central meridian on 5 March (see the SDO/AIA 193 imagery underneath).
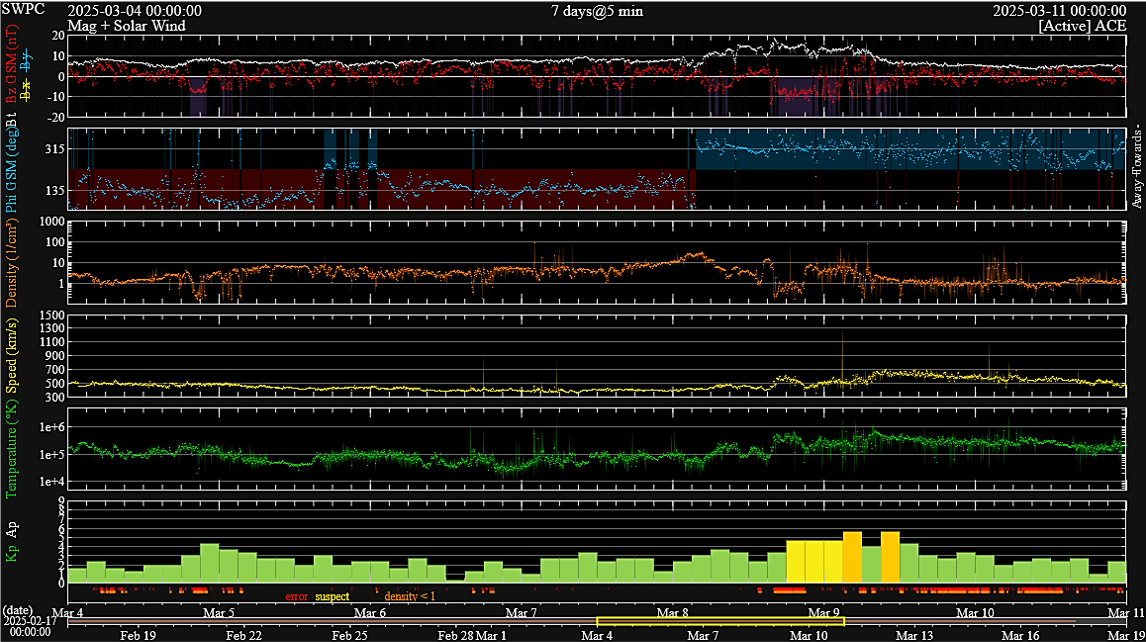
The related Corotating Interaction Region (CIR - see this STCE newsitem at https://www.stce.be/news/269/welcome.html) arrived early on 8 March, and was the source of a brief, moderate geomagnetic storm. It was followed by the High-Speed Stream (HSS) from the coronal hole, with the solar wind speed increasing to about 700 km/s by 9 March (yellow curve in the DSCOVR graph of solar wind data underneath). The wind speed remained above 500 km/s until late on 10 March. The greater than 2 MeV electron fluence reached moderate levels (GOES). These energetic particles are a pest for the satellites' electronics, and thus satellite operators keep a vigilant eye on their number. More on these highly energetic electrons is at the STCE's SWx Classification page (https://www.stce.be/educational/classification#electrons ) and in these STCE newsitems (https://www.stce.be/news/513/welcome.html , https://www.stce.be/news/463/welcome.html ).
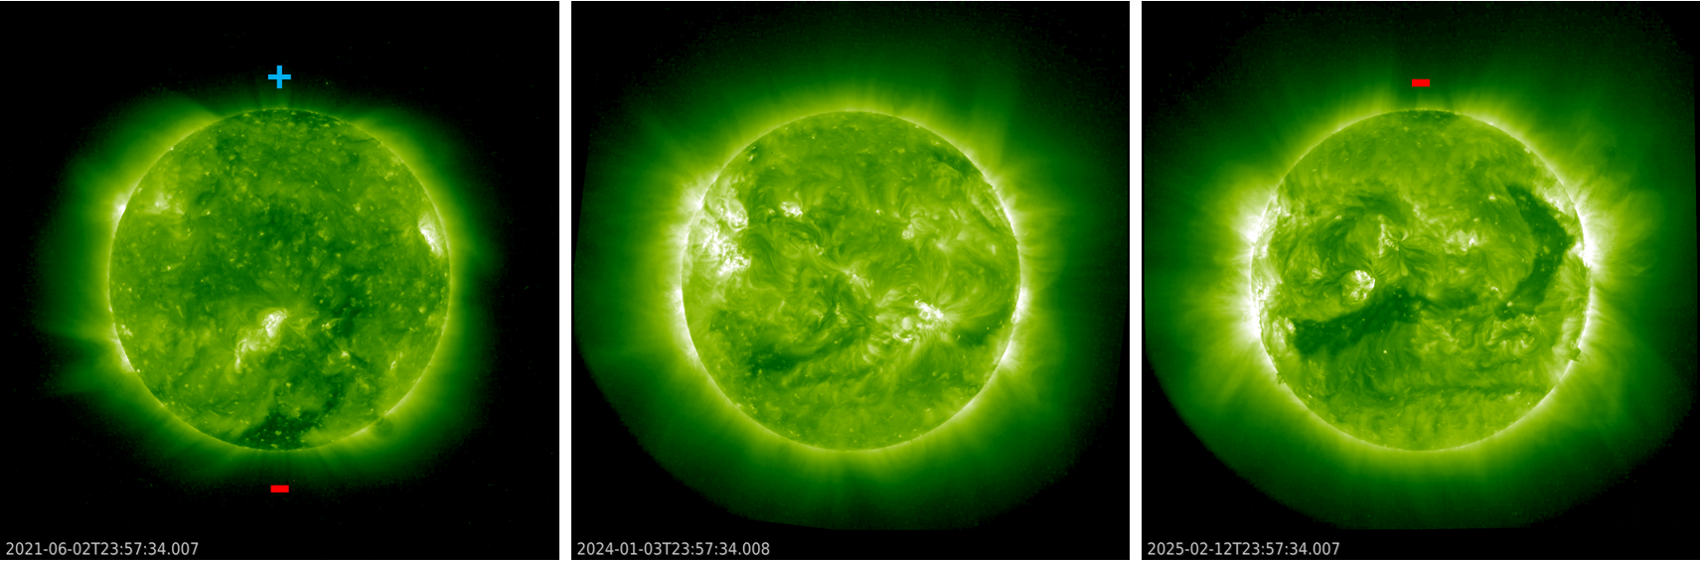
Space weather forecasters also keep an eye on the Sun's poles. Indeed, the Sun's polar fields reversed their magnetic polarity in resp. January 2024 (North) and September 2023 (South; smoothed data from the Wilcox Solar Observatory - http://wso.stanford.edu/ ), and so the polar coronal holes should gradually start reforming. This can be seen in the annotated STEREO-A imagery underneath. The image on the left dates from 2021 at the early stages of solar cycle 25 (SC25), with still reasonably well defined coronal holes at both poles. The "+" and "-" indicate the magnetic polarity. The middle picture dates from January 2024, so just after the polar field reversal, and shows the absence of the polar coronal holes. Early 2025 (picture on the right), the Sun has developed a small but clear northern polar coronal hole that has an opposite magnetic polarity than back in 2021. Near the Sun's south pole, no clearly defined polar coronal hole has developed yet. It is expected that this will happen later in 2025. As SC25 further progresses, the polar coronal holes are thought to increase in size with occasionally an extension towards equatorial latitudes. Numerous examples can be found in previous STCE newsitems, e.g. https://www.stce.be/news/496/welcome.html , https://www.stce.be/news/537/welcome.html , and https://www.stce.be/news/403/welcome.html
Solar poles coming into EUI's view
The EUI telescope on Solar Orbiter is getting its first glimpses of the poles of the Sun. Solar Orbiter has entered a new phase in its mission where additional Venus gravity assist manoeuvres are used to increase the inclination of the satellite's orbit, helping the instruments see the polar regions of the Sun, for the first time.
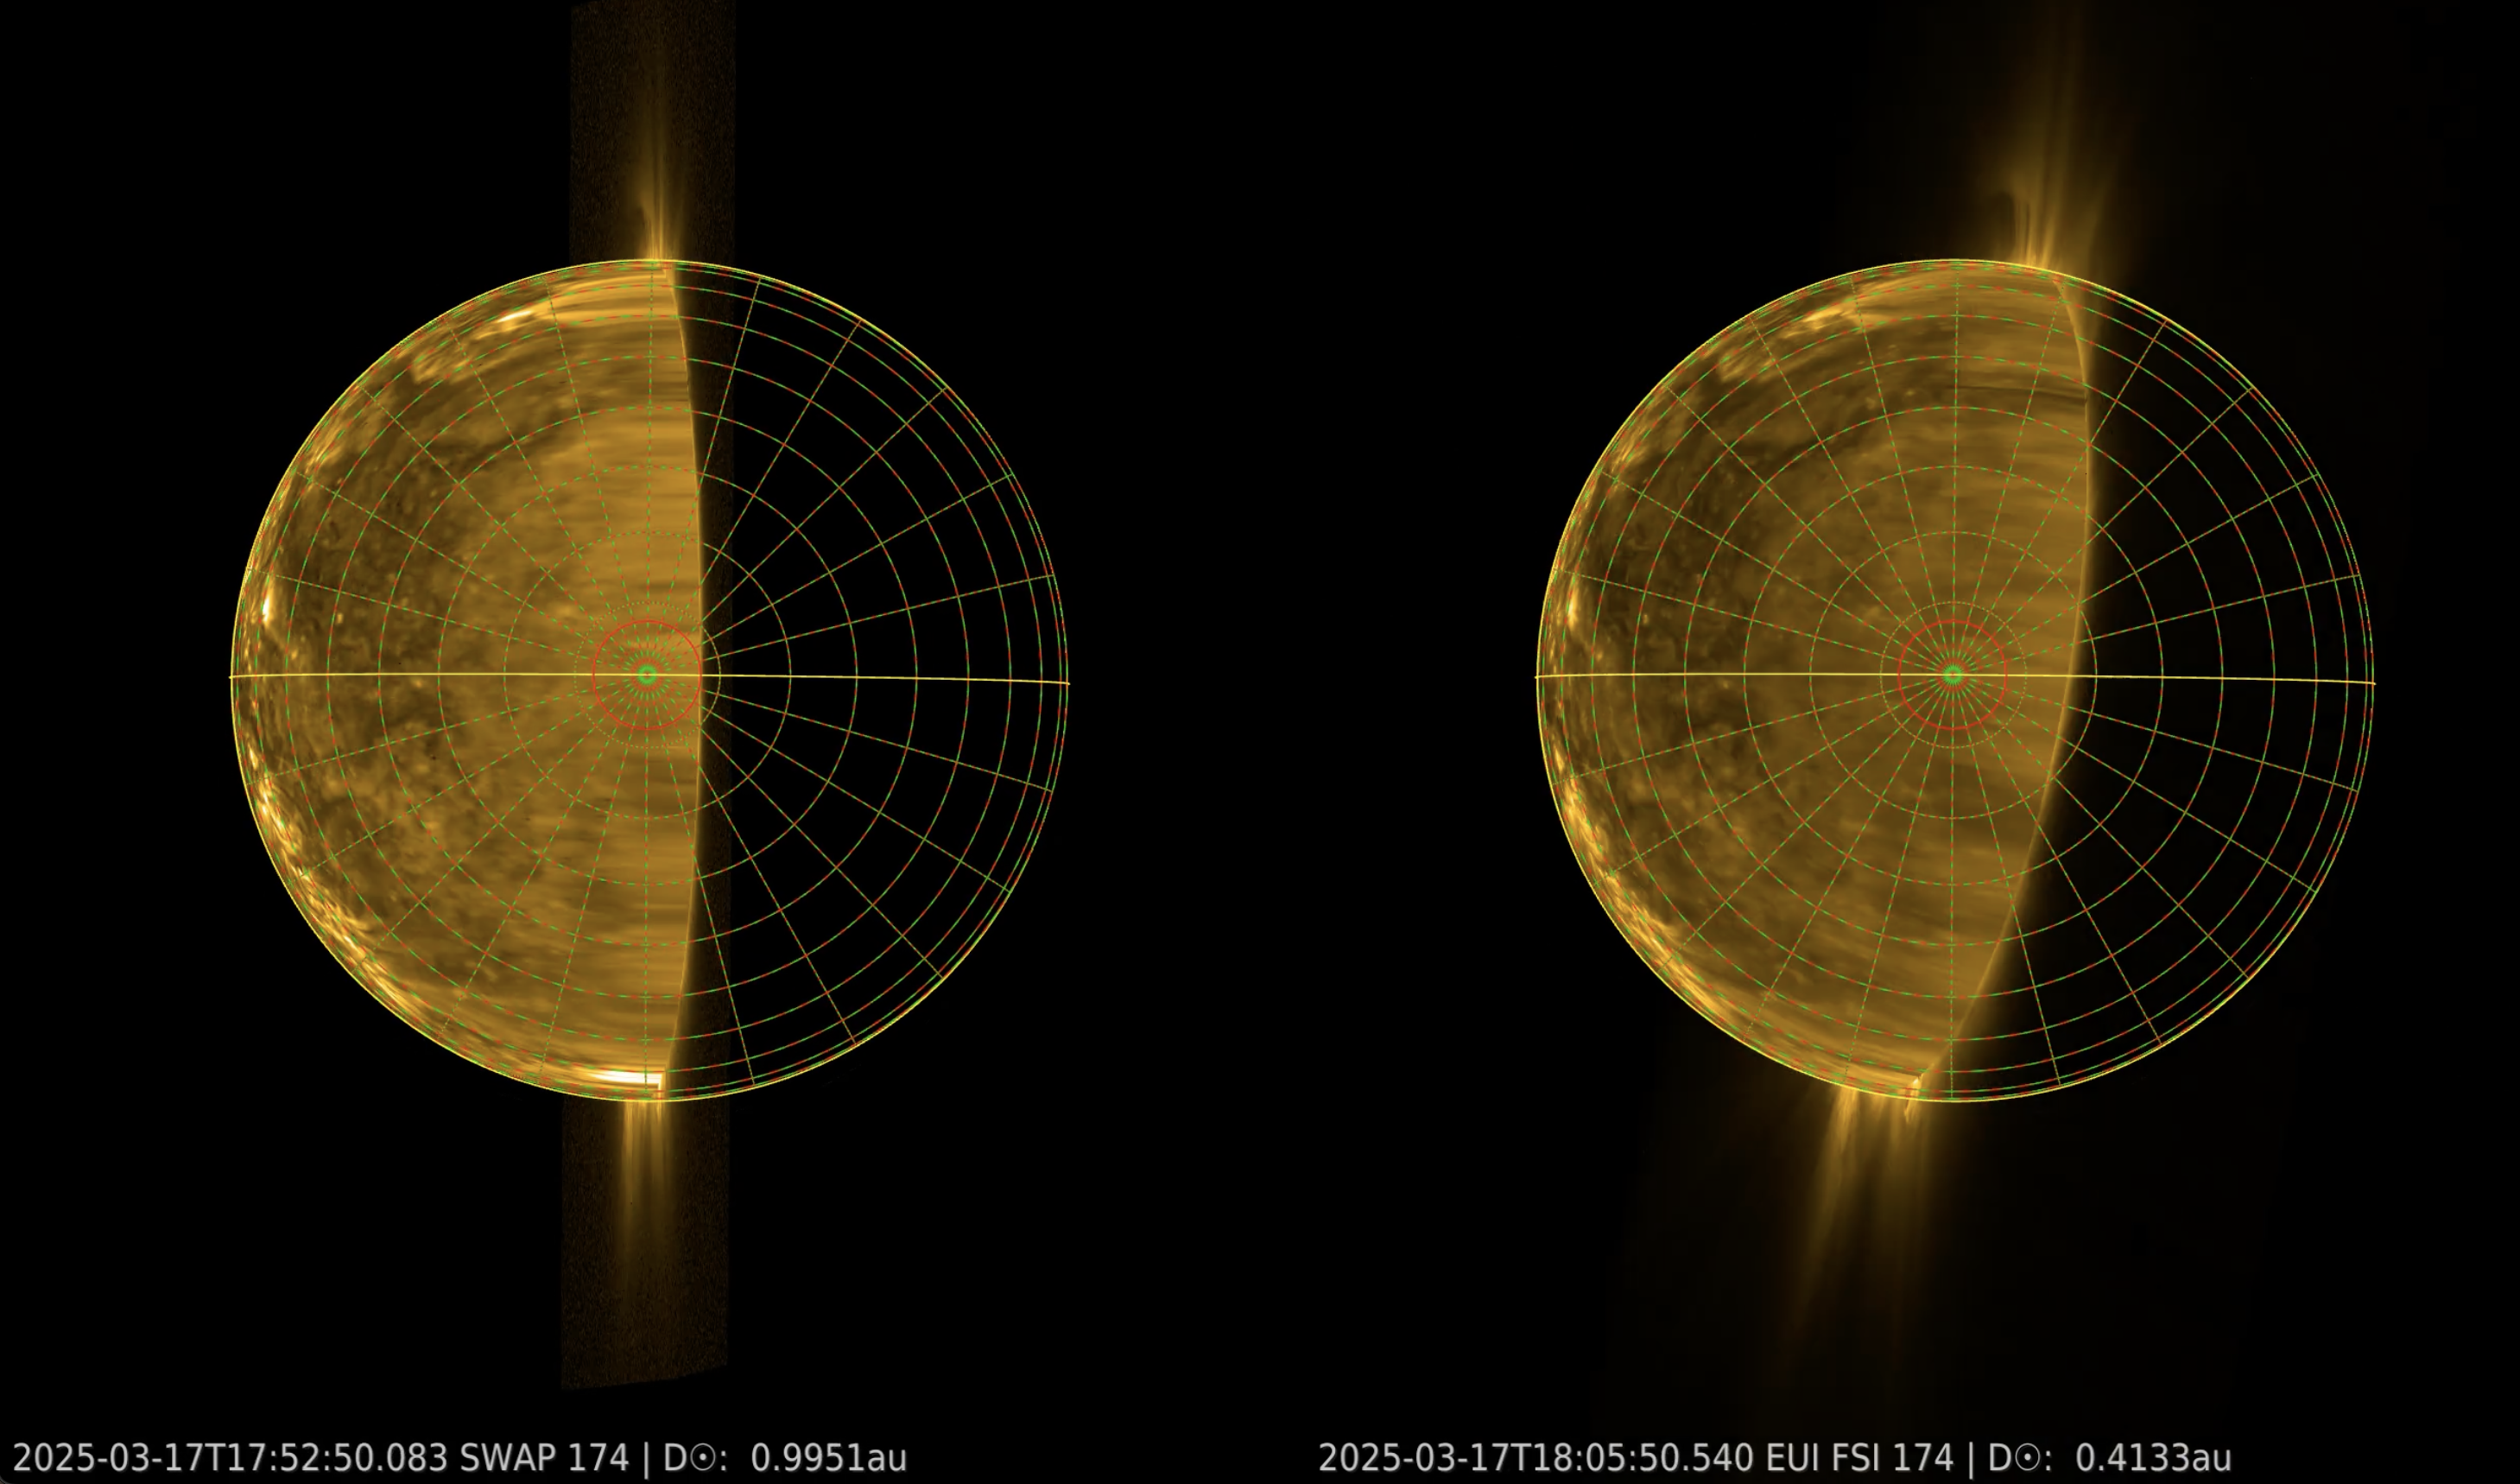
In this movie, we are looking on the solar south pole as the sun rotates over the last 11 months. The left figure is from the SWAP telescope in Earth Orbit, the sun sways from left to right because the solar equator is ~7deg off from the orbital plane of the Earth. As a consequence we can see, even from Earth, once per year a bit of each solar pole, but never more than the red circle (diameter of ~7deg latitude). The right figure is from Solar Orbiter, which has its own orbit around the Sun, and as a consequence Solar Orbiter sometimes images the Sun on the far-side, the side not seen from Earth. Moreover, we can also see more of the poles. In the last frame of the movie, pictured above, we see up to 16 deg beyond the pole. In the coming years, this will still double to more than 33 degrees.
Watch the movie here: https://stce.be/movies/JHV_2025-03-17_20.40.32.mp4
More info on Solar Orbiter's orbit: https://www.esa.int/Science_Exploration/Space_Science/Solar_Orbiter/Where_is_Solar_Orbiter_Track_ESA_s_Sun_explorer
Beautiful EUI flare
A dazzling solar flare was captured by the Solar Orbiter mission on 30 September 2024.

The video uses images taken by Solar Orbiter's Extreme Ultraviolet Imager (EUI) instrument. It was made by scientists at the Royal Observatory of Belgium using the JHelioviewer software, which anyone can use to make their own solar flare movies. All EUI data is accessible through the JHelioviewer application.
Never before has a space mission been able to observe solar flares in such high resolution in space and time.
Enjoy the movie here: https://www.esa.int/ESA_Multimedia/Videos/2025/03/Solar_Orbiter_spots_a_solar_flare
Download JHelioviewer to make your own solar movies: https://www.jhelioviewer.org/
Review of solar and geomagnetic activity
WEEK 1263 from 2025 Mar 10
Solar Active Regions and flares
Solar flaring activity was low to moderate during the week. A total of 48 C-class flares and 2 M-class flares were observed. The largest flares were two M1.1 flares, one peaking on March 11 at 13:04 UTC (SIDC Sunspot Group 431/NOAA Active Region 4024) and the second peaking on March 14 at 22:21 UTC (SIDC Sunspot Group 437/NOAA Active Region 4030). There were a total number of 22 active regions (ARs) observed on the visible solar disk over the week. The number of active regions on disk increased from 5 to 13 during the week.
Coronal mass ejections
During the past week, no CME (Coronal Mass Ejection) with an Earth directed component was observed.
Coronal Holes
During the past week, two negative polarity Coronal Holes (CH) crossed the central meridian on March 10, resp. on March 14 2025.
Proton flux levels
The greater than 10 MeV GOES proton flux was below the 10pfu threshold for the entire week.
Electron fluxes at GEO
The greater than 2 MeV electron flux was above the 1000 pfu threshold for almost the entire week.
Solar wind
In the beginning of the week the solar wind at Earth transitioned from fast to slow, then on March 12 the solar wind became fast again and returned to slow solar wind conditions on March 15. The solar wind speed ranged between 350 and 600 km/s and the interplanetary magnetic field was between 4 and 12 nT, with the Bz component reaching a minimum value of -11 nT.
Geomagnetism
Geomagnetic conditions reached minor storm (Kp=5) conditions on March 12 till March 14, with an isolated period of moderate storm on March 14 (Kp=6), and have since returned to quiet conditions.
International Sunspot Number by SILSO
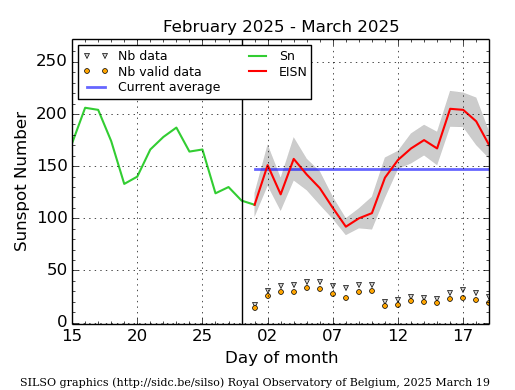
The daily Estimated International Sunspot Number (EISN, red curve with shaded error) derived by a simplified method from real-time data from the worldwide SILSO network. It extends the official Sunspot Number from the full processing of the preceding month (green line), a few days more than one solar rotation. The horizontal blue line shows the current monthly average. The yellow dots give the number of stations that provided valid data. Valid data are used to calculate the EISN. The triangle gives the number of stations providing data. When a triangle and a yellow dot coincide, it means that all the data is used to calculate the EISN of that day.
PROBA2 Observations
Solar Activity
Solar flare activity fluctuated from low to moderate during the week.
In order to view the activity of this week in more detail, we suggest to go to the following website from which all the daily (normal and difference) movies can be accessed: https://proba2.oma.be/ssa
This page also lists the recorded flaring events.
A weekly overview movie (SWAP week 781) can be found here: https://proba2.sidc.be/swap/data/mpg/movies/weekly_movies/weekly_movie_2025_03_10.mp4.
Details about some of this week's events can be found further below.
If any of the linked movies are unavailable they can be found in the P2SC movie repository here: https://proba2.oma.be/swap/data/mpg/movies/.
Saturday March 15
.jpeg)
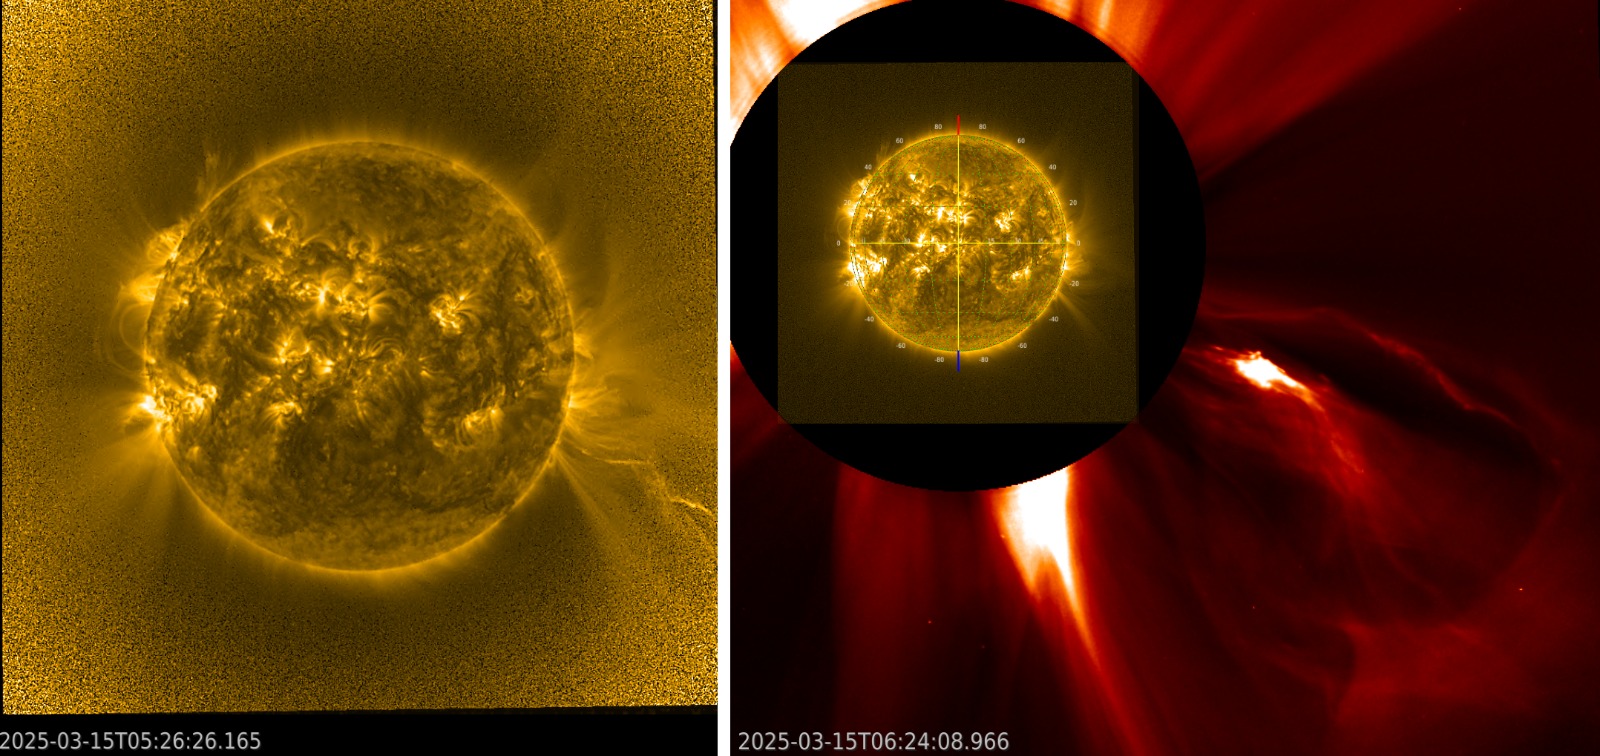
A slow rising prominence eruption occurred on 2025-Mar-15 at approximately 05:00 UT at the south-western limb of the Sun, as seen in the bottom left SWAP figure. It was associated with a long-lasting C3.9 flare which peaked at 06:43 UT and was observed by LYRA (top panel). The prominence eruption was correlated with a beautifully elongated three-part structure coronal mass ejection seen in the SOHO/LASCO-C2 image (combined with a SWAP observation in the center) in the bottom right panel.
Find a SWAP movie of the event here: https://proba2.sidc.be/swap/movies/20250315_swap_movie.mp4.
Noticeable Solar Events
| DAY | BEGIN | MAX | END | LOC | XRAY | OP | 10CM | TYPE | Cat | NOAA |
| 11 | 1303 | 1304 | 1306 | M1.1 | III/2 | 4024 | ||||
| 14 | 2218 | 2221 | 2232 | M1.1 | 4030 |
| LOC: approximate heliographic location | TYPE: radio burst type |
| XRAY: X-ray flare class | Cat: Catania sunspot group number |
| OP: optical flare class | NOAA: NOAA active region number |
| 10CM: peak 10 cm radio flux |
Geomagnetic Observations in Belgium
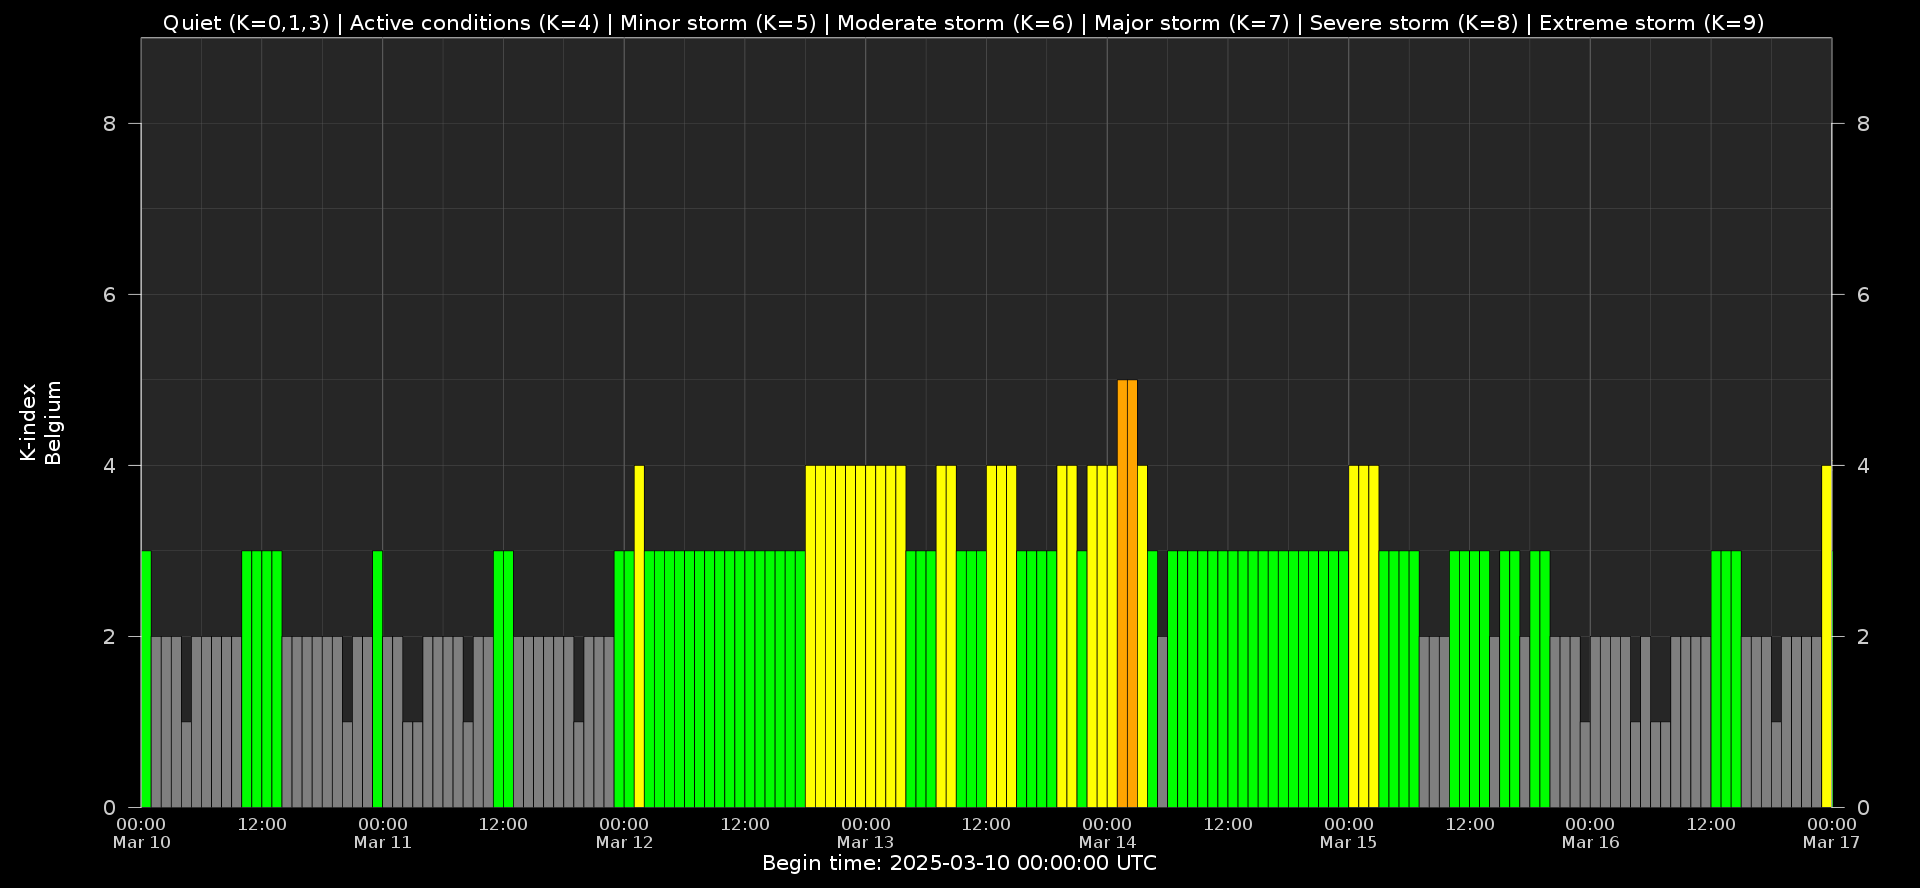
Local K-type magnetic activity index for Belgium based on data from Dourbes (DOU) and Manhay (MAB). Comparing the data from both measurement stations allows to reliably remove outliers from the magnetic data. At the same time the operational service availability is improved: whenever data from one observatory is not available, the single-station index obtained from the other can be used as a fallback system.
Both the two-station index and the single station indices are available here: http://ionosphere.meteo.be/geomagnetism/K_BEL/
Review of Ionospheric Activity
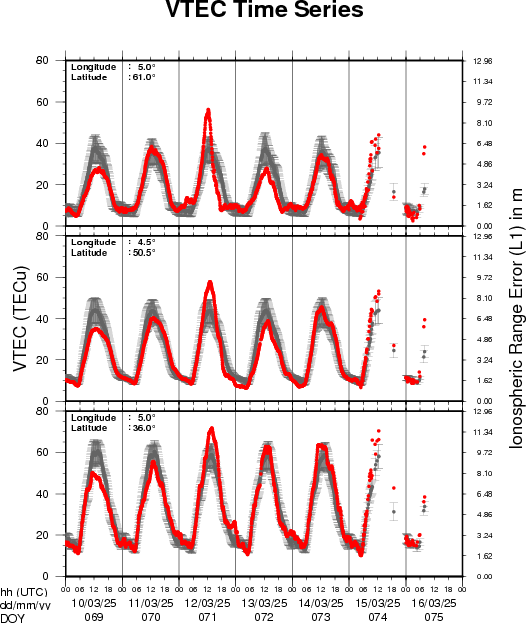
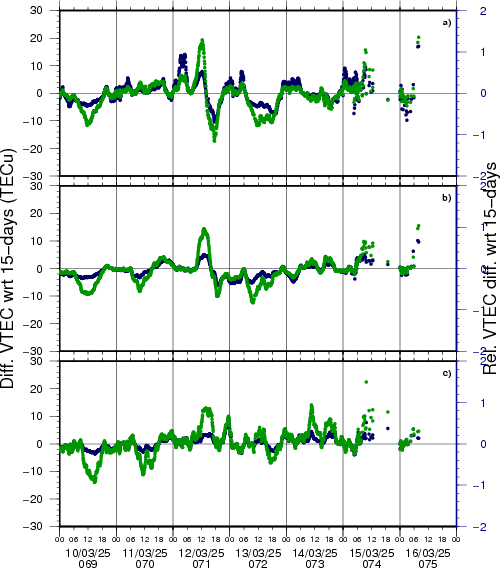
VTEC time series at 3 locations in Europe from 10 Mar 2025 till 16 Mar 2025
The top figure shows the time evolution of the Vertical Total Electron Content (VTEC) (in red) during the last week at three locations:
a) in the northern part of Europe(N 61deg E 5deg)
b) above Brussels(N 50.5deg, E 4.5 deg)
c) in the southern part of Europe(N 36 deg, E 5deg)
This top figure also shows (in grey) the normal ionospheric behaviour expected based on the median VTEC from the 15 previous days.
The time series below shows the VTEC difference (in green) and relative difference (in blue) with respect to the median of the last 15 days in the North, Mid (above Brussels) and South of Europe. It thus illustrates the VTEC deviation from normal quiet behaviour.
The VTEC is expressed in TECu (with TECu=10^16 electrons per square meter) and is directly related to the signal propagation delay due to the ionosphere (in figure: delay on GPS L1 frequency).
The Sun's radiation ionizes the Earth's upper atmosphere, the ionosphere, located from about 60km to 1000km above the Earth's surface.The ionization process in the ionosphere produces ions and free electrons. These electrons perturb the propagation of the GNSS (Global Navigation Satellite System) signals by inducing a so-called ionospheric delay.
See http://stce.be/newsletter/GNSS_final.pdf for some more explanations; for more information, see https://gnss.be/SpaceWeather
The SIDC Space Weather Briefing
The forecaster on duty presented the SIDC briefing that gives an overview of space weather from March 10 to 16.
The pdf of the presentation can be found here: https://www.stce.be/briefings/20250317_SWbriefing.pdf
Upcoming Activities
Courses, seminars and presentations with the Sun-Space-Earth system and Space Weather as the main theme. We provide occasions to get submerged in our world through educational, informative and instructive activities.
* Mar 24, 2025, STCE Lecture From Physics to Forecasting, ESA Academy's Space Weather Training Course
* April 1, 2PM, STCE seminar: GRMB project: Cluster satellites in the geospace environment, RMI conference room, Brussels, Belgium
* April 28-30, 2025, STCE Space Weather Introductory Course, Brussels, Belgium - register: https://events.spacepole.be/event/214/
* May 26-27, 2025, STCE Course Space Weather impacts on aviation, online - register: https://events.spacepole.be/event/215/
* Jun 23-25, 2025, STCE Space Weather Introductory Course, Brussels, Belgium - register: https://events.spacepole.be/event/216/
* Sep 15-16, 2025, STCE Course Space Weather impacts on aviation, online - register: https://events.spacepole.be/event/218/
* Nov 17-19, 2025, STCE Space Weather Introductory Course, Brussels, Belgium - register: https://events.spacepole.be/event/217/
To register for a course and check the seminar details, navigate to the STCE Space Weather Education Center: https://www.stce.be/SWEC
If you want your event in the STCE newsletter, contact us: stce_coordination at stce.be