- Table of Content
- 1.Mom, that larg...
- 2.The making of ...
- 3.Review of spac...
- 4.PROBA2 Observa...
- 5.International ...
- 6.Noticeable Sol...
- 7.Geomagnetic Ob...
- 8.The SIDC space...
- 9.Review of Iono...
- 10.Courses, semin...
2. The making of the EUI mosaic - coming soon
3. Review of space weather (14 Apr 2025 - 20 Apr 2025)
4. PROBA2 Observations (14 Apr 2025 - 20 Apr 2025)
5. International Sunspot Number by SILSO
6. Noticeable Solar Events
7. Geomagnetic Observations in Belgium
8. The SIDC space weather briefing
9. Review of Ionospheric Activity
10. Courses, seminars and events
Mom, that large coronal hole is back!...
Coronal holes are regions in the hot solar atmosphere ("corona") where the plasma density at that temperature is very low compared to its surroundings, and thus they look like dark shapes in the corona when viewed in soft x-rays or extreme ultraviolet (EUV). Linked to unipolar (i.e. "open") magnetic fields stretching into space, they are the source of the high-speed solar wind and can create geomagnetic disturbances. The wider the coronal hole, the longer any effects of the high speed stream will last.

The SDO/AIA 193 imagery above shows per solar rotation the outlook of the Sun in EUV. The dates are 29 January, 26 February, 25 March and 22 April 2025. Coronal holes in the northern and southern solar hemisphere can be seen respectively decaying and expanding, merging during the late March transit, with currently only the large coronal hole in the southern solar hemisphere remaining, albeit at mid-latitudes. With SPoCA, the Spatial Possibilistic Clustering Algorithm (https://spoca.oma.be/ ; Verbeeck et al. 2014 - https://doi.org/10.1051/0004-6361/201321243 ), one can extract numerous parameters from specific solar features, including from coronal holes. The area of the coronal holes can be found on the SIDC's SolarMap website (https://www.sidc.be/spaceweatherservices/applications/solarmap/ ), and is expressed in Mm2 (square megameters). One square megameter is equal to 1 million square kilometers, and -for comparison- the total area of the Earth is about 510 million square kilometers. The compilation underneath shows PROBA-2/SWAP EUV images with contours compiled by SPoCA overlaid. The dates are 30 January, 26 February, 25 March and 22 April 2025.
The table underneath summarizes for those 4 days the total area of the coronal hole (combined for the January and February transit), the speed of the associated solar wind stream, the strength of the resulting geomagnetic disturbance (Kp; GFZ Potsdam), and the maximum daily electron fluence (GOES). The latter concerns electrons with energies greater than 2 MeV electron flux (see the STCE's SWx classification page at https://www.stce.be/educational/classification#electrons ). Satellite operators keep an eye on the number of these particles, because these energetic electrons can penetrate into spacecraft components and result in a build-up of charge within the material. When the accumulated charge becomes sufficiently high, an electrostatic discharge (ESD) or arching can occur. This discharge can cause anomalous behaviour in spacecraft systems and can result in temporary or permanent loss of functionality.
The table shows that the current coronal hole is somewhat smaller than during its previous transit, when it had an area about 750 times that of the Earth's surface (see the STCE newsitem at https://www.stce.be/news/759/welcome.html ). Coronal holes can be even larger, but it's all-in-all a rare happening (STCE newsitem: https://www.stce.be/news/208/welcome.html ). Solar wind speeds in excess of 700 and 800 km/s are typical for these large coronal holes, as shown in the annotated graph underneath (yellow curve; DSCOVR - https://www.swpc.noaa.gov/products/real-time-solar-wind ). Only minor to moderate geomagnetic storming (Kp = 5 to 6 ; https://www.stce.be/educational/classification#geomag ) has been recorded as a result from these high speed wind streams, most likely because of the positive polarity of the coronal holes, i.e. the magnetic field is directed away from the Sun (2nd panel: "phi angle" at 135 degrees). This doesn't favour a good connection with the Earth's magnetic field during the period of spring equinox (Russell, C.T. and McPherron, R.L. (1973) - https://doi.org/10.1029/JA078i001p00092 ). Also, the greater than 2 MeV electron fluence reached only moderate levels.
The electron flux is expected to go up in the coming days under the influence of the ongoing high-speed, low-density solar wind stream, which arrived early on 21 April. The daily electron fluence may reach again moderate levels.
The making of the EUI mosaic - coming soon
This week, the second EUI mosaic was released: https://www.esa.int/ESA_Multimedia/Images/2025/04/Solar_Orbiter_s_widest_high-res_view_of_the_Sun
with a nice movie of the patches of the mosaic: https://www.esa.int/ESA_Multimedia/Images/2025/04/Making_a_mosaic_of_the_Sun
But there is more to come. Early May, we will publish an article on 'Emilomagic', the magic behind the making of the EUI mosaic. You will learn who or what Emilomagic is.
Review of space weather (14 Apr 2025 - 20 Apr 2025)
Solar Active Regions (ARs) and flares
Solar flaring activity was high in the beginning of the week, with five M-class flares recorded on April 13-14 and moderate to low for the rest of the week. In total, eight M-class flares were recorded. The strongest flares were an M4.2 flare (SIDC Flare 4126) peaking at 06:50 UTC on April 14, associated with SIDC Sunspot Group 469 (NOAA Active Region 4055) and an M4.4 flare (SIDC Flare 4156) from beyond the east limb, peaking at 23:50 UTC on April 18.
Eleven active regions were present on the visible side of the Sun. The most complex one was SIDC Sunspot Group 469 (NOAA Active Region 4055, magnetic type beta-gamma-delta). SIDC Sunspot Groups 450, 473 and 474 (NOAA Active Regions 4060, 4062 and 4064) evolved to magnetic type beta-gamma, with even an 'upgrade' of SIDC Sunspot Group 450 to beta-delta on April 18.
Coronal mass ejections
Few Coronal Mass Ejections (CMEs) were detected during the week, but were either events near the west or east limb or backsided and had no impact on Earth.
The most remarkable, wide CME was observed in LASCO/C2 and LASCO/C3 coronagraph images. The CME lifted off around 00:00 UTC on April 19. It was most likely associated with the M4.4 flare (SIDC Flare 4156) that peaked at 23:50 UTC on April 18.
A few filament eruptions were also observed in SDO/AIA 304 solar images.
Coronal Holes
Three coronal holes have crossed the central meridian. The first (SIDC Coronal Hole 105) was an equatorial, negative polarity coronal hole that crossed the central meridian on April 15. The second was a southern, mid-latitude, negative polarity coronal hole (SIDC Coronal Hole 104) that started to cross the central meridian on April 17. The third was an equatorial, positive polarity coronal hole (returning SIDC Coronal Hole 82) that crossed the central meridian on April 19.
Proton flux levels
The greater than 10 MeV proton flux was below the 10 pfu threshold throughout the week.
Electron fluxes at GEO
The greater than 2 MeV electron flux as measured by GOES 16 and GOES 18 was above the threshold at different times during the week, following a diurnal variation.
The 24-hour electron fluence was nominal.
Solar wind at L1
The solar wind conditions were enhanced at the beginning of the week, under the waning influence of a high-speed stream from the elongated, negative polarity coronal hole (SIDC Coronal Hole 87) that reached the central meridian on April 07.
A shock was detected in the solar wind (DSCOVR) at 16:35 UTC on April 15. The interplanetary magnetic field jumped from 6 nT to 17 nT and briefly reached values up to 23 nT. The Bz component jumped from -4 nT to -11 nT. The solar wind speed jumped from 400 km/s to around 480 km/s and then increased up to 515 km/s. The solar wind density at the shock jumped from 5.6 ppcc to around 24.4 ppcc. The shock was most likely related to an interplanetary Coronal Mass Ejection (ICME), associated with the CMEs that lifted off around 23:00 UTC on April 12 and the partial halo CME that lifted off around 08:30 UTC on April 13.
A gradual return to the slow solar wind regime followed. The solar wind conditions (ACE and DSCOVR) were enhanced again on April 20, likely due to the high-speed stream from the southern, positive polarity coronal hole (SIDC Coronal Hole 104).
Geomagnetism
Geomagnetic conditions globally reached severe storm levels (NOAA Kp 8- ) in the UTC evening of April 16. Geomagnetic conditions locally reached moderate storm levels (K BEL 6) during the same period. The geomagnetic storms were most likely the result of the arrivals of the interplanetary Coronal Mass Ejections (ICMEs), associated with the CMEs that lifted off around 23:00 UTC on April 12 and the partial halo CME that lifted off around 08:30 UTC on April 13.
Unsettled to active levels and an isolated minor storm (NOAA Kp 3 to 5, K BEL 3 to 5) were observed during the rest of the week.
PROBA2 Observations (14 Apr 2025 - 20 Apr 2025)
Solar activity
Solar flare activity fluctuated from low to moderate during the week.
In order to view the activity of this week in more detail, we suggest to go to the following website from which all the daily (normal and difference) movies can be accessed: https://proba2.oma.be/ssa
This page also lists the recorded flaring events.
A weekly overview movie can be found here (SWAP week 786). http://proba2.oma.be/swap/data/mpg/movies/weekly_movies/weekly_movie_2025_04_14.mp4
Details about some of this week's events can be found further below.
If any of the linked movies are unavailable they can be found in the P2SC movie repository here https://proba2.sidc.be/swap/data/mpg/movies/
Friday Apr 18
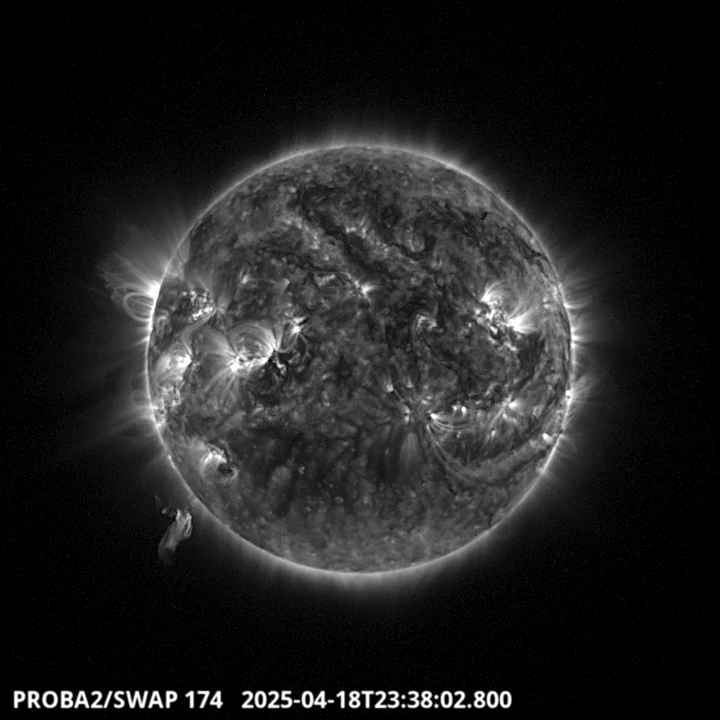
SWAP shows a mass of plasma just dropped off the edge of the sun on 2025-Apr-18. This is
the result of an M4.4-class solar flare behind the sun's eastern limb. Find a SWAP movie of the event here https://proba2.sidc.be/swap/movies/20250418_swap_movie.mp4
Saterday Apr 19
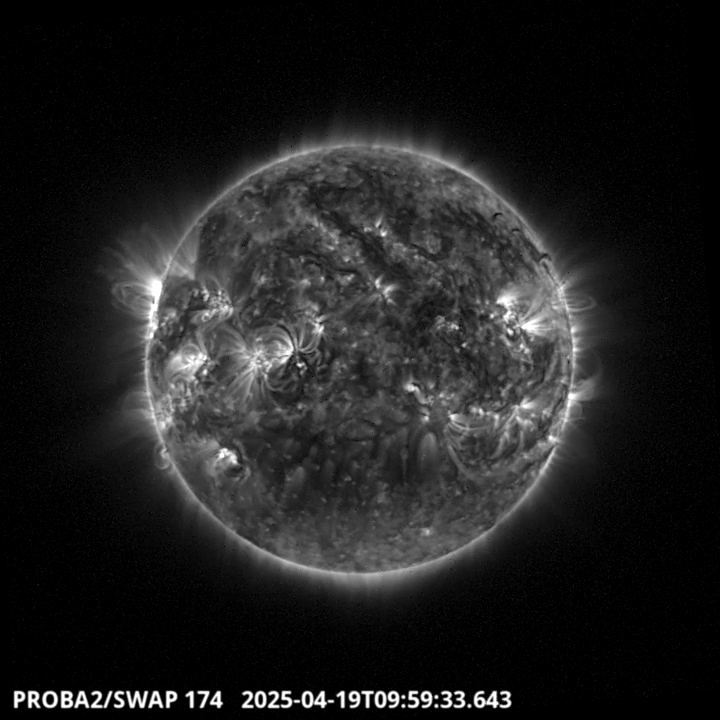
Large coronal hole on the southern part of the solar disk. Find a SWAP movie of the event here https://proba2.sidc.be/swap/movies/20250419_swap_movie.mp4
International Sunspot Number by SILSO

The daily Estimated International Sunspot Number (EISN, red curve with shaded error) derived by a simplified method from real-time data from the worldwide SILSO network. It extends the official Sunspot Number from the full processing of the preceding month (green line), a few days more than one solar rotation. The horizontal blue line shows the current monthly average. The yellow dots give the number of stations that provided valid data. Valid data are used to calculate the EISN. The triangle gives the number of stations providing data. When a triangle and a yellow dot coincide, it means that all the data is used to calculate the EISN of that day.
Noticeable Solar Events
| DAY | BEGIN | MAX | END | LOC | XRAY | OP | 10CM | TYPE | Cat | NOAA |
| 14 | 0600 | 0605 | 0611 | M1.4 | 26 | 4055 | ||||
| 14 | 0636 | 0650 | 0658 | N6W82 | M4.2 | SF | 26 | 4055 | ||
| 15 | 1004 | 1020 | 1028 | M1.5 | ||||||
| 15 | 1757 | 1813 | 1827 | M1.3 | ||||||
| 18 | 2308 | 2350 | 0015 | M4.4 | II/1 | |||||
| 20 | 1137 | 1211 | 1259 | M1.0 | 4068 |
| LOC: approximate heliographic location | TYPE: radio burst type |
| XRAY: X-ray flare class | Cat: Catania sunspot group number |
| OP: optical flare class | NOAA: NOAA active region number |
| 10CM: peak 10 cm radio flux |
Geomagnetic Observations in Belgium

Local K-type magnetic activity index for Belgium based on data from Dourbes (DOU) and Manhay (MAB). Comparing the data from both measurement stations allows to reliably remove outliers from the magnetic data. At the same time the operational service availability is improved: whenever data from one observatory is not available, the single-station index obtained from the other can be used as a fallback system.
Both the two-station index and the single station indices are available here: http://ionosphere.meteo.be/geomagnetism/K_BEL/
The SIDC space weather briefing
The forecaster on duty presented the SIDC briefing that gives an overview of space weather from April 13 to 20.
The pdf of the presentation: https://www.stce.be/briefings/20250421_SWbriefing.pdf

Review of Ionospheric Activity


VTEC time series at 3 locations in Europe from 14 Apr 2025 till 20 Apr 2025
The top figure shows the time evolution of the Vertical Total Electron Content (VTEC) (in red) during the last week at three locations:
a) in the northern part of Europe(N 61deg E 5deg)
b) above Brussels(N 50.5deg, E 4.5 deg)
c) in the southern part of Europe(N 36 deg, E 5deg)
This top figure also shows (in grey) the normal ionospheric behaviour expected based on the median VTEC from the 15 previous days.
The time series below shows the VTEC difference (in green) and relative difference (in blue) with respect to the median of the last 15 days in the North, Mid (above Brussels) and South of Europe. It thus illustrates the VTEC deviation from normal quiet behaviour.
The VTEC is expressed in TECu (with TECu=10^16 electrons per square meter) and is directly related to the signal propagation delay due to the ionosphere (in figure: delay on GPS L1 frequency).
The Sun's radiation ionizes the Earth's upper atmosphere, the ionosphere, located from about 60km to 1000km above the Earth's surface.The ionization process in the ionosphere produces ions and free electrons. These electrons perturb the propagation of the GNSS (Global Navigation Satellite System) signals by inducing a so-called ionospheric delay.
See http://stce.be/newsletter/GNSS_final.pdf for some more explanations; for more information, see https://gnss.be/SpaceWeather
Courses, seminars and events
Courses, seminars, presentations and events with the Sun-Space-Earth system and Space Weather as the main theme. We provide occasions to get submerged in our world through educational, informative and instructive activities.
* April 28-30, 2025, STCE Space Weather Introductory Course, Brussels, Belgium - register: https://events.spacepole.be/event/214/
* May 5, 2025, STCE seminar: Ionosonde Measurements at FMI
* May 26-27, 2025, STCE Course Space Weather impacts on aviation, online - register: https://events.spacepole.be/event/215/
* Jun 7-9, STCE stand: Dichtbij de Zon, Nerdland Festival, Wachtebeke, Belgium, https://www.nerdlandfestival.be/nl/
* Jun 20, 2025, STCE seminar: The Vigil mission to L5
* Jun 23-25, 2025, STCE Space Weather Introductory Course, Brussels, Belgium - register: https://events.spacepole.be/event/216/
* Sep 15-16, 2025, STCE Course Space Weather impacts on aviation, online - register: https://events.spacepole.be/event/218/
* Oct 23-25, ESWW Space Weather Course by Umea University and STCE, Kiruna, Sweden
* Oct 27-31, European Space Weather Week, Umea, Sweden - https://esww.eu/
* Nov 17-19, 2025, STCE Space Weather Introductory Course, Brussels, Belgium - register: https://events.spacepole.be/event/217/
To register for a course and check the seminar details, navigate to the STCE Space Weather Education Center: https://www.stce.be/SWEC
If you want your event in the STCE newsletter, contact us: stce_coordination at stce.be

Website: https://www.stce.be/SWEC