- Table of Content
- 1.Supersized sun...
- 2.Submit your ab...
- 3.ESWW song cont...
- 4.Review of spac...
- 5.International ...
- 6.PROBA2 Observa...
- 7.Noticeable Sol...
- 8.Geomagnetic Ob...
- 9.Review of Iono...
- 10.The SIDC space...
- 11.Courses, semin...
2. Submit your abstract to the ESWW session on Refining the Sunspot Number Series
3. ESWW song contest
4. Review of space weather
5. International Sunspot Number by SILSO
6. PROBA2 Observations (28 Apr 2025 - 4 May 2025)
7. Noticeable Solar Events
8. Geomagnetic Observations in Belgium
9. Review of Ionospheric Activity
10. The SIDC space weather briefing
11. Courses, seminars and events
Supersized sunspot group
NOAA 14079 rotated over the Sun's east limb on 28 April. It was the return of NOAA 14055 which was "born" on the solar disk just 3 weeks earlier and quickly became the source of numerous M-class flares. NOAA 14079 initially seemed to continue that tradition, with an M-class flare on both 29 and 30 April. But then it fell silent, producing only a small number of C-class flares during the subsequent days. This was quite surprizing, as it was certainly one of the larger and more complex sunspot groups of this solar cycle. NOAA/USAF (https://www.swpc.noaa.gov/products/solar-region-summary ) calculated its area to be around 1200 MH. Here, "MH" is a millionth of a solar hemisphere, and the total surface area of the Earth corresponds to about 170 MH. As usual, the true sunspot area is about 40% higher than that reported by the NOAA/USAF network. For example SIDC/USET (https://www.sidc.be/spaceweatherservices/applications/solarmap/ ) and ASSA (South Korea ; https://spaceweather.kasa.go.kr/assa ) reported it to be around 1650 MH. The differences are due to the type (drawing, image,...), the size of the solar disk, and the methodology used (automatic, squares, best-fitting ellipses,...). So, the sunspot area of NOAA 14079 was about 7 to 10 times that of the Earth's surface area. Using eclipse glasses, it was easily visible to the "naked eye" from 1 May onwards. The SDO/HMI imagery underneath shows NOAA 14079 in white light (left) and with a magnetogram overlaid (right). The stills date from 3 May around 12:00UTC. A clip covering the period from 1 to 5 May (UTC noon) is available in the online version of this article at https://www.stce.be/news/764/welcome.html
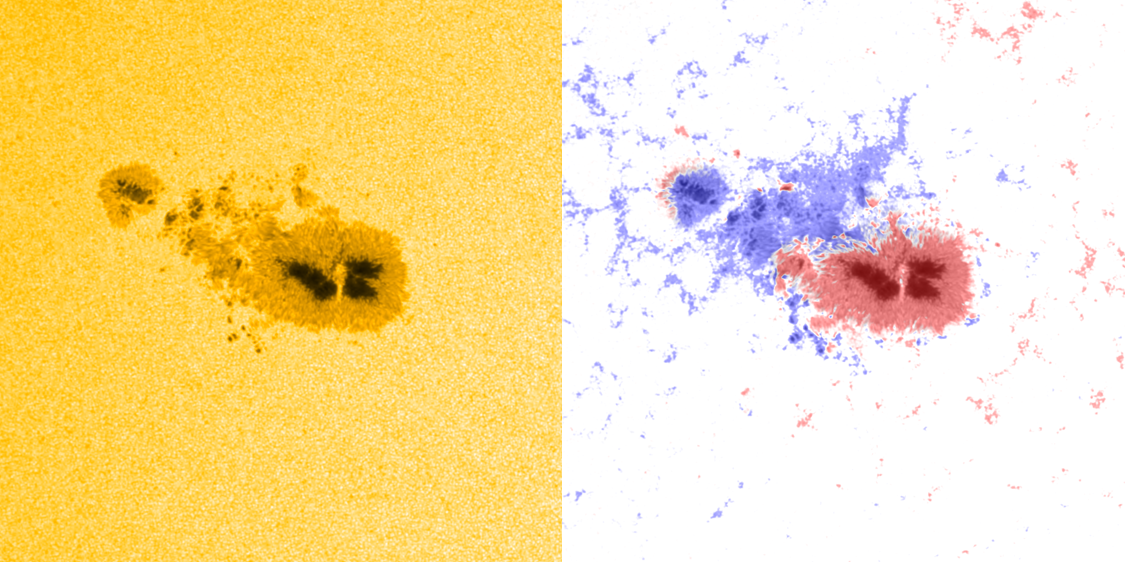
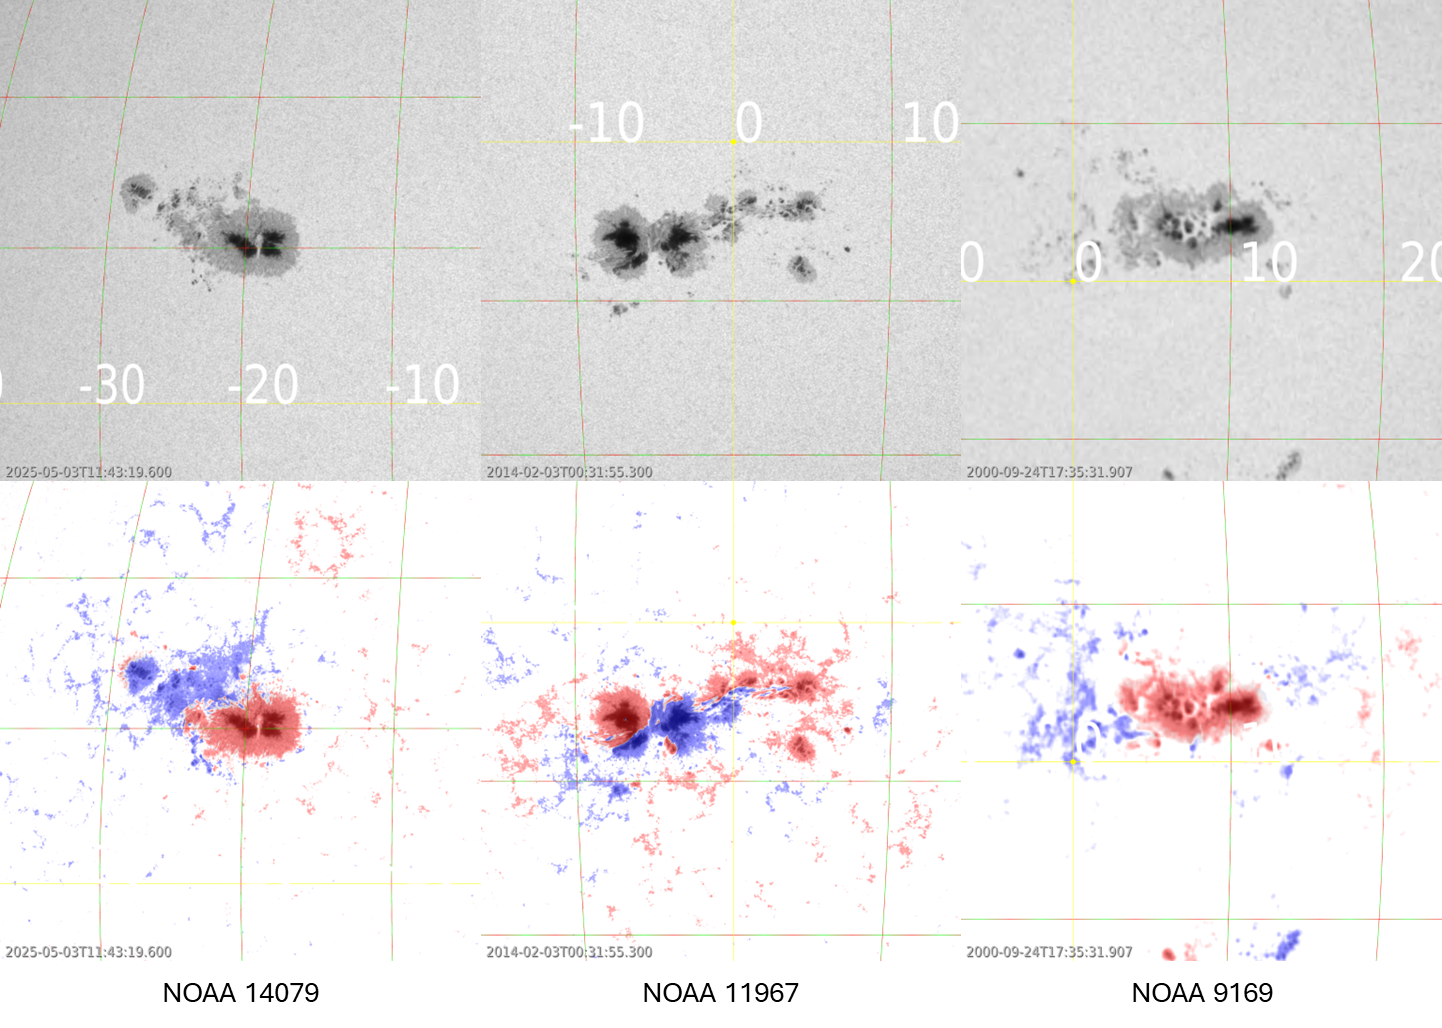
From the imagery above, it is clear that the main spot of NOAA 14079 is relatively symmetric, with a lack of strong magnetic delta structures (see the STCE SWx classification page at https://www.stce.be/educational/classification#wilson ). Some short-lived delta's were occasionally present in the middle portion's penumbra, but the few umbrae of opposite magnetic polarity were usually well separated, making interaction and thus strong flaring nearly impossible. Large but flare-inactive groups have been seen in the past. The imagery underneath (with grid squares of 10 by 10 degrees) shows white light images (top) and overlaid magnetograms (bottom) for NOAA 14079, NOAA 11967 (February 2014) and NOAA 9169 (September 2000). According to the NOAA archives, the latter was the largest region of this trio with an area close to 2000 MH. It had, just as NOAA 14079, no obvious delta structures and produced only 3 M-class flares and a single X1 flare. NOAA 11967 had about the same sunspot area as NOAA 14079, and produced 39 M-class flares. However, despite the group having a strong magnetic delta structure in its trailing sunspot, three quarters of the M-class flares were low-intensity events (M3 or less) and not a single (zero, nada) X-class flare was produced. It reminds space weather forecasters of another, exceptional situation, when NOAA 12192, the largest sunspot group of the previous solar cycle, produced numerous and strong X-class flares, none of them associated with any coronal mass ejection (CME) - see the STCE newsitem at https://www.stce.be/news/280/welcome.html. More than 10 years later, peculiar cases like these perfectly illustrate there are still significant gaps in our understanding of the generation of solar flares and CMEs.
Submit your abstract to the ESWW session on Refining the Sunspot Number Series
Dear colleagues,
We would like to draw your attention to the session "Refining the Sunspot Number Series : challenges and benefits for the Space Climate Community".
The Sunspot Number (SN; Clette and Lefèvre, 2016 ) and Group Number (GN; Chatzistergos et al., 2017) series are the only direct time series (1610- present) that trace the long-term variations of solar activity over the past centuries. These records are crucial not only for solar/stellar physics and space weather studies but also for assessing the Sun's influence on Earth's climate.
While modern observations provide better links with space weather effects, SN and GN remain the longest direct observations of solar activity, and thus, are an indispensable bridge linking past and present solar behavior.
In 2016, an international team led a major update of the existing SN/GN series. However, issues remain and a decade after the release of SN version 2.0, efforts to refine sunspot calibrations continue, leading to several new versions of GN (Clette et al., 2023). Current work is focused on updating the GN database (following Vaquero et al., 2016), culminating in the development of a new SN database for historical data and the subsequent reconstruction of GN and SN, paving the way for version 3.0.
The goal of this session is to provide an update on recent improvements in the SN and GN records and seek community feedback to help better assess user needs.
If you want to present work that could contribute to this session, we invite you to submit your abstract by 15 May 2025 here (https://esww.aeronomie.be/calls/call-for-abstracts ).
ESWW song contest
The ESWW call for songs is open!
History
The European Space Weather Week (ESWW) is internationally recognized as one of the premier gatherings for scientists, end-users, as well as policymakers working in space weather and related fields. But amidst the technical discussions, data analysis, and collaborative projects, a unique tradition has emerged—one that brings out the artistic side of the space weather community: Music Night.
The idea was simple: space weather enthusiasts are not only dedicated researchers but also passionate musicians. Why not bring these talents together for a night of fun? In that spirit, the first Music Night of ESWW was introduced in 2014 in Liège by the Belgian local organization committee.
Over the years, the Music Night has evolved, featuring everything from solo acts to full-band performances, sing-alongs, and even science-themed parodies of classic songs. With that Music Night has become a highlight of ESWW, fostering collaboration beyond the lecture halls and poster sessions.
This unique tradition showcases not just the scientific creativity of the attendees, but also their musical talents, proving that even in a highly specialized field, there is always room for artistic expression.
Music Night, the next level
Are you ready to unleash your inner rock star, lyricist, or mad scientist (in the best way possible)? This year at ESWW, we're taking Music Night to the next level with a Science-Themed Song Parody Competition! The winning songwriter(s) will be awarded one free Conference ticket and the song will be premiered at the ESWW Music Night, where it will be announced as the official ESWW song of 2025.
Submission instructions: https://esww.eu/social-activities/music-night

Review of space weather
Solar Active Regions (ARs) and flares
Solar flaring activity ranged from moderate to low. On April 29, SIDC Sunspot Groups 489 and 469 (NOAA ARs 4078 and 4079) released three M-class flares. It was SIDC Sunspot Group 469 (NOAA AR 4079) which released on April 30 the strongest flare, a M2.0 flare, of the week.
SIDC Sunspot Group 469 was the most persistent and magnetically complex region (Beta-Gamma-Delta), generating most of the flares, including eight C-class flares on May 3. Although that SIDC Sunspot Group 492 (NOAA AR 4082) did a credible effort by releasing a C5 flare on May 4 which was the highest ranked in the C-level.
Coronal mass ejections
The filaments present on the Sun, remained stable. No Earth-directed coronal mass ejections were observed during the week.
Coronal Holes
SIDC Coronal Hole 99, a large trans-equatorial coronal hole with negative polarity, was the most prominent solar feature of the week. It crossed the central meridian on April 29. On May 1, SIDC Coronal Hole 109 (equatorial, negative polarity) and SIDC Coronal Hole 110 (high-latitude northern, negative polarity) appeared to merge forming an extended trans-equatorial coronal hole. On May 4, SIDC Coronal Hole 111, a new high-latitude southern coronal hole (negative polarity), began to cross the central meridian.
Solar Proton flux
The greater-than-10 MeV proton flux remained nominal.
Electron fluxes at GEO
At the beginning of the week, the greater-than-2 MeV electron flux remained below the 1000 pfu threshold. Starting from May 3, it became elevated, frequently exceeding the threshold in response to the ongoing high-speed solar wind streams. The 24-hour electron fluence increased to moderate levels on May 4.
Solar wind
Early in the week (April 28-30), the Earth was within a slow solar wind regime, with speeds between 400 km/s and 460 km/s. On May 2, a high-speed solar wind stream associated with SIDC Coronal Hole 99 began affecting Earth. Solar wind speeds peaked at 874 km/s on May 3, before gradually declining to about 500 km/s by the end of the week. The total interplanetary magnetic field (IMF) peaked at 14.5 nT on May 2, while the southward IMF component (Bz) remained mostly negative throughout, reaching a minimum of -13.1 nT, contributing to geomagnetic disturbances.
Geomagnetism
Geomagnetic conditions varied throughout the week. From April 28 to 30, the geomagnetic conditions were mostly quiet to unsettled. Starting May 1, geomagnetic activity increased, reaching minor storm levels (NOAA Kp = 5+) during the impact of the high-speed stream associated with the SIDC Coronal Hole 99. The periods of minor geomagnetic storms were observed to be driven by the sustained negative southward Bz and elevated solar wind speeds. Conditions remained mostly active during May 2-4, with local geomagnetic indices (K_BEL) fluctuating between 3 and 4.
International Sunspot Number by SILSO
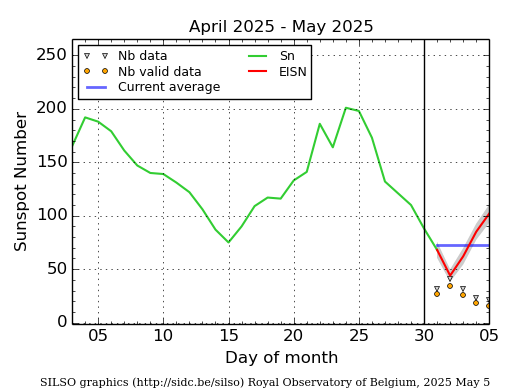
The daily Estimated International Sunspot Number (EISN, red curve with shaded error) derived by a simplified method from real-time data from the worldwide SILSO network. It extends the official Sunspot Number from the full processing of the preceding month (green line), a few days more than one solar rotation. The horizontal blue line shows the current monthly average. The yellow dots give the number of stations that provided valid data. Valid data are used to calculate the EISN. The triangle gives the number of stations providing data. When a triangle and a yellow dot coincide, it means that all the data is used to calculate the EISN of that day.
PROBA2 Observations (28 Apr 2025 - 4 May 2025)
Solar Activity
Solar flare activity fluctuated from low to moderate during the week.
In order to view the activity of this week in more detail, we suggest to go to the following website from which all the daily (normal and difference) movies can be accessed: https://proba2.oma.be/ssa
This page also lists the recorded flaring events.
A weekly overview movie (SWAP week 788) can be found here: https://proba2.sidc.be/swap/data/mpg/movies/weekly_movies/weekly_movie_2025_04_28.mp4.
Details about some of this week's events can be found further below.
If any of the linked movies are unavailable they can be found in the P2SC movie repository here: https://proba2.oma.be/swap/data/mpg/movies/.
Wednesday April 30
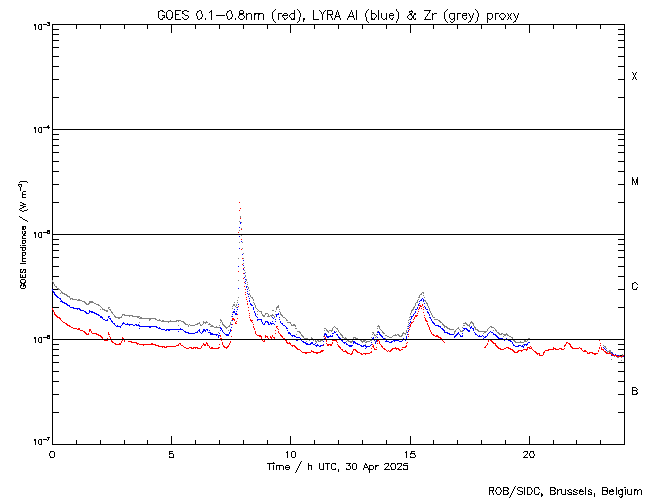
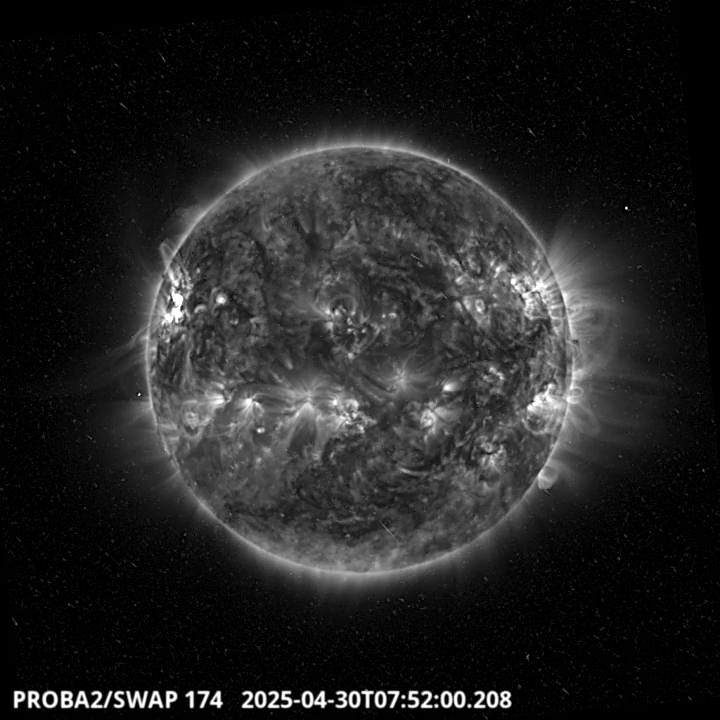
The largest flare of this week was an M2.0, and it was observed by LYRA (top panel) and SWAP (bottom panel). The flare peaked on 2025-Apr-30 at 07:51 UT and occurred on the eastern hemisphere of the Sun, originating from active region NOAA4079.
Find a SWAP movie of the event here: https://proba2.sidc.be/swap/movies/20250430_swap_movie.mp4.
Noticeable Solar Events
| DAY | BEGIN | MAX | END | LOC | XRAY | OP | 10CM | TYPE | Cat | NOAA |
| 29 | 0510 | 0513 | 0517 | N10E77 | M1.7 | 1F | 4079 | |||
| 29 | 0945 | 1002 | 1012 | N15W50 | M1.3 | 1N | III/1 | 54 | 4078 | |
| 29 | 1049 | 1057 | 1109 | N15W51 | M1.6 | 1N | VI/1III/1 | 54 | 4078 | |
| 30 | 0741 | 0751 | 0756 | N10E60 | M2.0 | 2 | 56 | 4079 |
| LOC: approximate heliographic location | TYPE: radio burst type |
| XRAY: X-ray flare class | Cat: Catania sunspot group number |
| OP: optical flare class | NOAA: NOAA active region number |
| 10CM: peak 10 cm radio flux |
Geomagnetic Observations in Belgium
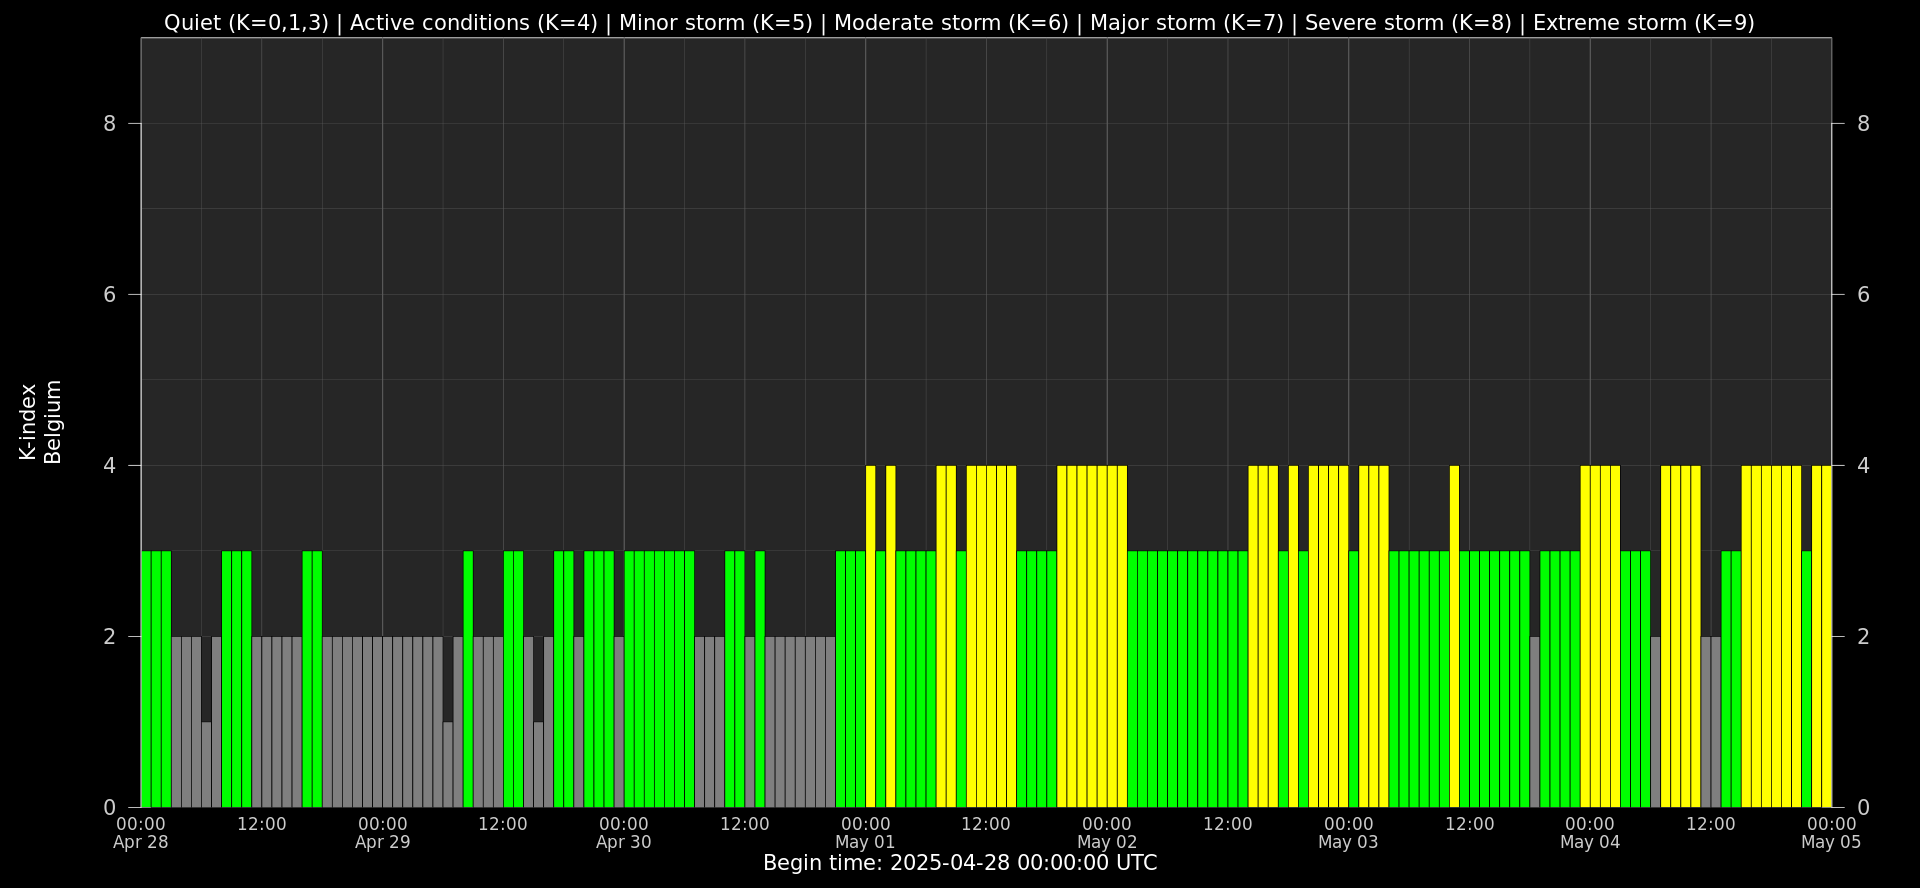
Local K-type magnetic activity index for Belgium based on data from Dourbes (DOU) and Manhay (MAB). Comparing the data from both measurement stations allows to reliably remove outliers from the magnetic data. At the same time the operational service availability is improved: whenever data from one observatory is not available, the single-station index obtained from the other can be used as a fallback system.
Both the two-station index and the single station indices are available here: http://ionosphere.meteo.be/geomagnetism/K_BEL/
Review of Ionospheric Activity

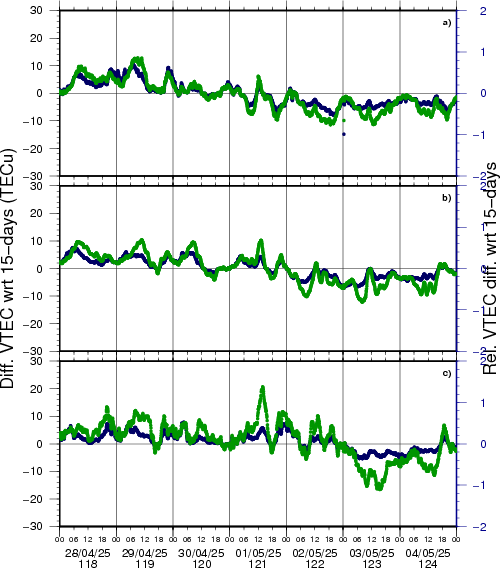
VTEC time series at 3 locations in Europe from 28 Apr 2025 till 4 May 2025
The top figure shows the time evolution of the Vertical Total Electron Content (VTEC) (in red) during the last week at three locations:
a) in the northern part of Europe(N 61deg E 5deg)
b) above Brussels(N 50.5deg, E 4.5 deg)
c) in the southern part of Europe(N 36 deg, E 5deg)
This top figure also shows (in grey) the normal ionospheric behaviour expected based on the median VTEC from the 15 previous days.
The time series below shows the VTEC difference (in green) and relative difference (in blue) with respect to the median of the last 15 days in the North, Mid (above Brussels) and South of Europe. It thus illustrates the VTEC deviation from normal quiet behaviour.
The VTEC is expressed in TECu (with TECu=10^16 electrons per square meter) and is directly related to the signal propagation delay due to the ionosphere (in figure: delay on GPS L1 frequency).
The Sun's radiation ionizes the Earth's upper atmosphere, the ionosphere, located from about 60km to 1000km above the Earth's surface.The ionization process in the ionosphere produces ions and free electrons. These electrons perturb the propagation of the GNSS (Global Navigation Satellite System) signals by inducing a so-called ionospheric delay.
See http://stce.be/newsletter/GNSS_final.pdf for some more explanations; for more information, see https://gnss.be/SpaceWeather
The SIDC space weather briefing
The forecaster on duty presented the SIDC briefing that gives an overview of space weather from 27 April to 4 May.
The pdf of the presentation can be found here: https://www.stce.be/briefings/20250505_SWbriefing.pdf
Courses, seminars and events
Courses, seminars, presentations and events with the Sun-Space-Earth system and Space Weather as the main theme. We provide occasions to get submerged in our world through educational, informative and instructive activities.
* May 14, 2025, STCE Seminar, Stratospheric ozone: retrieval, merging and analysis of satellite limb observations
* May 16, 2025, Presentation: Solar Physics news, Planetarium, Heizel, Belgium.
* May 22, 2025, school visiting ‘le centre Belge de Météorologie Spatiale’, Brussels, Belgium
* May 26-27, 2025, STCE Course Space Weather impacts on aviation, online - register: https://events.spacepole.be/event/215/
* Jun 7-9, STCE stand: Dichtbij de Zon, Nerdland Festival, Wachtebeke, Belgium, https://www.nerdlandfestival.be/nl/
* Jun 20, 2025, STCE seminar: The Vigil mission to L5
* Jun 23-25, 2025, STCE Space Weather Introductory Course, Brussels, Belgium - register: https://events.spacepole.be/event/216/
* Sep 15-16, 2025, STCE Course Space Weather impacts on aviation, online - register: https://events.spacepole.be/event/218/
* Oct 23-25, ESWW Space Weather Course by Umea University and STCE, Kiruna, Sweden
* Oct 27-31, European Space Weather Week, Umea, Sweden - https://esww.eu/
* Nov 17-19, 2025, STCE Space Weather Introductory Course, Brussels, Belgium - register: https://events.spacepole.be/event/217/
To register for a course and check the seminar details, navigate to the STCE Space Weather Education Center: https://www.stce.be/SWEC
If you want your event in the STCE newsletter, contact us: stce_coordination at stce.be

Website: https://www.stce.be/SWEC