- Table of Content
- 1.Coronal holes ...
- 2.Review of Sola...
- 3.International ...
- 4.PROBA2 Observa...
- 5.Noticeable Sol...
- 6.Geomagnetic Ob...
- 7.Review of Iono...
- 8.The SIDC Space...
- 9.Upcoming Activ...
2. Review of Solar and Geomagnetic Activity
3. International Sunspot Number by SILSO
4. PROBA2 Observations
5. Noticeable Solar Events
6. Geomagnetic Observations in Belgium
7. Review of Ionospheric Activity
8. The SIDC Space Weather Briefing
9. Upcoming Activities
Coronal holes do it again!
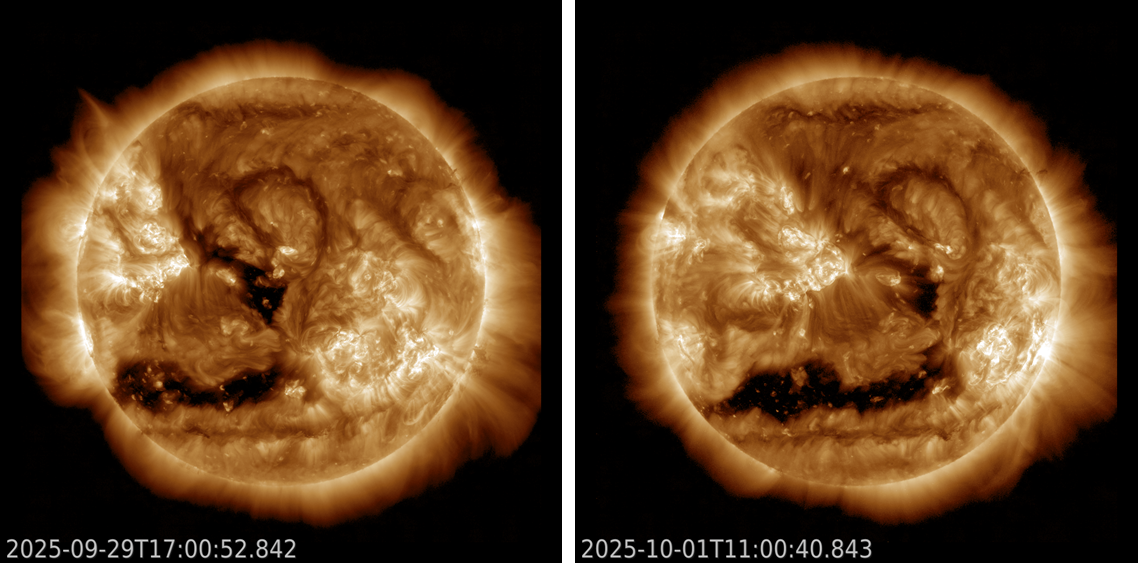
Coronal holes (CHs) are regions in the hot solar atmosphere ("corona") where the plasma density at that temperature is very low compared to its surroundings, and thus they look like dark shapes when viewed in extreme ultraviolet (EUV). Linked to unipolar (i.e. "open") magnetic fields stretching into space, they are the source of the high-speed solar wind which can create geomagnetic disturbances. Space weather forecasters at the SIDC of the Royal Observatory of Belgium assign a number to each CH that appears on the Sun (link - https://www.sidc.be/index.php/services/event-chains/coronal-holes ). The SDO EUV images (https://sdo.gsfc.nasa.gov/data/aiahmi/ ) underneath date from 29 September and 1 October, and show two such CHs as they transit the Sun's central meridian : SIDC CH 128 in the northern solar hemisphere, and the very elongated SIDC CH 123 in the southern hemisphere. They both had a positive magnetic polarity, meaning that the open magnetic field lines are pointing away from the Sun.
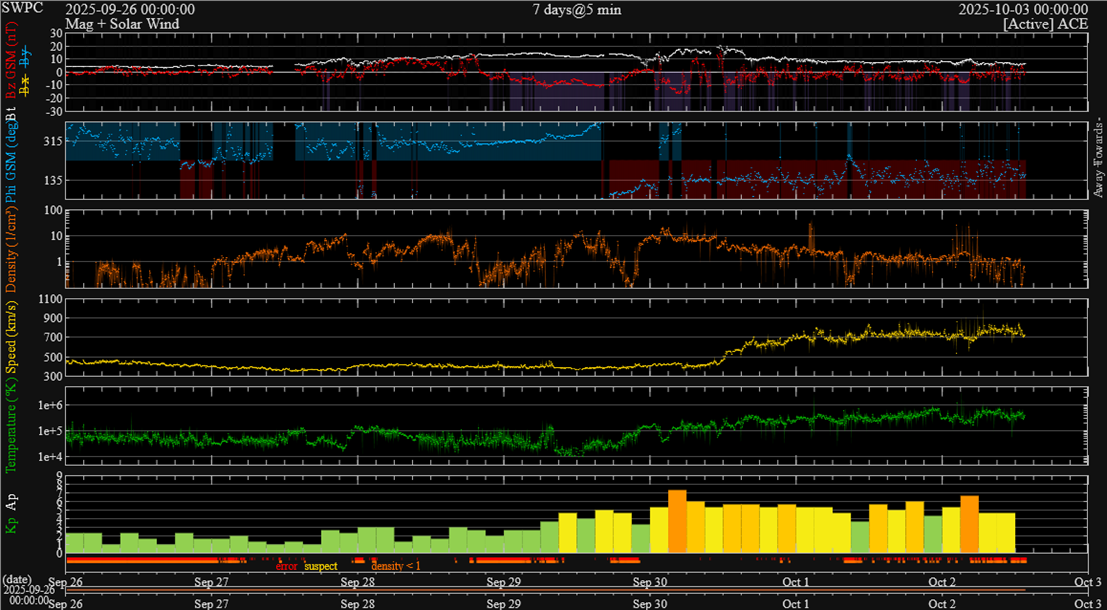
The related high-speed low-density solar wind stream arrived on 30 September, with wind speeds reaching values around 800 km/s (yellow curve in the DSCOVR chart underneath ; https://www.swpc.noaa.gov/products/real-time-solar-wind ). The resulting geomagnetic storm reached strong levels (Kp = 7 ; lower panel). In Belgium, moderate storming levels were reached (K_BEL = 6 ; http://ionosphere.meteo.be/geomagnetism/K_BEL/index.php ).
Solar wind speed was steady above 500 km/s from 30 September until 5 October. This created favorable conditions to significantly increase the number of energetic electrons (energies greater than 2 MeV). These particles are known to have a detrimental effect on spacecraft operations. The alert threshold of 1000 pfu (particle flux units) was already reached by the end of 1 October (GOES - https://www.swpc.noaa.gov/products/goes-electron-flux ). It would eventually reach 30.000 pfu during the subsequent days, as can be seen in the GOES chart underneath. Time (days) is on the horizontal axis, the electron flux -the number of highly energetic electrons (energies of 2 or more MeV) per cm2 per second and per steradian- is on the (logarithmic) vertical axis. The "M" and "N" indicates the local "Midnight" and "Noon" for the GOES-19 and GOES-18 satellites.
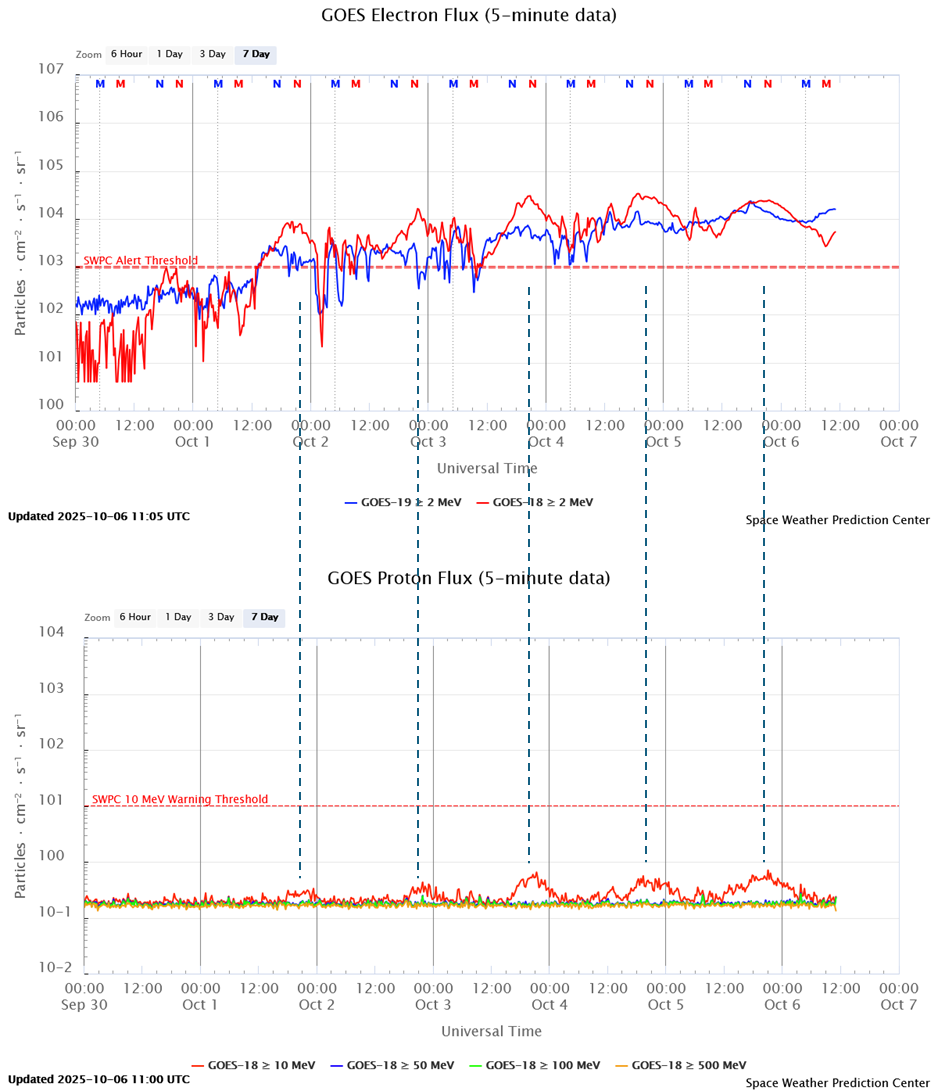
Interestingly, the proton flux as measured by GOES-18 (lower graph in the annotated figure above ; https://www.swpc.noaa.gov/products/goes-proton-flux ) also showed regular enhancements. Usually this would indicated some strong flare events on the Sun where such highly energetic particles are sometimes released. Not so this time. The regular timings of the daily proton flux enhancements give it all away. Indeed, they all peak around 20:00-21:00UTC, which corresponds to the current local noon for the GOES-18 satellite (illustrated by the vertical dashed lines connecting the electron flux and proton flux charts). This is the time when GOES-18 flies through the densest portion of the outer radiation belt.
As it turns out, the proton flux measuring device on GOES-18, and in particular the channel that measures the proton flux in the energy band between 12 and 25 MeV (Kress et al. 2021 - https://doi.org/10.1029/2021SW002750 ) is sensitive to enhanced fluxes of very energetic electrons. As NOAA writes in their data user report from 2023 (link: https://www.noaasis.noaa.gov/pdf/ps-pvr/goes18/SEISS/SGPS/Full/GOES-18_SEISS-SGPS_Full_Maturity_README.pdf ): "SGPS-X and +X P5 are contaminated with electrons when radiation belt fluxes are elevated. The magnitude of the contamination is very small with respect to solar proton fluxes during a moderate SEP event." SGPS means "Solar and Galactic Proton Sensor" and is the actual measuring device, +X and -X indicate the direction in which the sensors are looking (there are two), and P5 is the channel measuring the flux of protons with energies between 12 and 25 MeV. It is obvious that the effect is visible in the red curve of the proton chart (protons with energies greater than 10 MeV) only, and that the effect is indeed small compared to a typical proton event (remember: logarithmic scale!). In fact, it is not much of a nuisance if you know what is going on.
Review of Solar and Geomagnetic Activity
WEEK 1292 from 2025 Sep 29
Solar Active Regions (ARs) and flares
Solar flaring activity was moderate in the beginning of the last week, with eight M-class flares recorded until October 03. The strongest flare was an n M3.6 flare (SIDC Flare 5618) peaking at 01:45 UTC on September 29, associated with SIDC Sunspot Group 653 (NOAA Active Region 4232, magnetic type beta-gamma-delta). There was a total of twenty-one active regions on the visible disk during the week. The most complex ones were SIDC Sunspot Groups 648, 653 657 (NOAA Active Regions 4230, 4232, 4236), which developed a magnetic type of beta-gamma-delta at different times during the week.
Coronal mass ejections
Numerous Coronal Mass Ejections (CMEs) were detected during the week, most of them not Earth-directed. Some important events were the following.
SIDC CME 563 was observed in LASCO/C2 coronagraph imagery, starting from around 09:00 UTC on September 28. It was most likely associated with the M6.4 flare (SIDC Flare 5601) that peaked at 08:43 UTC on September 28.
SIDC CME 565 was observed in LASCO/C2 and STEREO/COR2 coronagraph imagery, lifting off the southwest quadrant, starting from around 09:45 UTC on September 30. It was most likely associated with the M2.7 flare (SIDC Flare 5644) that peaked at 09:40 UTC on September 30.
A wide CME (SIDC CME 567) was observed in LASCO/C2 and LASCO/C3 coronagraph imagery, lifting off the southwest quadrant around 10:30 UTC on October 01. It was most likely associated with eruptive activity near SIDC Sunspot Groups 648 and 659 (NOAA Active Regions 4230 and 4238).
A wide CME (SIDC CME 569) was observed in LASCO/C2 and LASCO/C3 coronagraph imagery, lifting off the southeast limb around 00:20 UTC on October 03. It was most likely associated with eruptive activity behind the east limb.
A wide CME (SIDC CME 570) was observed in LASCO/C2 coronagraph imagery, lifting off the east limb around 07:00 UTC on October 03. It was most likely associated with the M1.5 flare (SIDC Flare 5665) that peaked at 05:23 UTC on October 03, associated with SIDC Sunspot Group 657 (NOAA Active Region 4236).
A slow, partial halo Coronal Mass Ejection (SIDC CME 571) was detected in LASCO/C2 and LASCO/C3 coronagraph imagery, lifting off the east limb starting from around 18:30 UTC on October 03. A possible association was a filament eruption in the northeast quadrant, observed in AIA 304 data around 16:00 UTC on October 03.
A wide CME (SIDC CME 574) was observed in LASCO/C2 and LASCO/C3 coronagraph imagery, lifting off the west limb starting from around 17:30 UTC on October 04. It was most likely associated with eruptive activity behind the west limb.
A wide CME (SIDC CME 577) was observed in LASCO/C2 coronagraph imagery, lifting off the west limb starting from 03:25 UTC on October 05. It was most likely associated with eruptive activity behind the west limb.
Coronal Holes
Two elongated coronal holes crossed the central meridian during the last week. The first (SIDC Coronal Hole 128) was an equatorial, positive polarity coronal hole in the northern hemisphere that crossed the central meridian on October 29. The second (SIDC Coronal Hole 123) was an equatorial, positive polarity coronal hole in the southern hemisphere that crossed the central meridian on October 30.
Proton flux levels
The greater than 10 MeV proton flux was below the 10 pfu threshold throughout the week.
Electron fluxes at GEO
The greater than 2 MeV electron flux as measured by GOES 18 and GOES 19 was below the 1000 pfu threshold in the beginning of the week. It exceeded the 1000 pfu threshold on October 01 and remained above it for the rest of the week. The 24-hour electron fluence was initially at nominal levels and increased to moderate (October 01) and then high levels (October 05).
Solar wind
The solar wind conditions (ACE) were enhanced in the beginning of the week, likely due to an ICME arrival related to the slow, wide Coronal Mass Ejection that lifted off around 02:00 UTC on September 24 (SIDC CME 564). Further enhancements were observed later due to the arrival of a high-speed stream from the two equatorial, positive polarity coronal holes (SIDC Coronal Holes 128 and 123). The solar wind speed reached a maximum of around 810 km/s. The interplanetary magnetic field reached a maximum on 20 nT, The Bz component reached a minimum of -16 nT. The interplanetary magnetic field angle phi switched from negative to positive since the UTC evening on September 29. Towards the end of the week, a gradual transition towards slow solar wind conditions was observed.
Geomagnetism
Geomagnetic conditions globally at the beginning of the week reached minor storm levels (NOAA Kp 5), due to an ICME arrival related to the slow, wide Coronal Mass Ejection that lifted off around 02:00 UTC on September 24 (SIDC CME 564). Geomagnetic conditions globally escalated to major storm levels (NOAA Kp 7+) in the UTC morning on September 30. A period of minor to moderate storm levels (NOAA Kp 5- to 6) followed, with a brief escalation to major storm levels (NOAA Kp 7-) in the UTC morning on October 03, under the continuous effect of the high-speed stream from the two equatorial, positive polarity coronal holes (SIDC Coronal Holes 128 and 123). A gradual decrease to active and unsettled levels was observed (NOAA Kp 3 to 4) towards the end of the week. Geomagnetic conditions locally reached moderate storm levels (K Bel 6) in the UTC morning on September 30. Mostly active to minor storm levels followed (K Bel 4 to 5), with a short interval of moderate storm levels early on October 02. A return to mostly unsettled and later quiet conditions was observed towards the end of the week.
International Sunspot Number by SILSO
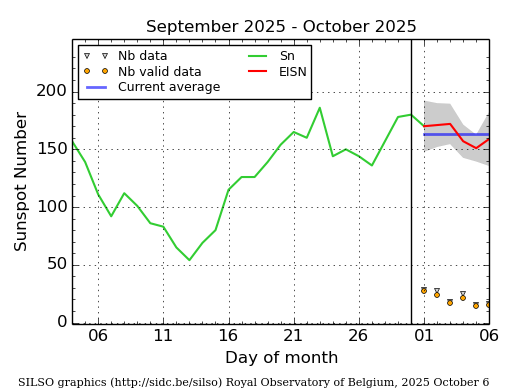
The daily Estimated International Sunspot Number (EISN, red curve with shaded error) derived by a simplified method from real-time data from the worldwide SILSO network. It extends the official Sunspot Number from the full processing of the preceding month (green line), a few days more than one solar rotation. The horizontal blue line shows the current monthly average. The yellow dots give the number of stations that provided valid data. Valid data are used to calculate the EISN. The triangle gives the number of stations providing data. When a triangle and a yellow dot coincide, it means that all the data is used to calculate the EISN of that day.
PROBA2 Observations
Solar Activity
Solar flare activity fluctuated from low to moderate during the week.
In order to view the activity of this week in more detail, we suggest to go to the following website from which all the daily (normal and difference) movies can be accessed: https://proba2.oma.be/ssa
This page also lists the recorded flaring events.
A weekly overview movie (SWAP week 810) can be found here: https://proba2.sidc.be/swap/data/mpg/movies/weekly_movies/weekly_movie_2025_09_29.mp4.
Details about some of this week's events can be found further below.
If any of the linked movies are unavailable they can be found in the P2SC movie repository here: https://proba2.oma.be/swap/data/mpg/movies/.
Tuesday September 30
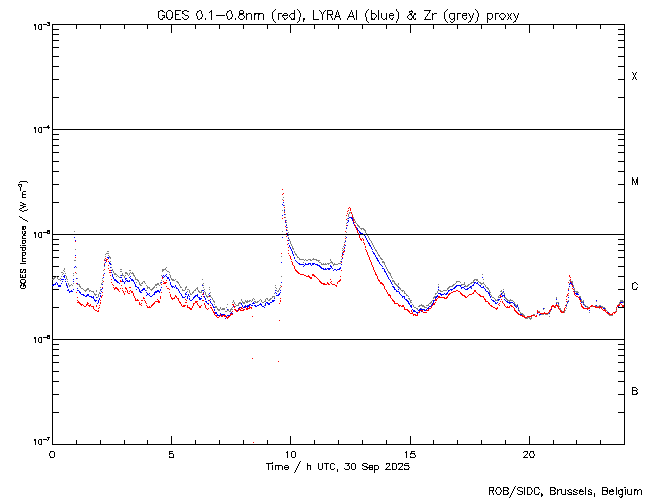
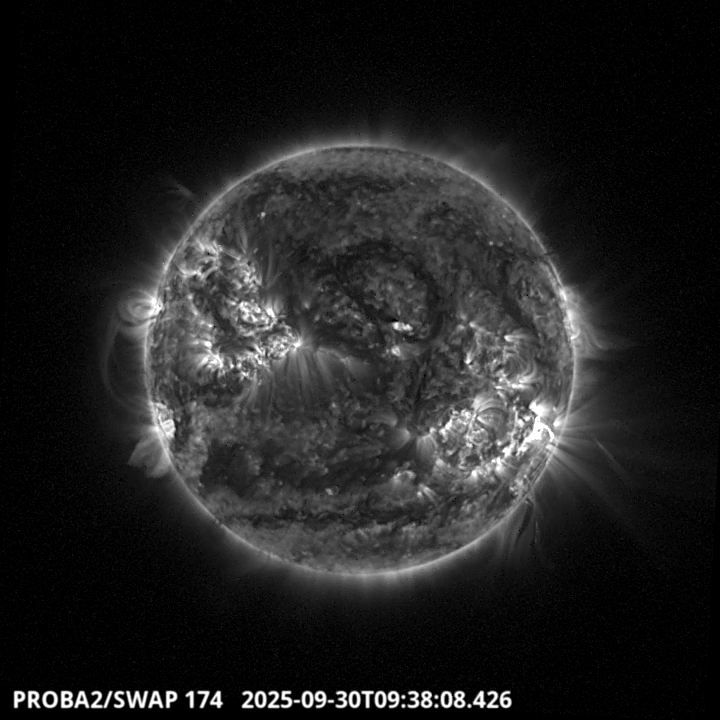
The largest flare of this week was an M3.6 on 2025-Sep-29, but due to a planned collision avoidance maneuver, the PROBA2 instruments were off during this time. The second largest flare was an M2.7, and it was observed by LYRA (top panel) and SWAP (bottom panel). The flare peaked on 2025-Sep-30 at 09:40 UT and occurred in the south-western quadrant of the Sun, originating from active region NOAA4227 (SIDC 614). The event was also associated with a large prominence eruption and coronal mass ejection.
Find a SWAP movie of the event here: https://proba2.sidc.be/swap/movies/20250930_swap_movie.mp4.
Noticeable Solar Events
| DAY | BEGIN | MAX | END | LOC | XRAY | OP | 10CM | TYPE | Cat | NOAA |
| 29 | 0137 | 0145 | 0147 | M3.6 | III/2VI/3 | 41 | 4232 | |||
| 29 | 1106 | 1115 | 1118 | N10E36 | M1.0 | SF | III/3 | 40 | 4236 | |
| 29 | 1123 | 1139 | 1152 | N2E40 | M1.1 | S | 41 | 4232 | ||
| 29 | 1156 | 1159 | 1202 | N16E45 | M1.0 | SF | VI/2 | 42 | 4233 | |
| 30 | 0051 | 0056 | 0058 | M1.2 | III/3 | 41 | 4232 | |||
| 30 | 0929 | 0940 | 0945 | S17W61 | M2.7 | 1N | 32 | 4226 | ||
| 30 | 1202 | 1227 | 1248 | S15W36 | M1.8 | SF | 35 | 4238 | ||
| 01 | 0215 | 0226 | 0237 | N6E20 | M1.2 | 1N | 41 | 4232 | ||
| 01 | 1636 | 1650 | 1700 | N8E12 | M1.2 | 1N | 41 | 4232 | ||
| 02 | 0200 | 0209 | 0211 | S9W85 | M1.2 | SF | II/3 | 32 | 4226 | |
| 03 | 0500 | 0523 | 0542 | N13W13 | M1.5 | 2N | CTM/2 | 40 | 4236 | |
| 03 | 1419 | 1436 | 1515 | M1.2 | II/2 | 44 | 4238 |
| LOC: approximate heliographic location | TYPE: radio burst type |
| XRAY: X-ray flare class | Cat: Catania sunspot group number |
| OP: optical flare class | NOAA: NOAA active region number |
| 10CM: peak 10 cm radio flux |
Geomagnetic Observations in Belgium
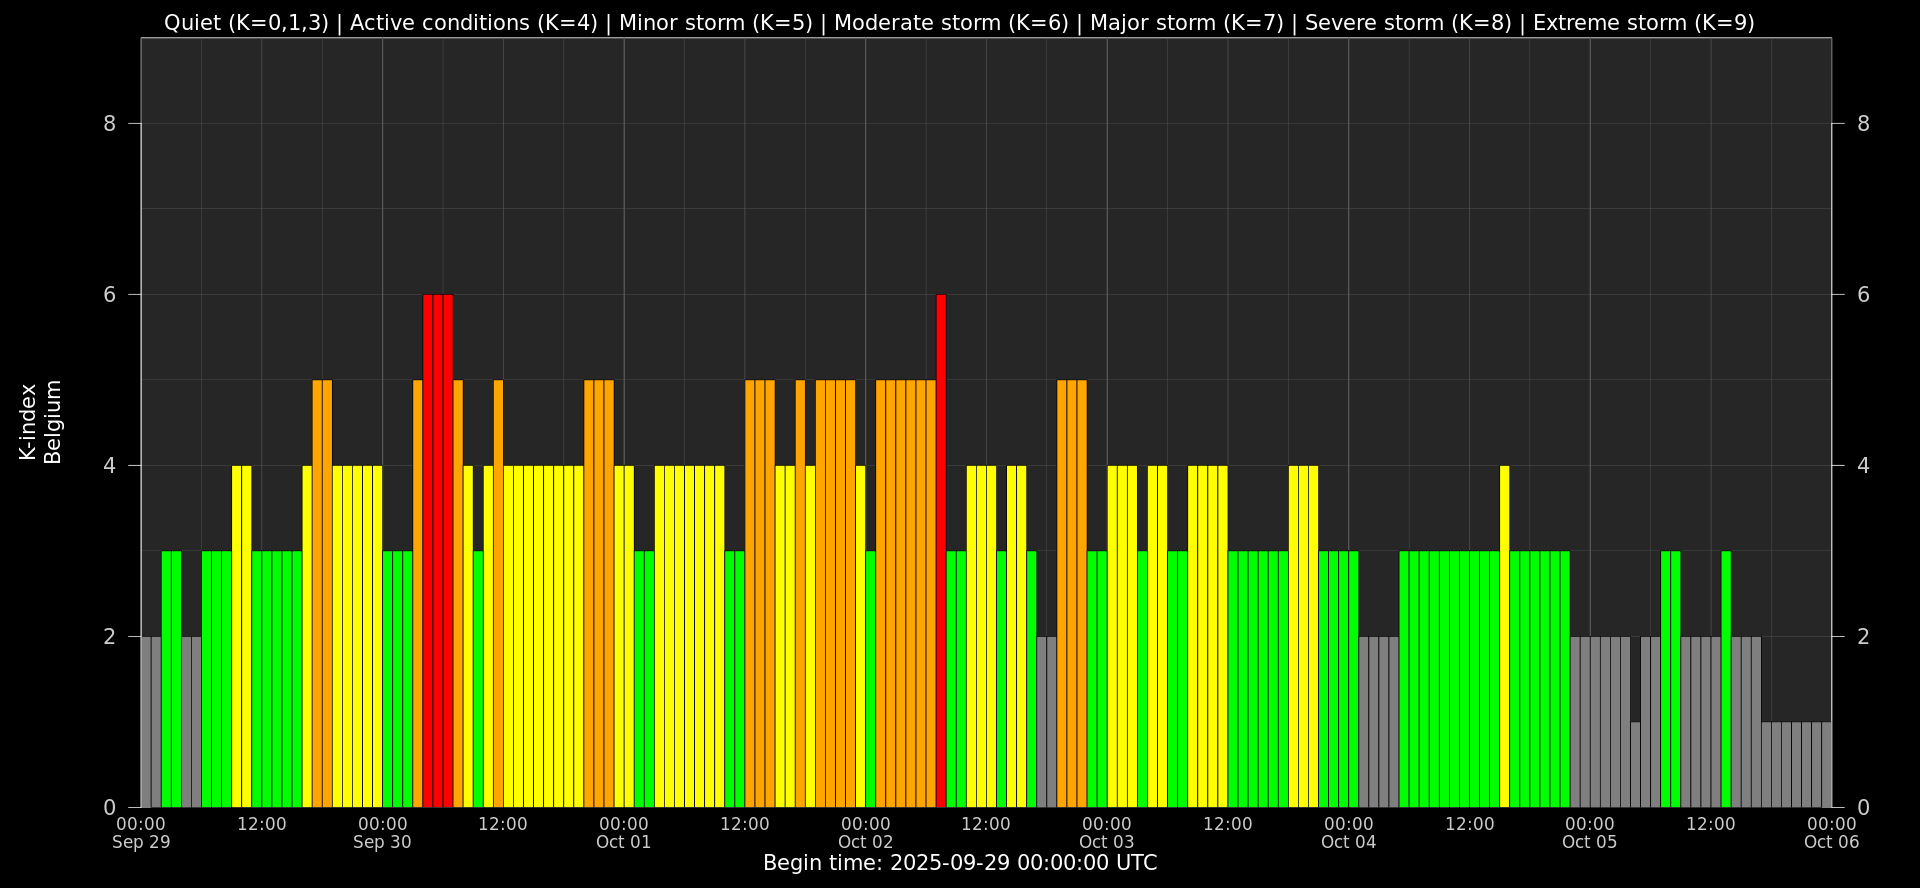
Local K-type magnetic activity index for Belgium based on data from Dourbes (DOU) and Manhay (MAB). Comparing the data from both measurement stations allows to reliably remove outliers from the magnetic data. At the same time the operational service availability is improved: whenever data from one observatory is not available, the single-station index obtained from the other can be used as a fallback system.
Both the two-station index and the single station indices are available here: http://ionosphere.meteo.be/geomagnetism/K_BEL/
Review of Ionospheric Activity
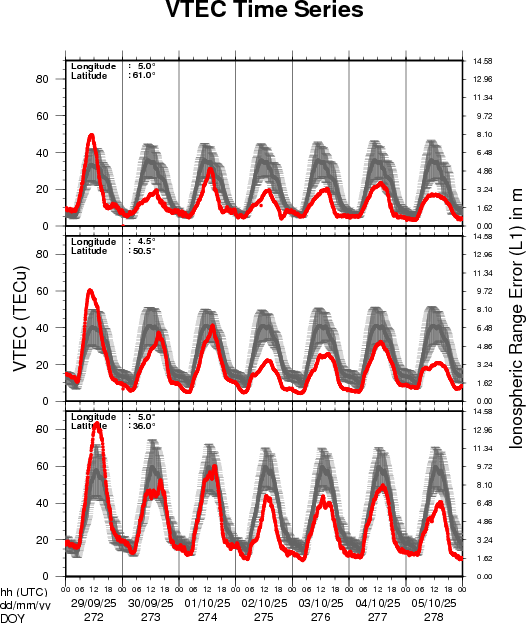

VTEC time series at 3 locations in Europe from 29 Sep 2025 till 5 Oct 2025
The top figure shows the time evolution of the Vertical Total Electron Content (VTEC) (in red) during the last week at three locations:
a) in the northern part of Europe(N 61deg E 5deg)
b) above Brussels(N 50.5deg, E 4.5 deg)
c) in the southern part of Europe(N 36 deg, E 5deg)
This top figure also shows (in grey) the normal ionospheric behaviour expected based on the median VTEC from the 15 previous days.
The time series below shows the VTEC difference (in green) and relative difference (in blue) with respect to the median of the last 15 days in the North, Mid (above Brussels) and South of Europe. It thus illustrates the VTEC deviation from normal quiet behaviour.
The VTEC is expressed in TECu (with TECu=10^16 electrons per square meter) and is directly related to the signal propagation delay due to the ionosphere (in figure: delay on GPS L1 frequency).
The Sun's radiation ionizes the Earth's upper atmosphere, the ionosphere, located from about 60km to 1000km above the Earth's surface.The ionization process in the ionosphere produces ions and free electrons. These electrons perturb the propagation of the GNSS (Global Navigation Satellite System) signals by inducing a so-called ionospheric delay.
See http://stce.be/newsletter/GNSS_final.pdf for some more explanations; for more information, see https://gnss.be/SpaceWeather
The SIDC Space Weather Briefing
The forecaster on duty presented the SIDC briefing that gives an overview of space weather from september 29 to October 5.
The pdf of the presentation can be found here: https://www.stce.be/briefings/20251006_SWbriefing.pdf

Upcoming Activities
Courses, seminars, presentations and events with the Sun-Space-Earth system and Space Weather as the main theme. We provide occasions to get submerged in our world through educational, informative and instructive activities.
* Oct 23-25, ESWW Space Weather Training by Umea University and STCE, Kiruna, Sweden - Full
* Oct 27-31, European Space Weather Week, Umea, Sweden - https://esww.eu/
* Nov 17-19, STCE Space Weather Introductory Course, Brussels, Belgium - register: https://events.spacepole.be/event/217/ - Full
* Feb 9-11, 2026, STCE Space Weather Introductory Course, Brussels, Belgium - register: https://events.spacepole.be/event/255/
* Mar 16-18, 2026, STCE course: Role of the ionosphere and space weather in military communications, Brussels, Belgium - register: https://events.spacepole.be/event/258/
* Apr 20-21, 2026, STCE cursus: inleiding tot het ruimteweer, Brussels, Belgium - register: https://events.spacepole.be/event/260/
* Mar 23, 2026, STCE lecture: From physics to forecasting, Space Weather course, ESA Academy, Redu, Belgium
* Jun 15-17, 2026, STCE Space Weather Introductory Course, Brussels, Belgium - register: https://events.spacepole.be/event/256/
* Oct 12-14, 2026, STCE Space Weather Introductory Course, Brussels, Belgium - register: https://events.spacepole.be/event/257/
* Nov 23-25, 2026, STCE course: Role of the ionosphere and space weather in military communications, Brussels, Belgium - register: https://events.spacepole.be/event/259/
* Dec 7-9, 2026, STCE Space Weather Introductory Course for Aviation, Brussels, Belgium - register: https://events.spacepole.be/event/262/
To register for a course and check the seminar details, navigate to the STCE Space Weather Education Center: https://www.stce.be/SWEC
If you want your event in the STCE newsletter, contact us: stce_coordination at stce.be
Website: https://www.stce.be/SWEC