- Table of Content
- 1.European Space...
- 2.Review of spac...
- 3.International ...
- 4.Noticeable Sol...
- 5.PROBA2 Observa...
- 6.Geomagnetic Ob...
- 7.The SIDC Space...
- 8.Review of Iono...
- 9.STCE training ...
2. Review of space weather
3. International Sunspot Number by SILSO
4. Noticeable Solar Events
5. PROBA2 Observations (27 Oct 2025 - 2 Nov 2025)
6. Geomagnetic Observations in Belgium
7. The SIDC Space Weather Briefing
8. Review of Ionospheric Activity
9. STCE training courses and seminars
European Space Weather Week 2025
Space Weather under discussion
From October 27 to 31, hundreds of people came together for the 21th European Space Weather Week in Umeå, Sweden to discuss new findings in space weather, which falls in the category 'Natural Hazard'.
There is nothing, until it is there
Space weather and space storms originate mainly from the Sun. Space weather describes in essence how a storm on the Sun grows, moves through space, arrives at our doorstep and finally sweeps across the planet where we live, where thousands satellites orbit, planes fly from one side to the other side, electricity runs through enormous cables, where navigation systems show the way.
Malfunctioning of systems
Space weather becomes visible as navigation errors, communication failures, damage in power grids, mis-guidance of vehicles on the ground or in the air.
Space weather is out there, whether we like it or not and it occurs with clock-like regularity. It impacts technology all over the world and in the air. The Arctic is an area that needs special attention. It is there where some space storms can more easily enter and where aurora enlightens more often the night sky.
It is therefore not that crazy, actually, to have Umeå as the setting for the European Space Weather Week.
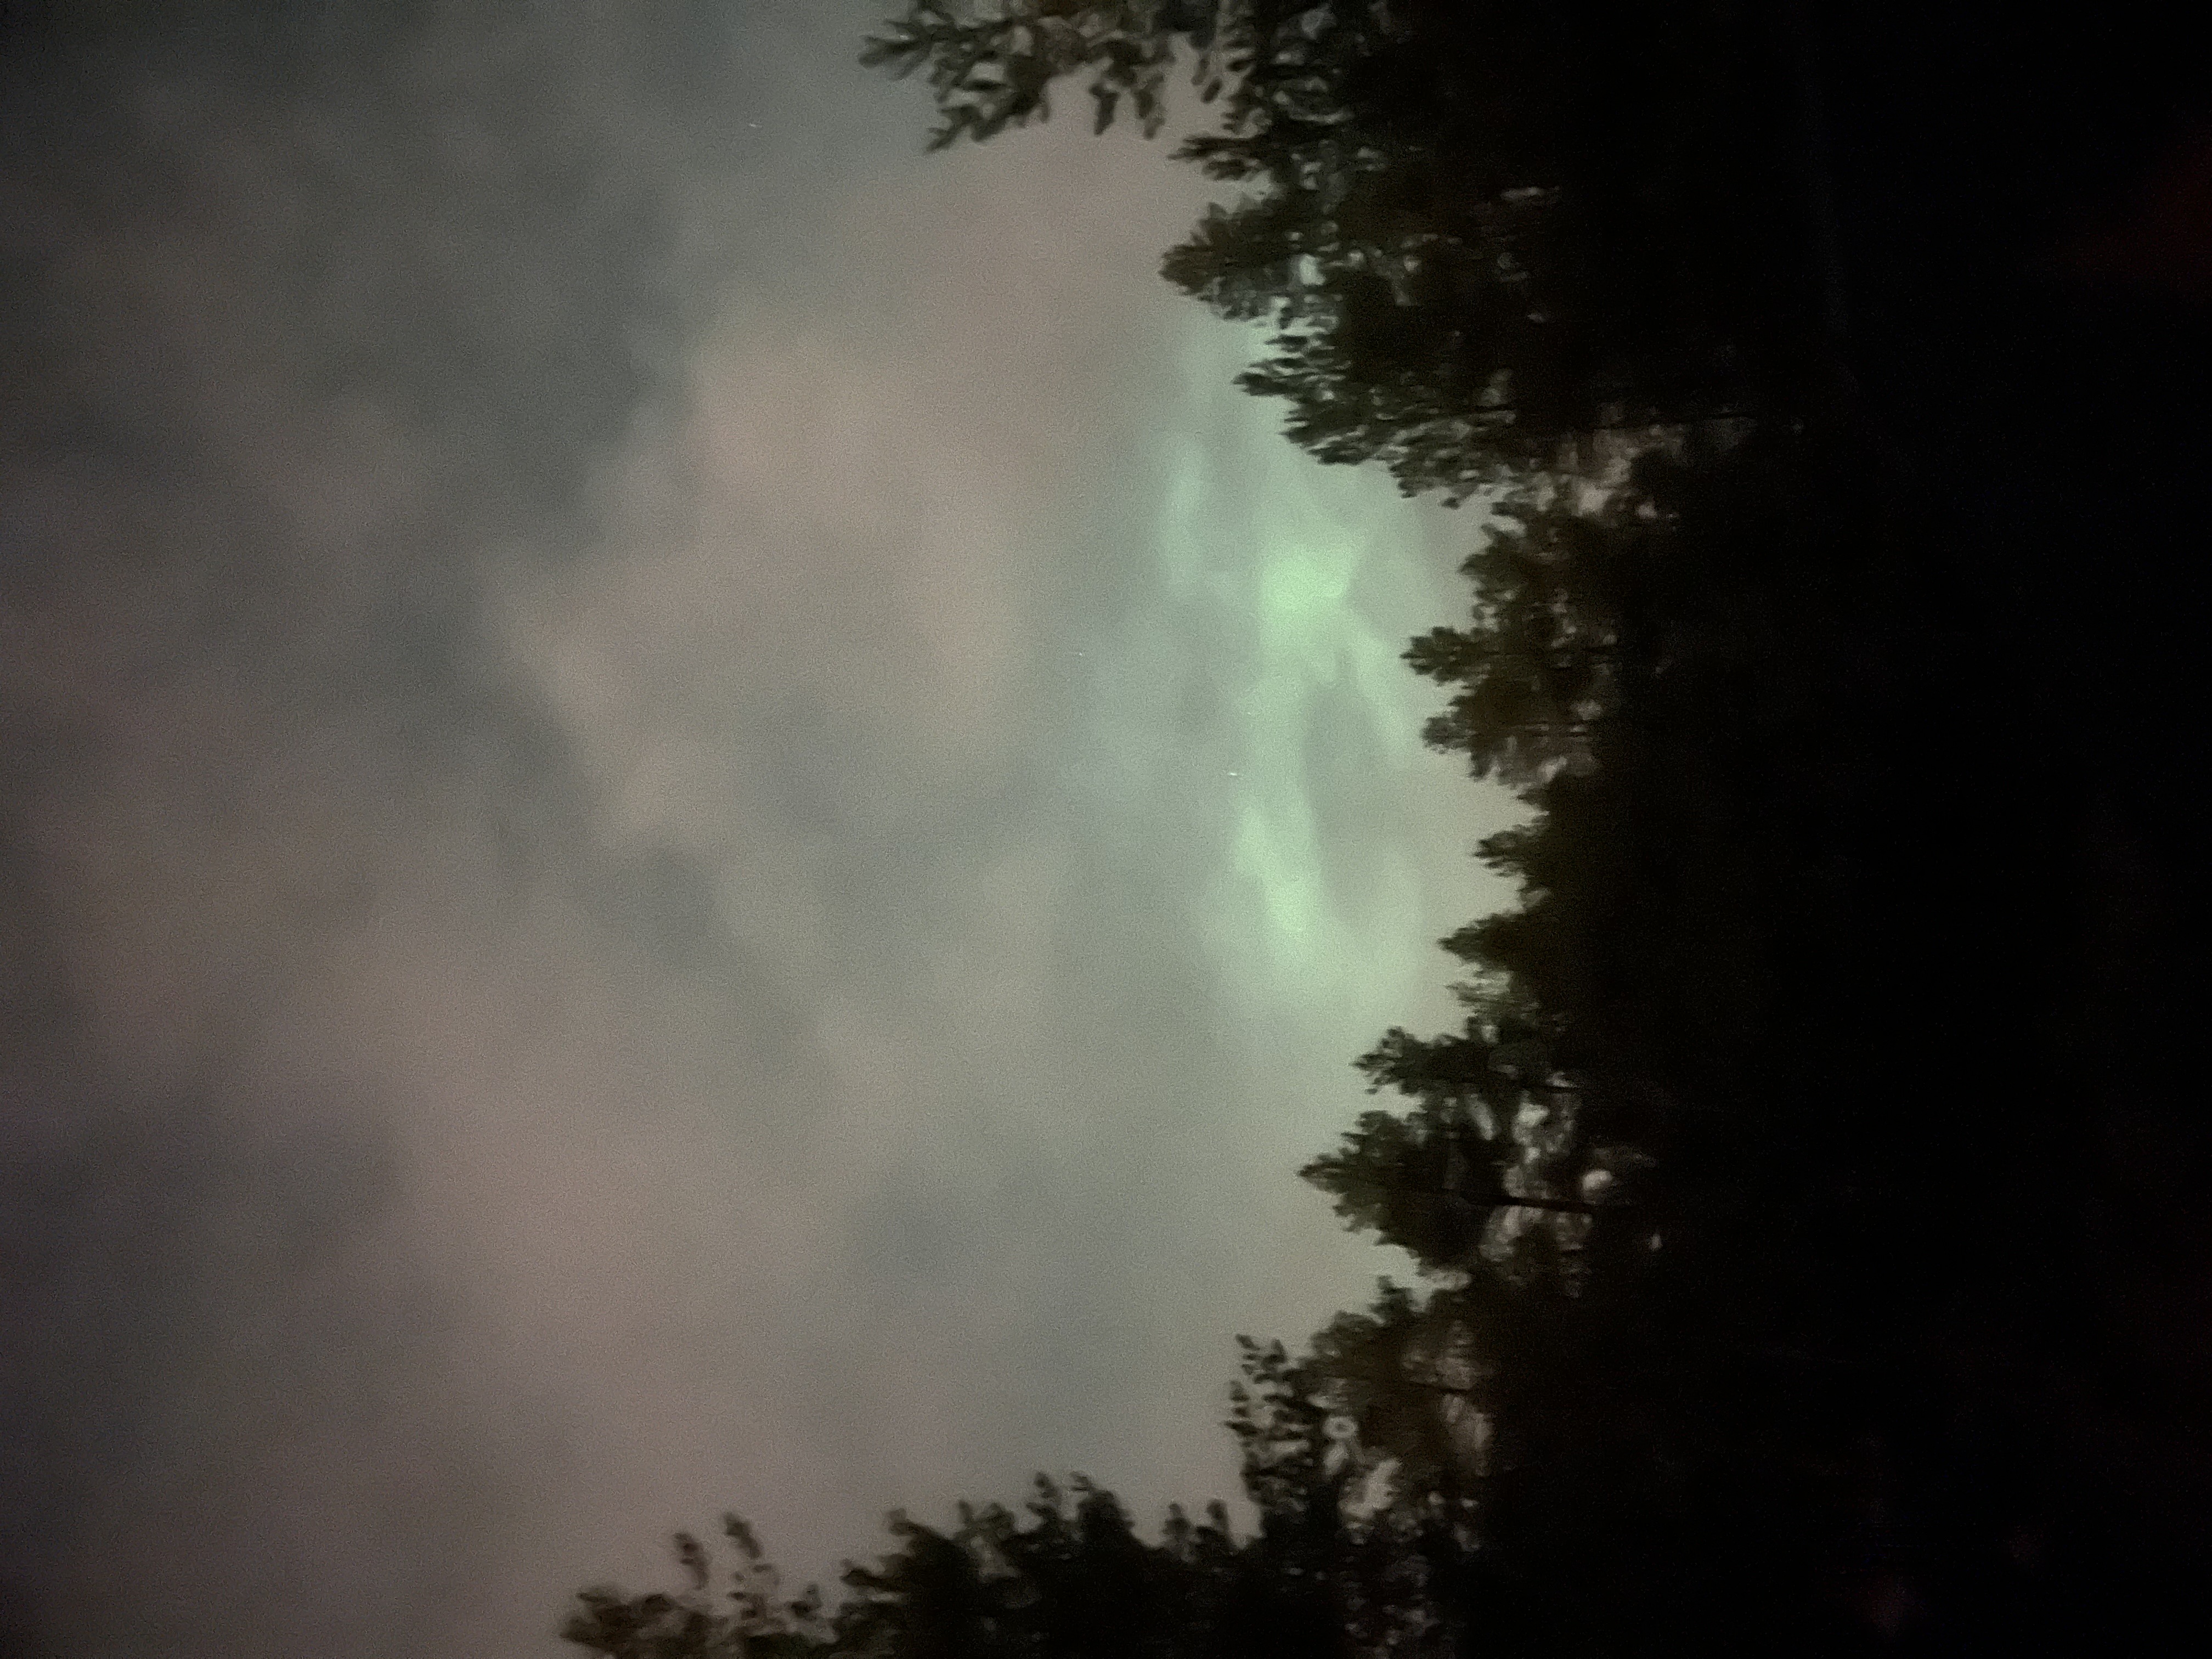
Aurora between clouds in the Umeå area.
The local organisation of the 21th European Space Weather Week was jointly done by Umeå University, the Belgian Space Weather Centre (STCE) and the Swedish Institute of Space Physics (IRF).
Review of space weather
Solar Active Regions (ARs) and flares
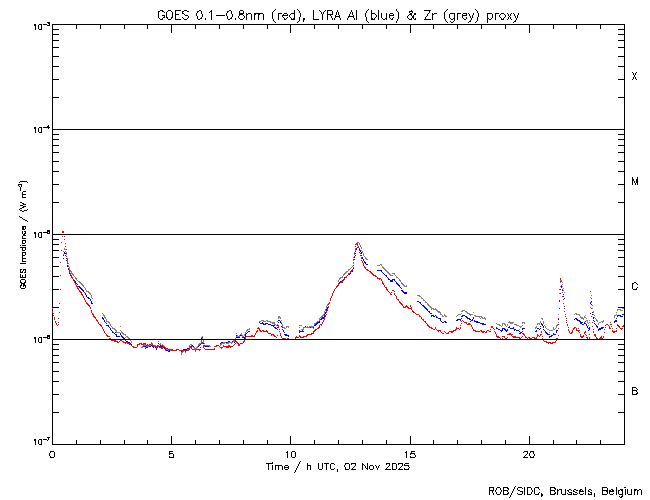
Numerous sunspot groups were present this week: fourteen in total, with SIDC Sunspot group numbers between 607 and 684. We observed 13 C-class flares and 1 M-class flares. The largest flare was an M1.0 flare (SIDC Flare 5889), peaking on November 02 at 00:26 UTC, originating from a sunspot group rotating into view over the east limb.
Coronal mass ejections
There were several back sided wide and partial halo CMEs. Two CME's leaving from the frontside and with a possible Earth directed component were seen. The first one on 28 October at 15:21 UT (SIDC CME 589), erupted towards the east, with an angular width of around 70 degrees and speed around 400 km/s. A dimming associated to this CME at 50 degrees eastern longitude, close to the equator was detected. The second possible Earth-directed CME (SIDC CME 590) was related to the eruption of a long filament, centred around N20E30 that resulted in a CME observed around 10:00 UT on 30 October, with speed around 350 km/s and directed mostly towards the NE; but with a component close to the ecliptic.
Coronal Holes
Three coronal holes with positive polarity were seen in the solar corona. Two in the southern hemisphere (SIDC CH 123 and 128), and one in the north (SIDC CH 129). One coronal hole (SIDC CH 116) with negative polarity was observed at the equator.
Proton flux levels
The greater than 10 MeV proton flux remained below the 10 pfu threshold throughout the week.
Electron fluxes at GEO
The greater than 2 MeV electron flux measured by GOES 18-19 were below the threshold until 31 October, when it went above it and remained elevated the rest of the week (due to a fast solar wind stream). The electron fluence changed on 1 November from normal to moderate.
Solar wind at Lagrange 1
At the beginning of the week the solar wind at L1 was slow with speeds around 400 km/s and an interplanetary magnetic field around 5 nT. On 27 October, a glancing blow from the CME of 23 October (SIDC CME 586) was observed, with the interplanetary magnetic field increasing to 11 nT. After that a fast solar wind stream originating in SIDC CH 123 passed at L1. Later, the solar wind measurements in L1 showed the combination of SIDC CH 123, 128 and 129. The solar wind speed reached peaks of 790 km/s on 31 October and remained elevated until the end of the week. The interplanetary magnetic field reached 15 nT with Bz going down to -13 nT, on 30 October.
Geomagnetism
The week started quiet to unsettled, both locally and globally (Kp and K_Bel up to 2). With the arrival of the ICME on 27 October, NOAA Kp went up to 3 and K_Bel up to 4. Later on, with the arrival of the coronal hole high speed stream, K_Bel reached 5 and Kp 5.33 on 30 October. The rest of the week was unsettled to active.
International Sunspot Number by SILSO

The daily Estimated International Sunspot Number (EISN, red curve with shaded error) derived by a simplified method from real-time data from the worldwide SILSO network. It extends the official Sunspot Number from the full processing of the preceding month (green line), a few days more than one solar rotation. The horizontal blue line shows the current monthly average. The yellow dots give the number of stations that provided valid data. Valid data are used to calculate the EISN. The triangle gives the number of stations providing data. When a triangle and a yellow dot coincide, it means that all the data is used to calculate the EISN of that day.
Noticeable Solar Events
| DAY | BEGIN | MAX | END | LOC | XRAY | OP | 10CM | TYPE | Cat | NOAA |
| 02 | 0013 | 0026 | 0037 | M1.0 |
| LOC: approximate heliographic location | TYPE: radio burst type |
| XRAY: X-ray flare class | Cat: Catania sunspot group number |
| OP: optical flare class | NOAA: NOAA active region number |
| 10CM: peak 10 cm radio flux |
PROBA2 Observations (27 Oct 2025 - 2 Nov 2025)
Solar Activity
Solar flare activity fluctuated from low to moderate during the week.
In order to view the activity of this week in more detail, we suggest to go to the following website from which all the daily (normal and difference) movies can be accessed: https://proba2.oma.be/ssa
This page also lists the recorded flaring events.
A weekly overview movie (SWAP week 814) can be found here: https://proba2.sidc.be/swap/data/mpg/movies/weekly_movies/weekly_movie_2025_10_27.mp4.
Details about some of this week's events can be found further below.
If any of the linked movies are unavailable they can be found in the P2SC movie repository here: https://proba2.oma.be/swap/data/mpg/movies/.
Sunday November 02
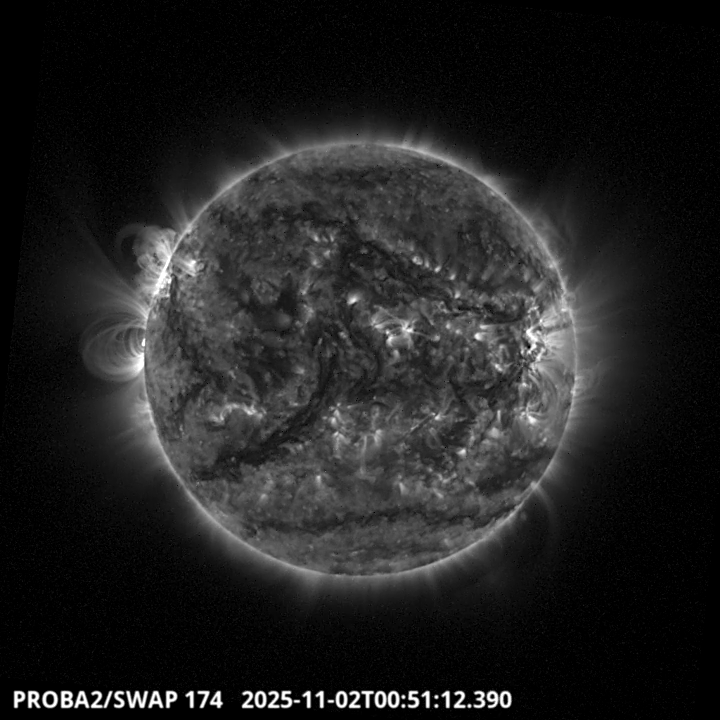
The largest and only M-flare of this week was an M1.0, and it was observed by LYRA (top panel) and SWAP (bottom panel). The flare peaked on 2025-Nov-02 at 00:26 UT and occurred just behind the eastern limb of the Sun, hence it was seen in SWAP a bit later than the peak time, under the large loop system near the equator.
Find a SWAP movie of the event here: https://proba2.sidc.be/swap/movies/20251102_swap_movie.mp4.
Geomagnetic Observations in Belgium

Local K-type magnetic activity index for Belgium based on data from Dourbes (DOU) and Manhay (MAB). Comparing the data from both measurement stations allows to reliably remove outliers from the magnetic data. At the same time the operational service availability is improved: whenever data from one observatory is not available, the single-station index obtained from the other can be used as a fallback system.
Both the two-station index and the single station indices are available here: http://ionosphere.meteo.be/geomagnetism/K_BEL/
The SIDC Space Weather Briefing
The forecaster on duty presented the SIDC briefing that gives an overview of space weather from 27 October to 2 November.
The pdf of the presentation can be found here: https://www.stce.be/briefings/20251103_SWbriefing.pdf
Review of Ionospheric Activity


VTEC time series at 3 locations in Europe from 27 Oct 2025 till 2 Nov 2025
The top figure shows the time evolution of the Vertical Total Electron Content (VTEC) (in red) during the last week at three locations:
a) in the northern part of Europe(N 61deg E 5deg)
b) above Brussels(N 50.5deg, E 4.5 deg)
c) in the southern part of Europe(N 36 deg, E 5deg)
This top figure also shows (in grey) the normal ionospheric behaviour expected based on the median VTEC from the 15 previous days.
The time series below shows the VTEC difference (in green) and relative difference (in blue) with respect to the median of the last 15 days in the North, Mid (above Brussels) and South of Europe. It thus illustrates the VTEC deviation from normal quiet behaviour.
The VTEC is expressed in TECu (with TECu=10^16 electrons per square meter) and is directly related to the signal propagation delay due to the ionosphere (in figure: delay on GPS L1 frequency).
The Sun's radiation ionizes the Earth's upper atmosphere, the ionosphere, located from about 60km to 1000km above the Earth's surface.The ionization process in the ionosphere produces ions and free electrons. These electrons perturb the propagation of the GNSS (Global Navigation Satellite System) signals by inducing a so-called ionospheric delay.
See http://stce.be/newsletter/GNSS_final.pdf for some more explanations; for more information, see https://gnss.be/SpaceWeather
STCE training courses and seminars
Courses, seminars, presentations and events with the Sun-Space-Earth system and Space Weather as the main theme. We provide occasions to get submerged in our world through educational, informative and instructive activities.
* Nov 17-19, STCE Space Weather Introductory Course, Brussels, Belgium - register: https://events.spacepole.be/event/217/ - Full
* Nov 18, STCE seminar: Real time detection and characterisation of solar flares from ground-based VLF data, Space Pole, Brussels, Belgium
* Feb 9-11, 2026, STCE Space Weather Introductory Course, Brussels, Belgium - register: https://events.spacepole.be/event/255/
* Mar 16-18, 2026, STCE course: Role of the ionosphere and space weather in military communications, Brussels, Belgium - register: https://events.spacepole.be/event/258/
* Apr 20-21, 2026, STCE cursus: inleiding tot het ruimteweer, Brussels, Belgium - register: https://events.spacepole.be/event/260/
* Mar 23, 2026, STCE lecture: From physics to forecasting, Space Weather course, ESA Academy, Redu, Belgium
* Jun 15-17, 2026, STCE Space Weather Introductory Course, Brussels, Belgium - register: https://events.spacepole.be/event/256/
* Oct 12-14, 2026, STCE Space Weather Introductory Course, Brussels, Belgium - register: https://events.spacepole.be/event/257/
* Nov 23-25, 2026, STCE course: Role of the ionosphere and space weather in military communications, Brussels, Belgium - register: https://events.spacepole.be/event/259/
* Dec 7-9, 2026, STCE Space Weather Introductory Course for Aviation, Brussels, Belgium - register: https://events.spacepole.be/event/262/
To register for a course and check the seminar details, navigate to the STCE Space Weather Education Center: https://www.stce.be/SWEC
If you want your event in the STCE newsletter, contact us: stce_coordination at stce.be
Website: https://www.stce.be/SWEC