- Table of Content
- 1.Proba-3 is 1 y...
- 2.Gargantuan
- 3.SOHO's 30th an...
- 4.Review of spac...
- 5.PROBA2 Observa...
- 6.International ...
- 7.Noticeable Sol...
- 8.Geomagnetic Ob...
- 9.The SIDC Space...
- 10.Review of Iono...
- 11.STCE training ...
2. Gargantuan
3. SOHO's 30th anniversary
4. Review of space weather
5. PROBA2 Observations
6. International Sunspot Number by SILSO
7. Noticeable Solar Events
8. Geomagnetic Observations in Belgium
9. The SIDC Space Weather Briefing
10. Review of Ionospheric Activity
11. STCE training courses and lectures
Proba-3 is 1 year in space!
December 5, 2024 - exactly 1 year ago, the duo satellite Proba-3 left Earth to head to space. The telescope ASPIICS, whose task is to make perfect total solar eclipses from space, was onboard. The launch went flawless.
December 5, 2025 - exactly 1 year later, ASPIICS has already delivered a wealth of amazing pictures of the solar atmosphere close to its surface, a treasure box for solar scientists.
A peek in the treasure box
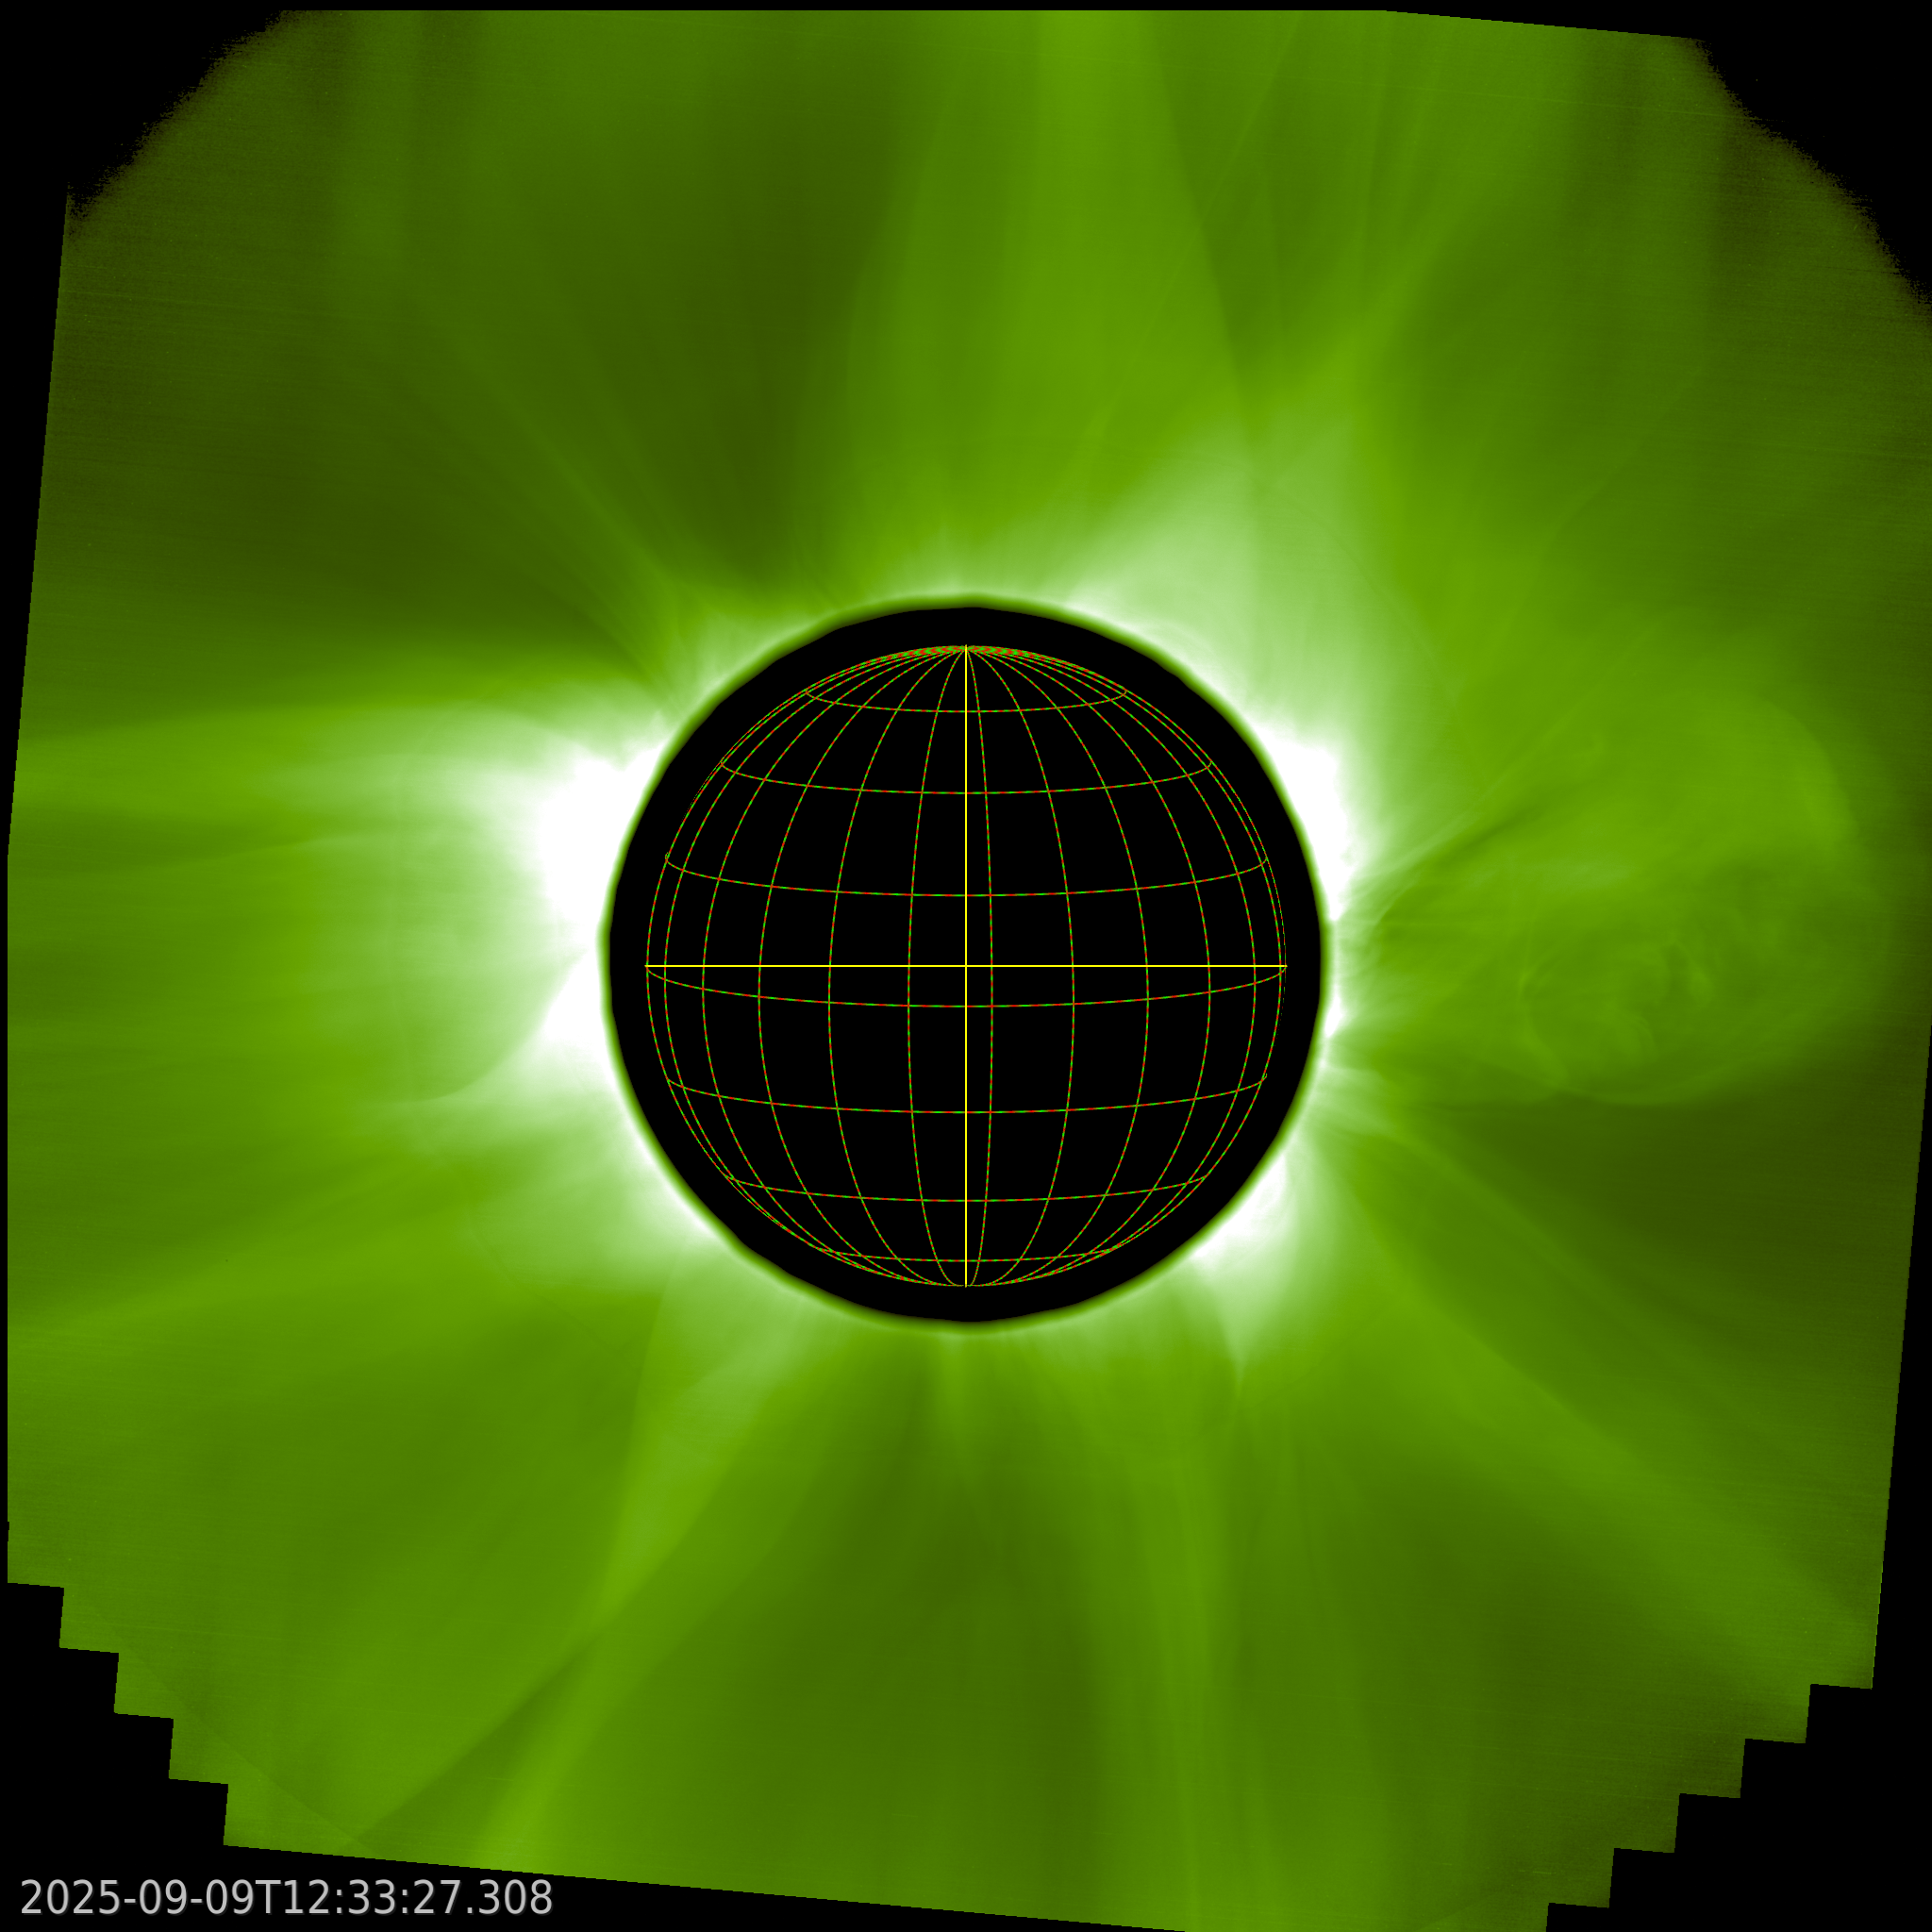
This is a white-light image of the solar corona taken by ASPIICS on September 9, 2025. The corona has a shape typical for a maximum solar activity cycle, with streamers visible all around the solar limb. A Coronal Mass Ejection is seen propagating towards the west (right in the image).
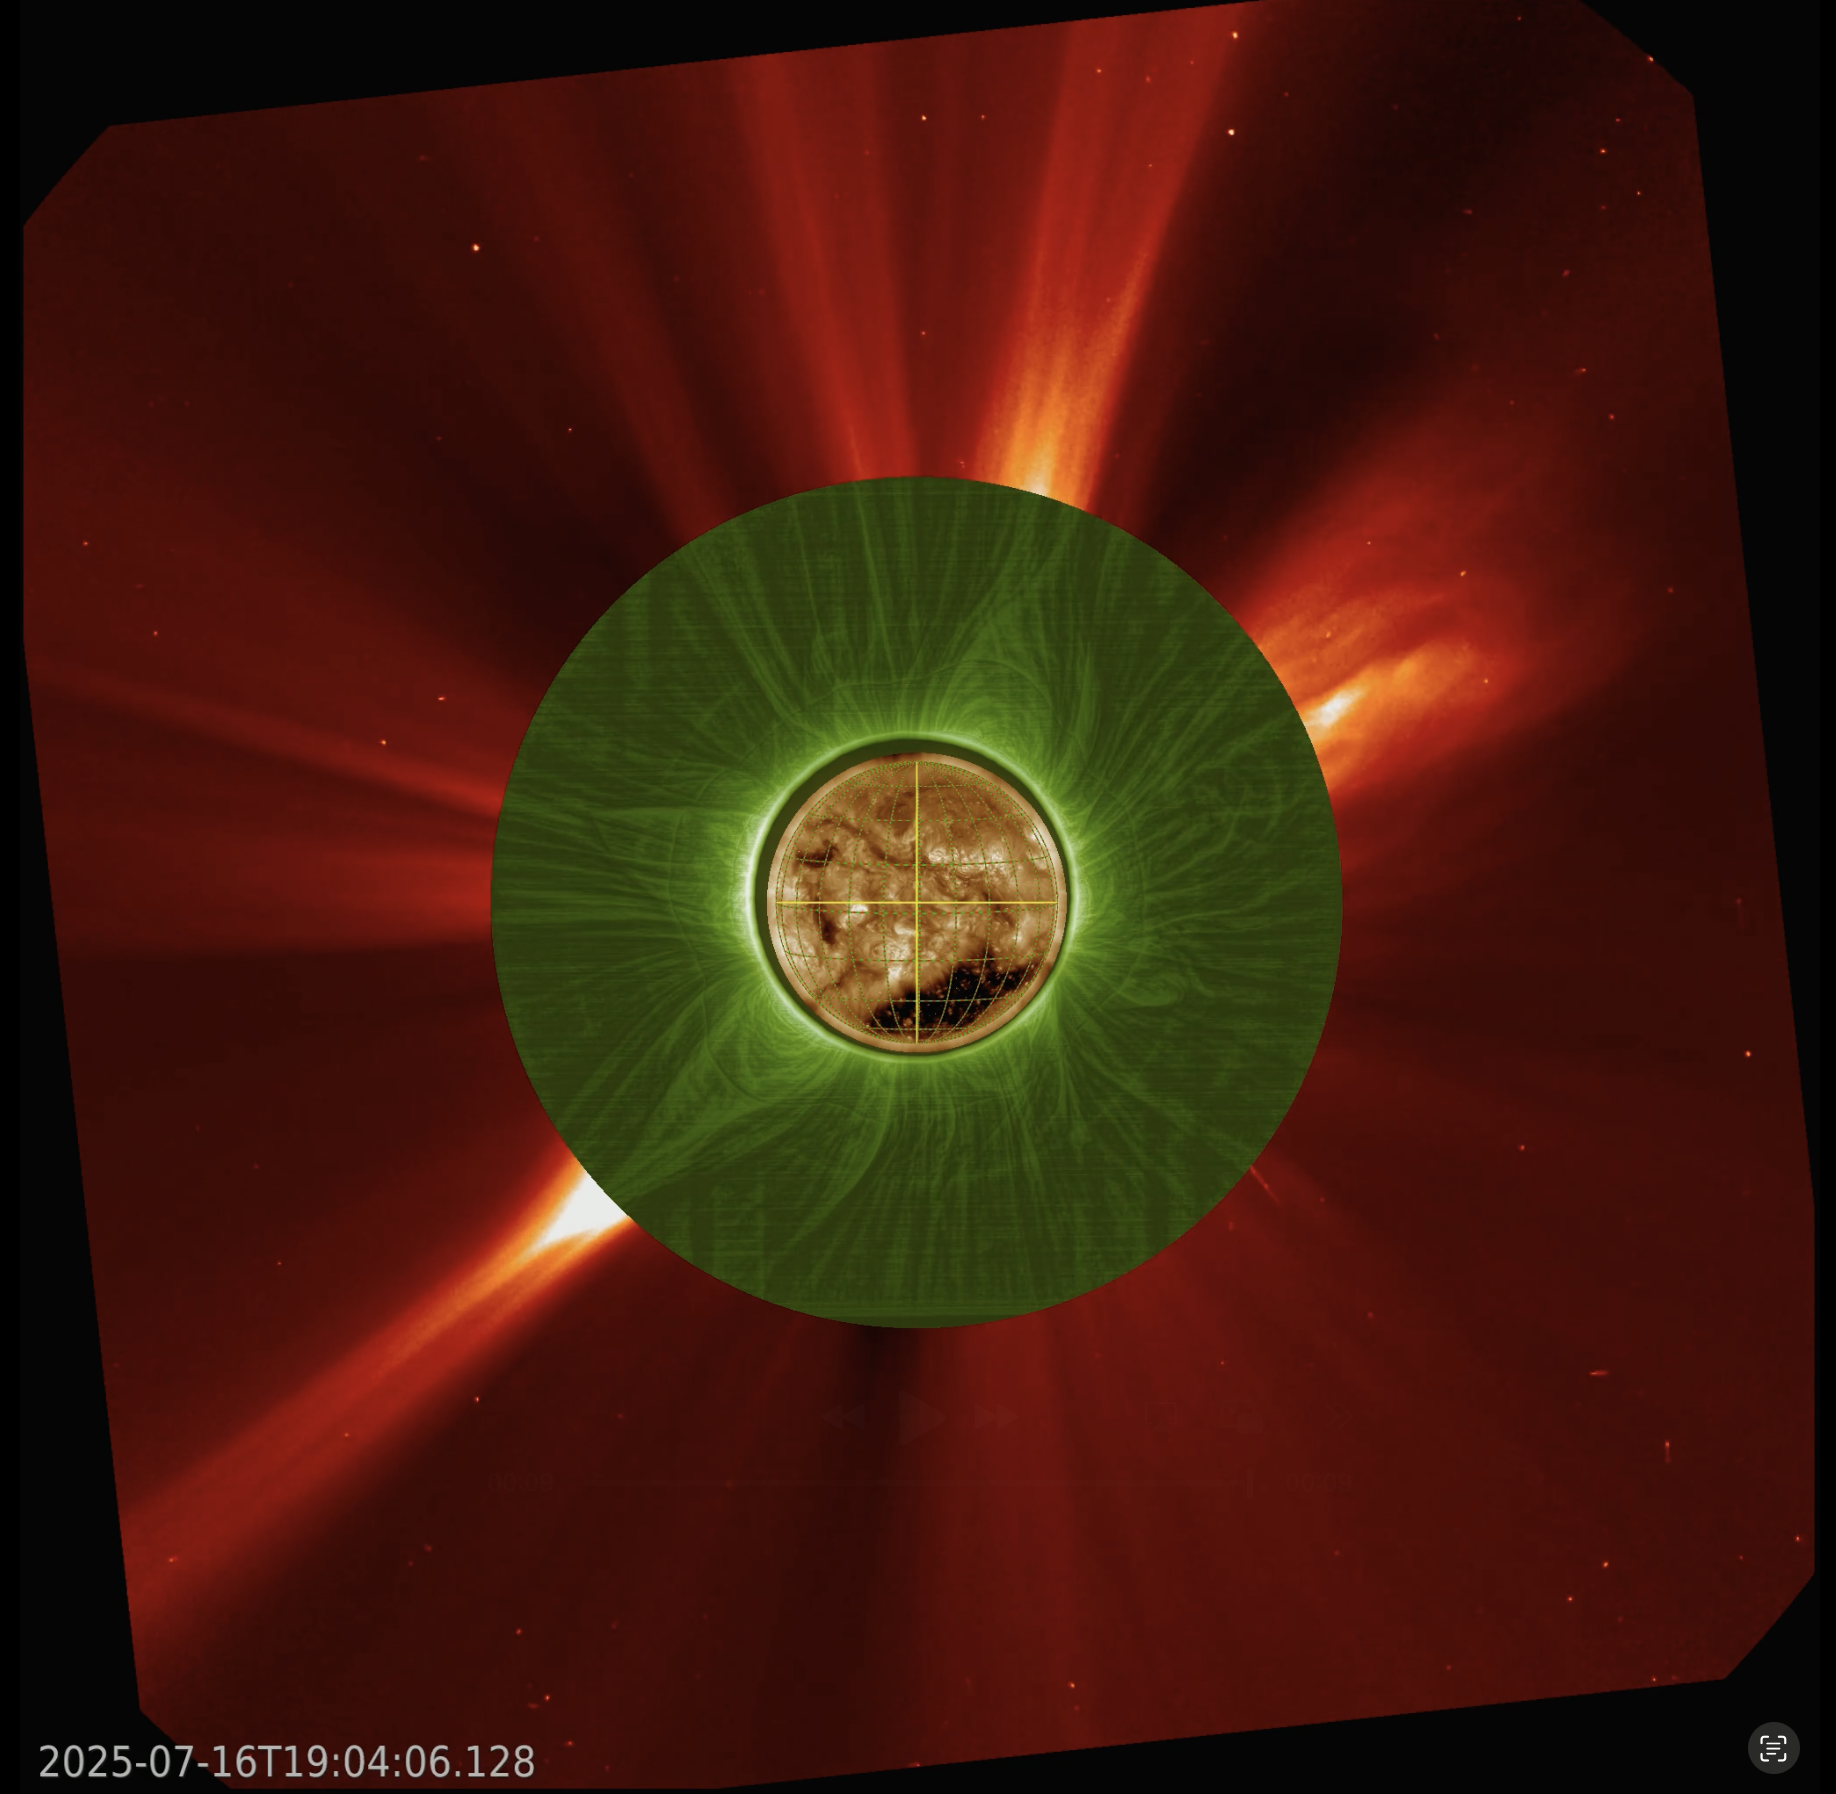
This is the Sun and the solar atmosphere on July 16, 2025. The green images are more detailed compared to the red images. A Coronal Mass Ejection is seen propagating towards the west (right in the image). The middle EUV image is taken by SDO/AIA. The green white-light image is taken by ASPIICS, the red white-light image is from SOHO/LASCO. All images show the Sun and the solar atmosphere on July 16, 2025.
The movie: https://stce.be/movies/JHV_2025-10-01_23.40.02.mp4
Reactions from a few people of the Belgian ASPIICS team
Laurent Dolla, Science Planner - one can never get bored.
ASPIICS is really a cutting-edge instrument, for which I plan the observations. Our images are clean and of exceptional good quality. It was a surprise that the instrument achieves this even with normal exposure times. We can now see features that were never seen before because they clearly stand out from the background. For us, solar scientists, this is very exciting. When I wake up in the middle of the night, it is not uncommon that I start working. With ASPIICS, one can never get bored.
Andrei Zhukov, Principal Investigator - being on the forefront of solar physics.
I joined the Proba-3 team already in 2009. Now, after launch and commissioning, I can finally do what I love to do: science. We make total solar eclipses, almost as on an assembly line, which feels for me as being a kid on a science playground toying with unprecedented images. In June 2025, I witnessed the first huge prominence eruption with ASPIICS. We could already see it in our images before they were even cleaned! I'm looking forward to presenting the science results at the annual meeting of the American Geophysical Union in December 2025.
Zoe Zontou, Instrument Operator - this is the coolest job ever
It is so cool that we make total solar eclipses from space and I'm an operator of this instrument! I come from a totally different background than solar physics, so I was thrilled when I joined the team in May 2025. The day that we showed the first official science image to the public was really exciting. I already learned so many things about the solar atmosphere. ASPIICS showed me that I will never stop asking questions and never stop learning. I love it and look forward to meeting even more interesting people and discovering more on solar physics and our Sun!
Andreas, Instrument Operator - bitten by the heliophysics bug
I plan and write commands for the telescope, but I also do surveillance of the newly arrived data. This means that I'm one of the first taking a glimpse at the images! I'm really on the front line to see things which were never seen before. The commanding of ASPIICS can in theory be done a bit beforehand, but in the early phases of the mission I was sometimes at the Mission Operations Center in Redu where I had to take immediate action and call to remote ground stations. Together we had to command the satellites and ASPIICS in real-time. Since my PhD, I have had big dreams. Now, it is amazing to be part of this passionate researchers community and figure out important open questions on the Sun.
Gargantuan
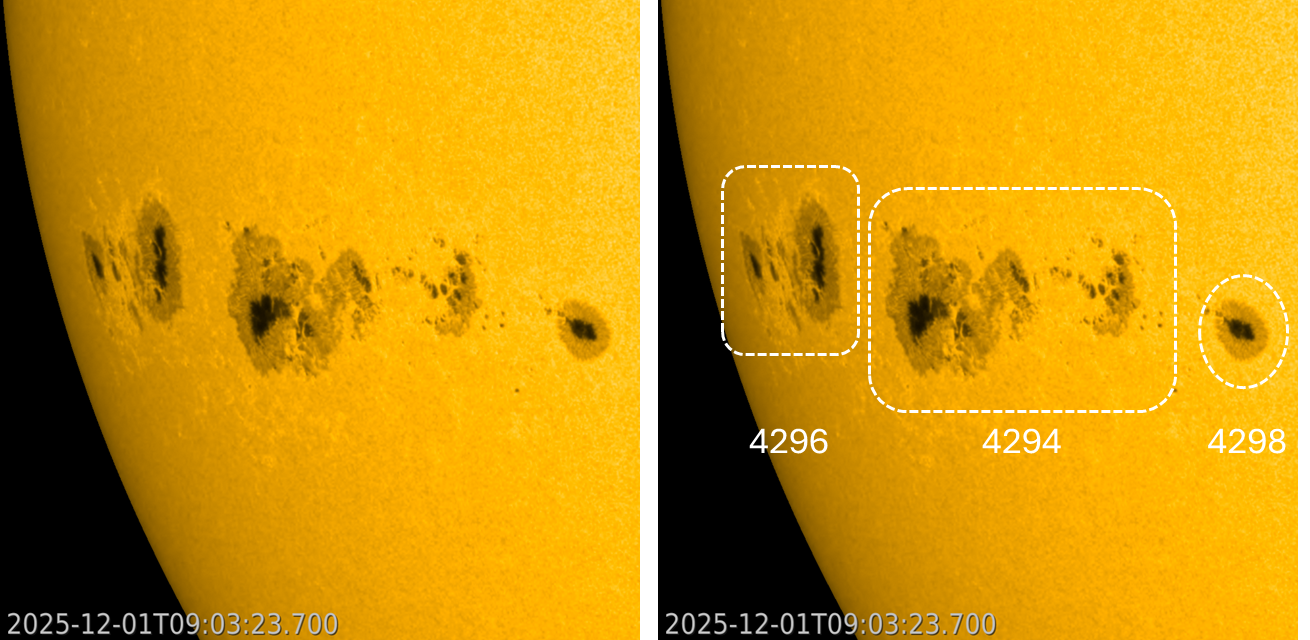
Starting on 28 November, a huge sunspot complex started to transit the southeast solar limb. As it looks right now, it consists of 3 active regions: NOAA 4298, 4294 and 4296, as shown in the annotated SDO/HMI white light image underneath. NOAA 4294 is the largest of the trio, and one of the larger ones of the ongoing solar cycle. It has a sunspot area at least 10 times the total surface area of the Earth, and its length equals 14 Earth diameters. The region was the source of an M5.9 flare late on 28 November, and 5 low-level M-class events on 29 November. The region then became silent, most likely as the previously existing delta structures dissipated. Nonetheless, the region is so large that it still has the potential for a powerful M- or even X-class event.
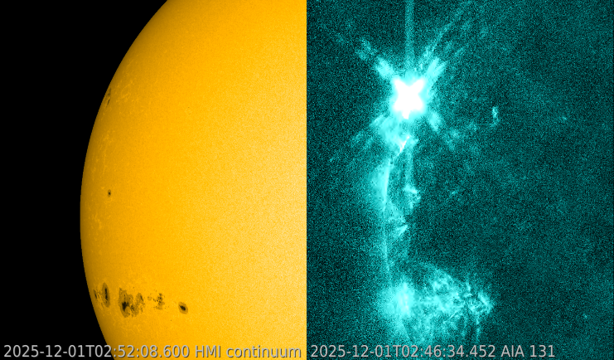
Then, early on 1 December, GOES registered an X-class event. The X1.9 flare peaked at 02:49 UTC and lasted for 38 minutes. Contrary to expectations, the source was not NOAA 4294, but a smaller yet also complex active region near the northeast limb, later numbered as NOAA 4299. The image underneath shows the region in the white light underneath left, whereas the flare can be seen in the extreme ultraviolet (EUV) image (SDO/AIA 131) underneath right. The blooming and diffraction patterns that can be seen in this image are instrumental (more information is in Note 1 of this STCE newsitem at https://www.stce.be/news/499/welcome.html).
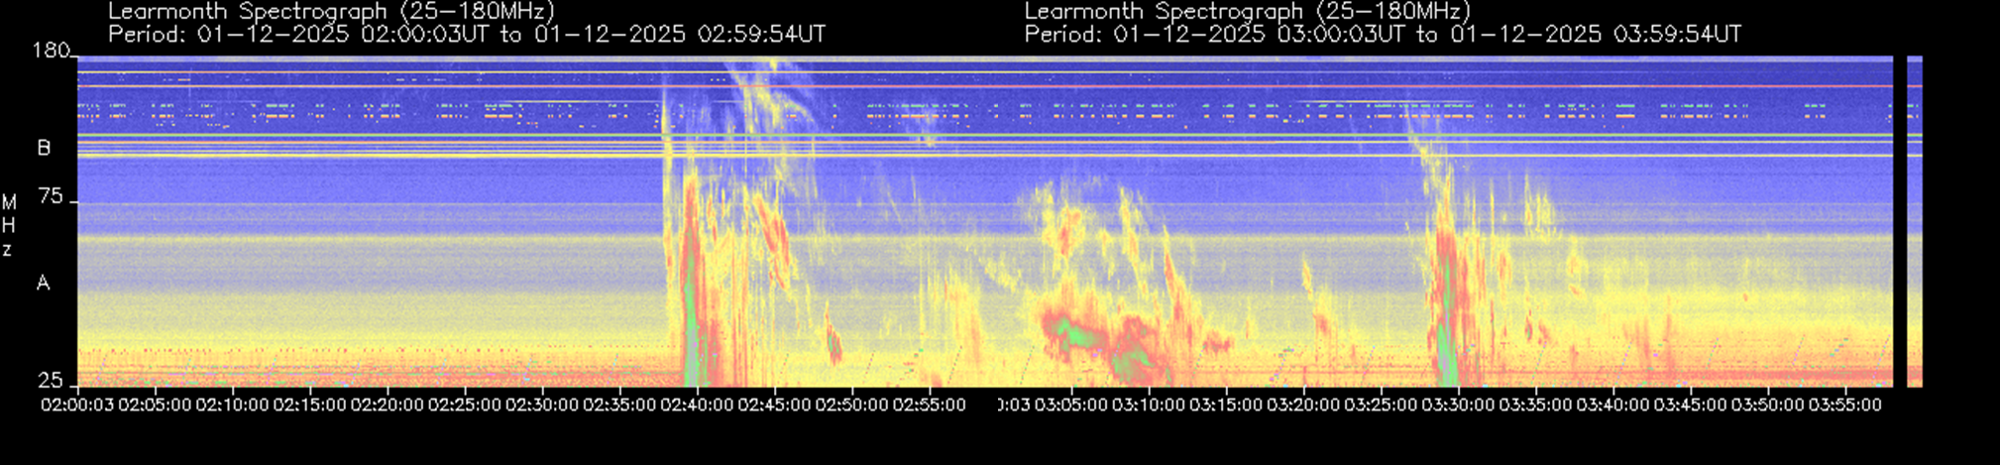
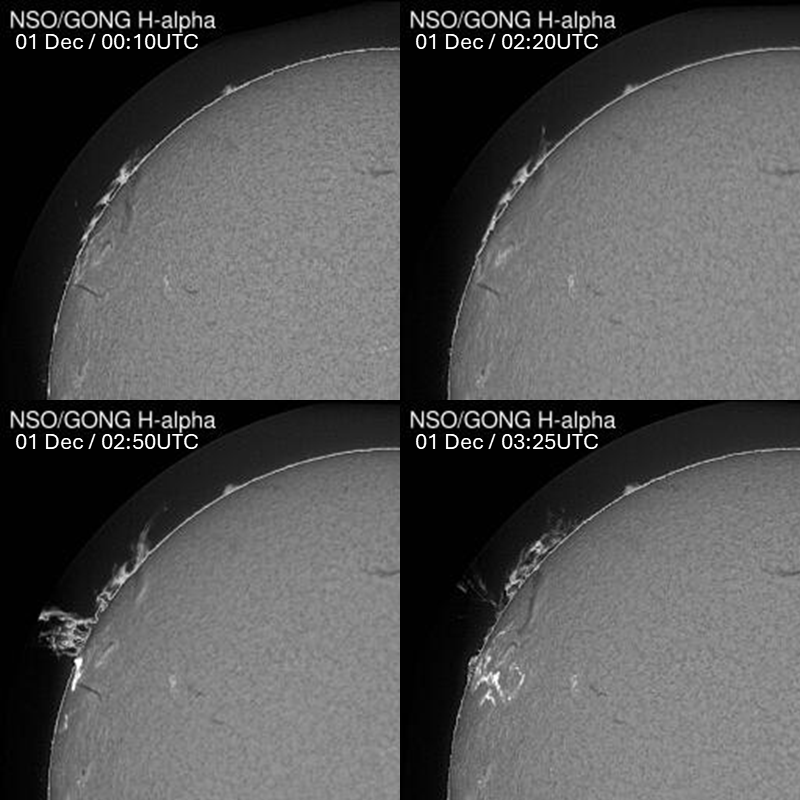
The greater than 10 MeV proton event is currently still at background levels (GOES). Radio bursts were recorded over the entire radio band, and were most intense in the VHF (30-300 MHz) and SHF (3-30 GHz) bands (NOAA/USAF). GNSS (Global Navigation satellite Systems, such as GPS and Galileo) frequencies (1200-1500 MHz) and their applications seemed to be little to not affected. The radio astronomy station in Learmonth (Australia - https://www.sws.bom.gov.au/Solar/3/2) recorded Type II and Type III radio bursts (see the STCE SWx Classification page https://www.stce.be/educational/classification#radio) between 02:35 and 03:15UTC, as shown in the radio spectrogram underneath with the horizontal axis representing time and the vertical axis representing frequency (highest frequencies on top). The Type II and III radio bursts recorded around 03:30 UTC seem to have been associated with the violent eruption of a nearby filament, as shown in the GONG images underneath.
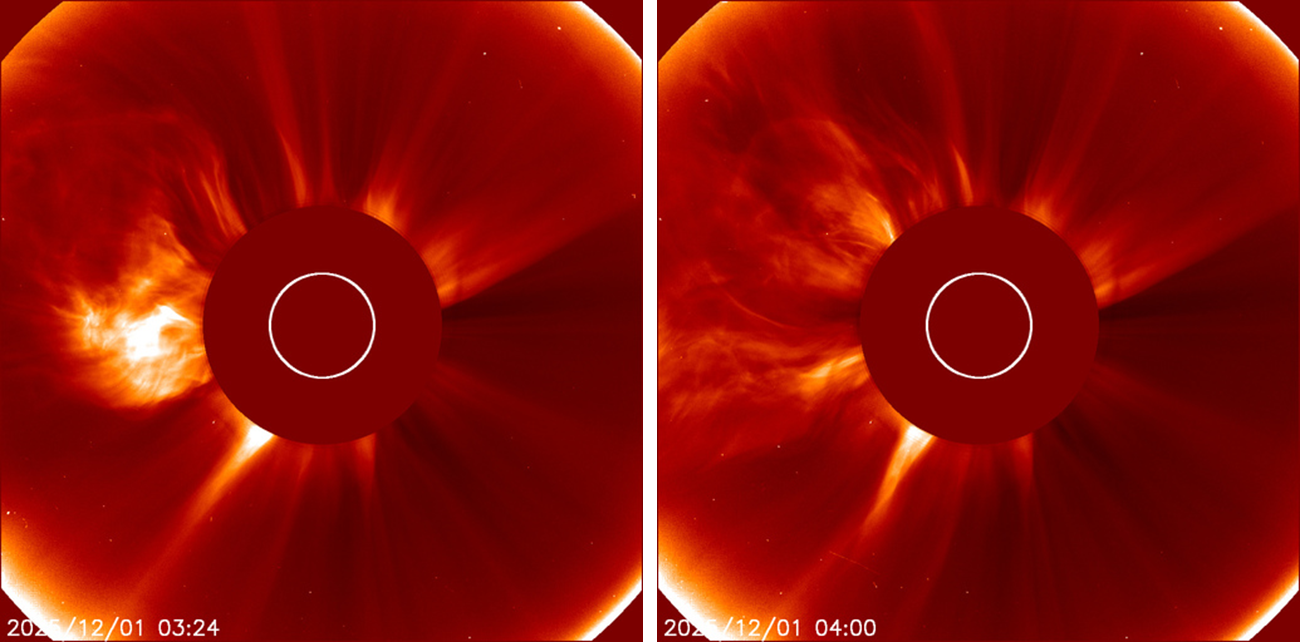
The apparent presence of 2 Type II radio bursts seems to indicate that two coronal mass ejections (CMEs) may have been associated with this flare. Sure enough, coronagraphic imagery from SOHO/LASCO C2 show the strongest CME, i.e. the one related to the X-class flare, starting around 02:48 UTC and directed mainly to the east, as well as a second but weaker CME starting around 03:36 UTC and somewhat more directed to the northeast. The PRESTO alert by the SIDC SWx forecaster (https://www.sidc.be/index.php ) mentioned that "An associated fast partial halo coronal mass ejection (CME) was detected in the LASCO/C2 coronagraph imagery starting at around 03 UTC with an estimated projected velocity of 850 km/s. The CME is directed off the Sun-Earth line and is not expected to have a notable impact on Earth." The second CME is even smaller and is also not expected to have an earth-directed component.
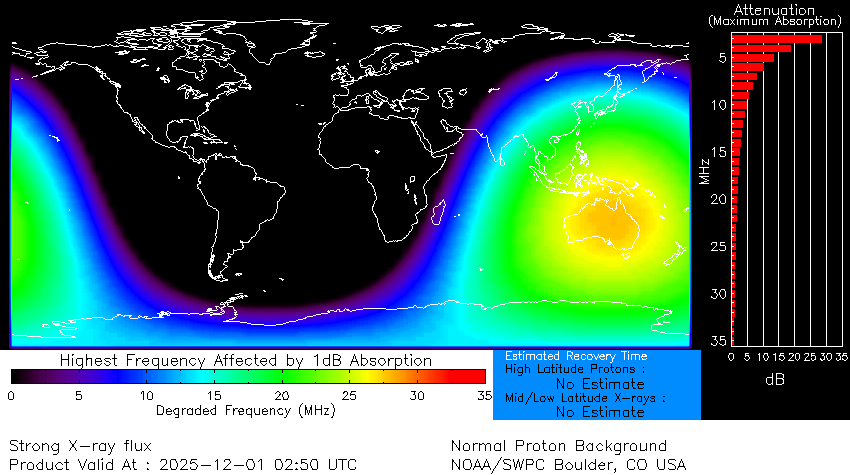
The X-class flare itself affected the lower frequency portion of the High Frequency communication band (HF Com ; 3 - 30 MHz) on the dayside of the Earth, mainly over the Australia, New-Zealand, Southeast Asia, and the bordering portions of the Indian and Pacific Ocean. An advisory to civil aviation has been issued (PECASUS - https://pecasus.eu/). The effects of the X1 flare on HF Com can be seen in the D-RAP (NOAA/SWPC - https://www.swpc.noaa.gov/products/d-region-absorption-predictions-d-rap ) map underneath. Further strong flare activity can be expected over the coming days, and as the source regions will gradually move further onto the solar disk, any associated CMEs may gradually become earth-directed.
SOHO's 30th anniversary
On 2 December 2025, the Solar and Heliospheric Observatory (SOHO - https://soho.nascom.nasa.gov/) celebrated its 30th birthday. Since its launch in 1995, this versatile spacecraft has become an icon in solar and heliospheric research, and has provided space weather forecasters a solid base to build on.
SOHO, a combined ESA/NASA project, revolutionized space weather monitoring by providing imagery of the Sun in white light, 4 wavelengths in extreme ultraviolet, and magnetograms at a cadence of several images per hour. Its coronagraphs provided a view of the immediate surroundings of the Sun, allowing a good view on the dreaded coronal mass ejections. More importantly, these images were available in near real-time, something unseen up to that time.
SOHO instruments have contributed to several other research domains, such as the solar wind (parameters, origin) or the solar interior (oscillations). The spacecraft is also the best comet chaser in history, having made its 5000th (FIVE thousand!) comet discovery in 2024.
SOHO had a near-death experience in 1998 after a loss of control on 24 June. Fortunately, ground controllers heroically regained contact with and control of the spacecraft over the next few months. It's the single period in SOHO's operational life without imagery, and it became known as "SOHO's holiday". Eventually, this workhorse of the solar scientists and space weather specialists would become superseded by the Solar Dynamics Observatory in 2010, which had a much higher resolution and image cadence. However, the telemetry gained by stopping SOHO's solar disk imagery was used to boost the cadence of the coronagraphic images to one image every 12 minutes, for both coronagraphs. That is why, up to this day, SOHO remains the main spacecraft delivering the so critical coronagraphic imagery.
More information can be found on the SOHO website (https://soho.nascom.nasa.gov/pickoftheweek/ ), linking to specific ESA and NASA bulletins.
Many congratulations to the SOHO team and all who contributed to this ongoing and incredibly successful solar mission!
Review of space weather
Solar Active Regions (ARs) and flares
The solar flaring activity level was moderate on 28 Nov and high on 29 Nov.
SIDC Sunspot Group (SG) 709 (NOAA Active Region [AR] 4294) produced two M-class flares on 28 Nov and four on 29 Nov, while NOAA AR 4299 produced one M-class flare on 29 Nov. The brightest flare of the past week was SIDC flare 6228, an M5.9 emitted by SIDC SG 709 on 28 Nov at 22:22 UTC. NOAA AR 4299's single flare was an M2.8 that peaked on 29 Nov at 16:07 UTC.
Coronal mass ejections
No Earth-directed Coronal Mass Ejections (CME) were observed in the past week.
Coronal Holes
SIDC Coronal Hole (CH) 139 (a mid-latitude coronal hole with positive polarity), a small CH crossed the central meridian in a single day, on 28 Nov.
Proton flux levels
The greater than 10 MeV GOES proton flux has been at background levels.
Electron fluxes at GEO
The greater than 2 MeV electron flux measured by GOES-19, exceeded the 1000 pfu threshold at noon on 25 Nov. It remained above the alert threshold for the rest of the week and reached a peak of 23000 pfu on 29 Nov at 16:40 UTC.
The 24-hour electron fluence increased from normal to moderate at the second half of 25 Nov and increased further to high levels at the second half of 29 Nov. It dropped back to moderate levels at the second half of 30 Nov.
Solar wind at L1
A High Speed Stream (HSS) arrived at the second half of 25 Nov. The solar wind (SW) increased to 830 km/s on 25 Nov and the effect lasted until the first half of 30 Nov (when the speed dropped to below 600 km/s). The interplanetary magnetic field (B) varied between 2 and 14 nT and its North-South component (Bz) fluctuated between -15 and 12 nT.
Geomagnetism
The global geomagnetic conditions reached minor storm levels during four three-hour intervals: NOAA Kp 5- on 25 Nov at 00:00-03:00 UTC, Kp 5 on 25 Nov at 06:00-09:00 UTC, Kp 5- on 27 Nov at 09:00-12:00 UTC, and Kp 5- on 27 Nov at 18:00-21:00 UTC. The rest of the week the global conditions varied between unsettled and active with short quiet intervals.
Locally, the geomagnetic conditions reached minor storm levels (K BEL 5) on 24 Nov at 12:00 - 15:00 UTC and on 26 Nov at 15:00 - 18:00 UTC. The rest of the week the local conditions followed a similar pattern to the global conditions, ie varied between unsettled and active with short quiet intervals.
PROBA2 Observations
Solar Activity
Solar flare activity fluctuated from low to moderate during the week.
In order to view the activity of this week in more detail, we suggest to go to the following website from which all the daily (normal and difference) movies can be accessed: https://proba2.oma.be/ssa
This page also lists the recorded flaring events.
A weekly overview movie (SWAP week 818) can be found here: https://proba2.sidc.be/swap/data/mpg/movies/weekly_movies/weekly_movie_2025_11_24.mp4.
Details about some of this week's events can be found further below.
If any of the linked movies are unavailable they can be found in the P2SC movie repository here: https://proba2.oma.be/swap/data/mpg/movies/.
Friday November 28
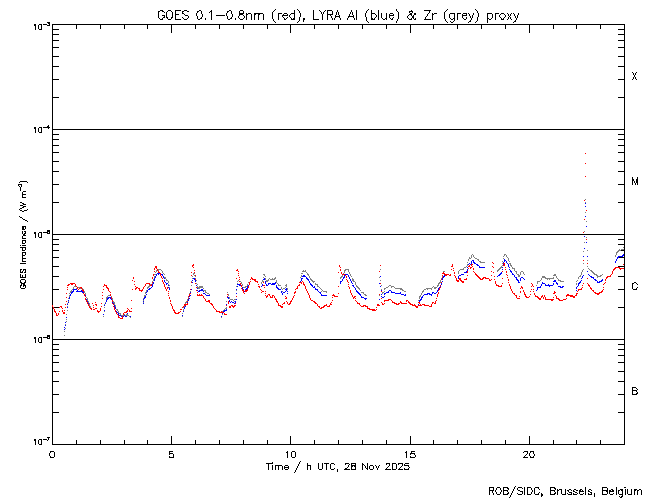
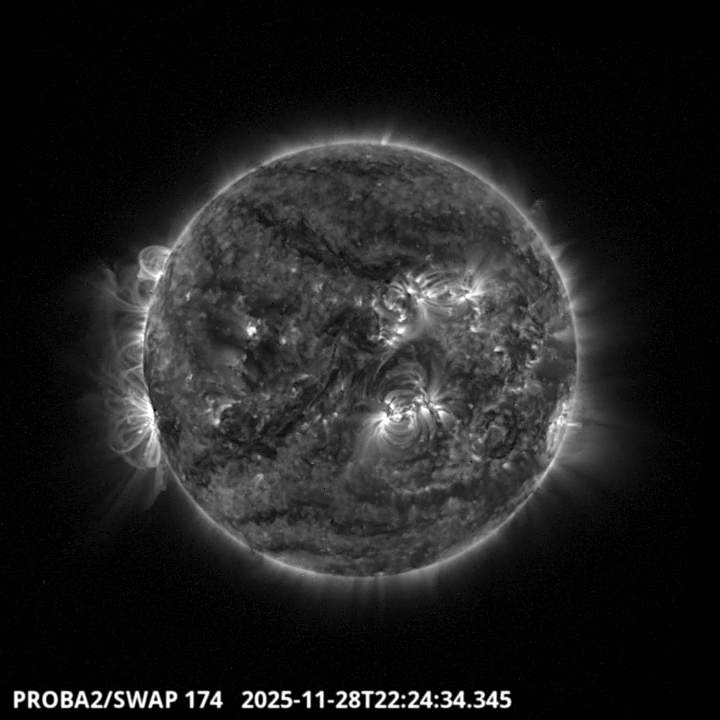
The largest flare of this week was an M5.9, and it was observed by LYRA (top panel) and SWAP (bottom panel). The flare peaked on 2025-Nov-28 at 22:22 UT and occurred close to the equator at the eastern limb of the Sun, originating from active region NOAA4294 (SIDC 709).
Find a SWAP movie of the event here: https://proba2.sidc.be/swap/movies/20251128_swap_movie.mp4.
International Sunspot Number by SILSO
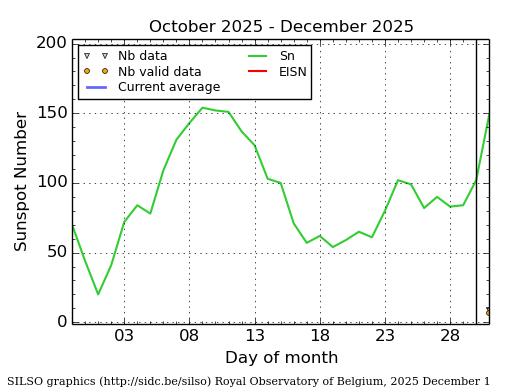
The daily Estimated International Sunspot Number (EISN, red curve with shaded error) derived by a simplified method from real-time data from the worldwide SILSO network. It extends the official Sunspot Number from the full processing of the preceding month (green line), a few days more than one solar rotation. The horizontal blue line shows the current monthly average. The yellow dots give the number of stations that provided valid data. Valid data are used to calculate the EISN. The triangle gives the number of stations providing data. When a triangle and a yellow dot coincide, it means that all the data is used to calculate the EISN of that day.
Noticeable Solar Events
| DAY | BEGIN | MAX | END | LOC | XRAY | OP | 10CM | TYPE | Cat | NOAA |
| 28 | 2211 | 2222 | 2224 | M5.9 | II/2 | 4294 | ||||
| 28 | 2352 | 0002 | 0007 | M1.6 | 4294 | |||||
| 29 | 0414 | 0420 | 0422 | M1.5 | 17 | 4294 | ||||
| 29 | 1302 | 1316 | 1325 | M1.1 | 17 | 4294 | ||||
| 29 | 1536 | 1607 | 1632 | M2.8 | ||||||
| 29 | 2004 | 2014 | 2017 | S18E80 | M1.4 | SF | 17 | 4294 | ||
| 29 | 2134 | 2148 | 2154 | S18E72 | M1.4 | 1N | 17 | 4294 |
| LOC: approximate heliographic location | TYPE: radio burst type |
| XRAY: X-ray flare class | Cat: Catania sunspot group number |
| OP: optical flare class | NOAA: NOAA active region number |
| 10CM: peak 10 cm radio flux |
Geomagnetic Observations in Belgium
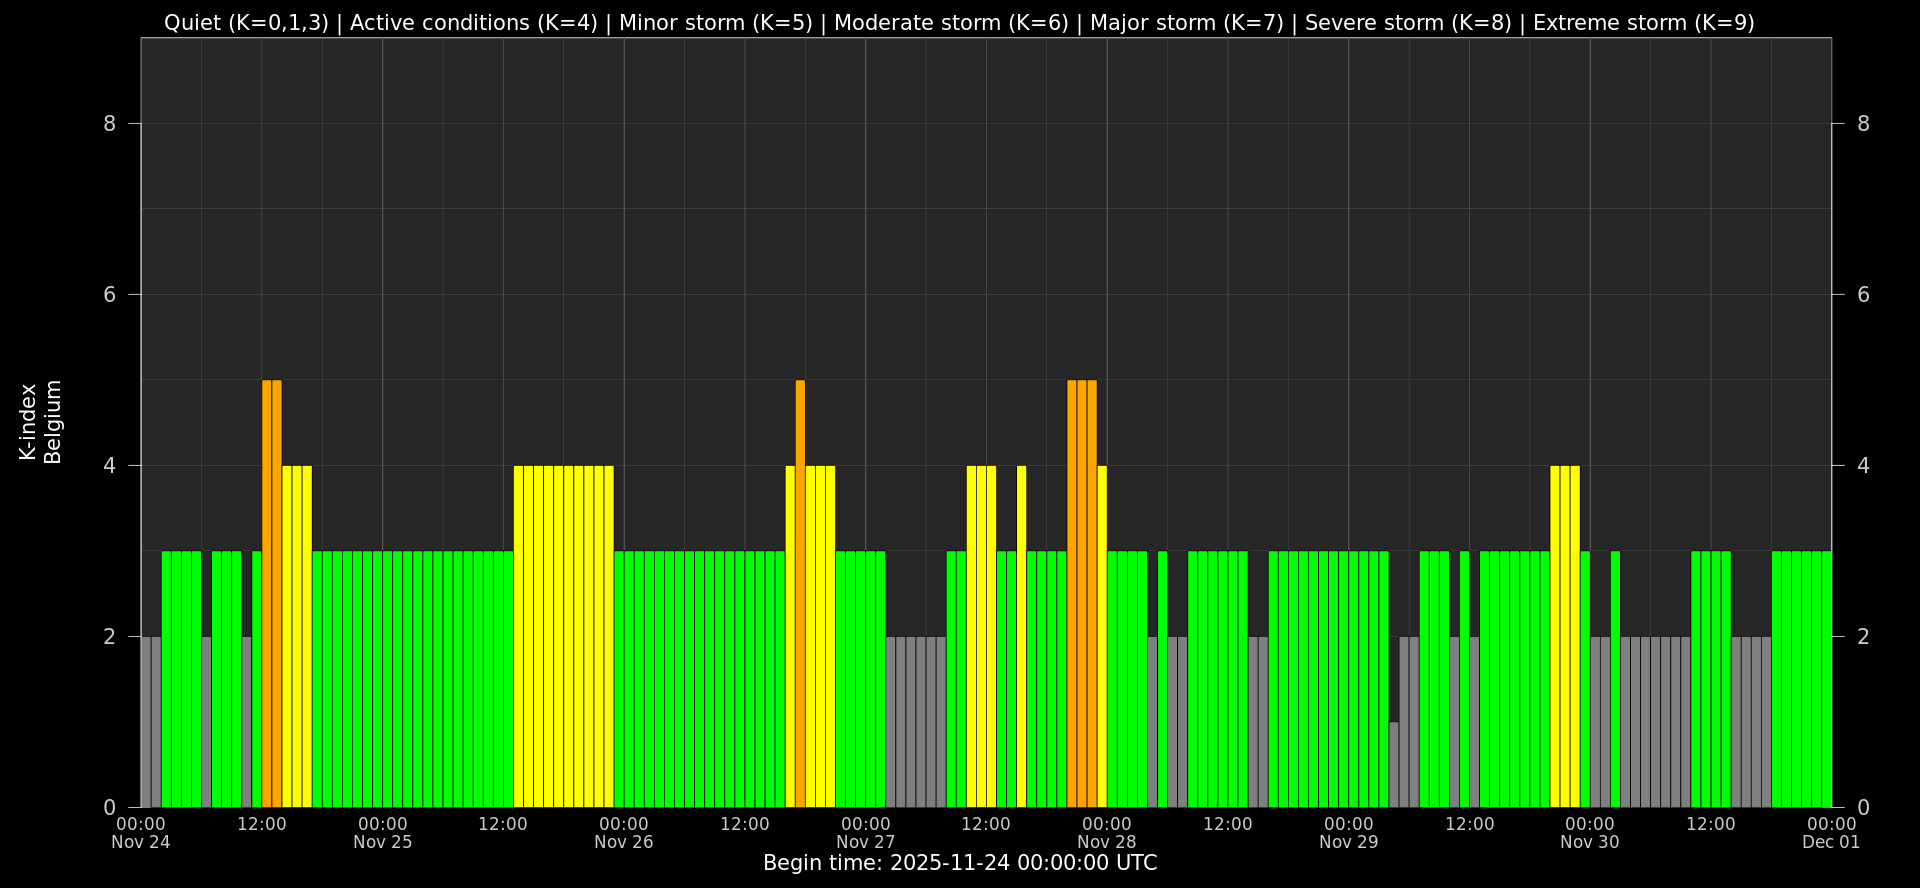
Local K-type magnetic activity index for Belgium based on data from Dourbes (DOU) and Manhay (MAB). Comparing the data from both measurement stations allows to reliably remove outliers from the magnetic data. At the same time the operational service availability is improved: whenever data from one observatory is not available, the single-station index obtained from the other can be used as a fallback system.
Both the two-station index and the single station indices are available here: http://ionosphere.meteo.be/geomagnetism/K_BEL/
The SIDC Space Weather Briefing
The forecaster on duty presented the SIDC briefing that gives an overview of space weather from to .
The pdf of the presentation: https://www.stce.be/briefings/20251201_SWbriefing.pdf

Review of Ionospheric Activity


VTEC time series at 3 locations in Europe from 24 Nov 2025 till 30 Nov 2025
The top figure shows the time evolution of the Vertical Total Electron Content (VTEC) (in red) during the last week at three locations:
a) in the northern part of Europe(N 61deg E 5deg)
b) above Brussels(N 50.5deg, E 4.5 deg)
c) in the southern part of Europe(N 36 deg, E 5deg)
This top figure also shows (in grey) the normal ionospheric behaviour expected based on the median VTEC from the 15 previous days.
The time series below shows the VTEC difference (in green) and relative difference (in blue) with respect to the median of the last 15 days in the North, Mid (above Brussels) and South of Europe. It thus illustrates the VTEC deviation from normal quiet behaviour.
The VTEC is expressed in TECu (with TECu=10^16 electrons per square meter) and is directly related to the signal propagation delay due to the ionosphere (in figure: delay on GPS L1 frequency).
The Sun's radiation ionizes the Earth's upper atmosphere, the ionosphere, located from about 60km to 1000km above the Earth's surface.The ionization process in the ionosphere produces ions and free electrons. These electrons perturb the propagation of the GNSS (Global Navigation Satellite System) signals by inducing a so-called ionospheric delay.
See http://stce.be/newsletter/GNSS_final.pdf for some more explanations; for more information, see https://gnss.be/SpaceWeather
STCE training courses and lectures
Courses, seminars, presentations and events with the Sun-Space-Earth system and Space Weather as the main theme. We provide occasions to get submerged in our world through educational, informative and instructive activities.
* Feb 9-11, 2026, STCE Space Weather Introductory Course, Brussels, Belgium - register: https://events.spacepole.be/event/255/
* Mar 16-18, 2026, STCE course: Role of the ionosphere and space weather in military communications, Brussels, Belgium - register: https://events.spacepole.be/event/258/
* Apr 20-21, 2026, STCE cursus: inleiding tot het ruimteweer, Brussels, Belgium - register: https://events.spacepole.be/event/260/
* Mar 23, 2026, STCE lecture: From physics to forecasting, Space Weather course, ESA Academy, Redu, Belgium
* Jun 15-17, 2026, STCE Space Weather Introductory Course, Brussels, Belgium - register: https://events.spacepole.be/event/256/
* Oct 12-14, 2026, STCE Space Weather Introductory Course, Brussels, Belgium - register: https://events.spacepole.be/event/257/
* Nov 23-25, 2026, STCE course: Role of the ionosphere and space weather in military communications, Brussels, Belgium - register: https://events.spacepole.be/event/259/
* Dec 7-9, 2026, STCE Space Weather Introductory Course for Aviation, Brussels, Belgium - register: https://events.spacepole.be/event/262/
To register for a course and check the seminar details, navigate to the STCE Space Weather Education Center: https://www.stce.be/SWEC
If you want your event in the STCE newsletter, contact us: stce_coordination at stce.be
Website: https://www.stce.be/SWEC